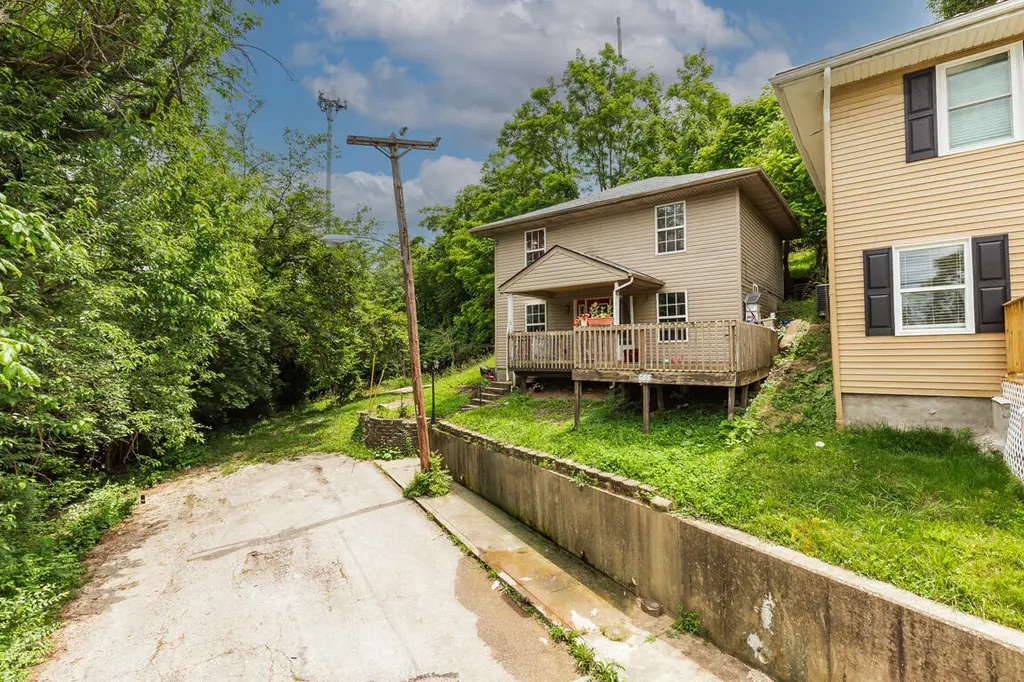
638 Brooklyn Ave · Dayton, KY
Flood risk 1/10 · Minimal
- FEMA flood zone
- X (unshaded)
- Chance of flooding over 30 yrs
- 0.0%
- Est. flood insurance / yr
- $507 – $1,088
Fire risk 1/10 · Minimal
- Est. fire insurance / yr
- $839 – $1,559
Heat risk 4/10 · Minor
- Hot days now (above 103°F)
- 7 days/yr
- Hot days in 30 yrs
- 17 days/yr
Wind risk 2/10 · Minimal
- Chance of severe wind over 30 yrs
- 1.0%
Air-quality risk 3/10 · Minor
- Unhealthy air days now
- 2 days/yr
- Unhealthy air days in 30 yrs
- 3 days/yr
Risk factors via First Street. Map © Google.
Why this score? — see what drove the B grade
The composite is a weighted blend of 9 inputs, each scored 0–100. Each bar is that input's sub-score; the figure is the points it added to the 100-point composite (weight × sub-score).
- Cash flow +28.6/30.0
- ARV discount +15.0/15.0
- DSCR +10.0/10.0
- 1% rule +7.2/10.0
- Rent growth +4.3/5.0
- Livability +4.0/5.0
- Condition / age +2.5/5.0
- Schools +2.3/10.0
- Appreciation +0.0/10.0
$220,000
🖨 Deal sheet (PDF) 📄 Offer letter ✓ Due diligence
Listing remarks MLS
Home has been completely redone, all new windows, lots of closet space-2 full baths-new kitchen cabinets, new carpet thurout-study upstairs could be 4th bdrm, new furnace and water heater
Key facts
- Bright white kitchen
- Electric fireplace
- Durable lvp flooring
Tags
Property features AI
Exterior
- Parking: On-street parking
- Utilities: Public water; Public sewer; Cable available; Natural gas available
- Home design: Single family residence; Two levels; House
- Construction: Vinyl siding; Block foundation
- Exterior features: Covered patio/porch; Deck; Porch; Vinyl window frames; Shingle roof; Sloped lot; Paved road frontage on a city street; Has view
Interior
- Kitchen: Electric cooktop; Electric oven; Gas range; Gas oven; Dishwasher; Microwave; Refrigerator
- Bedrooms: Primary Bedroom (13 x 12); Bedroom 2 (12 x 11); Bedroom 3 (11 x 11); Bedroom 4 (11 x 8)
- Bathrooms: 2 full bathrooms; Primary Bath (8 x 7); Bathroom 2 (8 x 5)
- Heating & cooling: Central air conditioning; Has heating
- Interior features: Storage; Pantry; Granite counters; Ceiling fans; Decorative electric fireplace
- Laundry & utility: Laundry on main level
Neighborhood map
What this means for you Summary
Snapshot
- This is a 3-bed/2.0-bath single-family listed at $220k.
Deal economics
- At list price, monthly cash flow is $725 ($9k/yr) — positive.
- The deal already cash-flows at list — no discount required.
- Meets the 1% rule at list price ($3k rent vs $220k).
- Cap rate 10.2% vs local median 6.9% in Dayton — top-decile yield for the area; either an underpriced asset or a hidden risk that comps aren't pricing in. Stress-test before assuming the spread holds.
Location & tenants
- Location reads 81/100 on livability (#67 in KY, #1,485 nationally) — a professional / high-income tenant draw. Strengths: commute A+, cost of living A+, housing A+; Watch: employment D+.
- Dayton Independent (suburban): math 23% / reading 32% proficiency, ranked #129 of 165 in KY (top 78%) — low school quality limits family demand, transient renter base, plan for 1-2y turnover; 71% free/reduced lunch — lower-income household profile, screen leases tightly.
- Zoned schools: Lincoln Elementary School (math 20% / reading 29%, grade F, #489 of 676 statewide, top 76%, 487 students, 82% FRL); Dayton High School (math 27% / reading 37%, grade F, #97 of 254 statewide, top 46%, 372 students, 78% FRL).
- Market conditions: Rents rising fast (+7.2%/yr); 53 active listings in the ZIP; 8 comparable units currently listed for rent nearby; rentals leasing fast (median 3d on market — plan ~1-2 weeks tenant-placement turnaround); 247 units permitted in Campbell County in 2024 (77 in 5+ unit buildings).
- At $2,687/mo this rent would consume 49% of the median local household income ($66k/yr) (locally 215% of renters already pay >50% of income on rent) — very limited rent-growth headroom before tenants either downsize or default.
Forward outlook
- Local home prices are declining (-3.0%/yr); year-one equity from $2k of loan paydown is wiped out by about $7k of value loss. Plan a longer hold.
- At projected returns (-3.0% appreciation + 7.2% rent growth), your $62k cash investment doubles in ~7 years — after that, you're playing with house money.
Negotiation context
- Only 10 days on market — expect competitive offers; lowballing is unlikely to land.
- 2 sale attempts since 24y ago with the ask held roughly flat each time — persistent listings suggest the price (not the market) is what's stuck; bring a comps-based counter.
- Current owner paid $142k; list at $220k implies a 55% gain — meaningful room to come down on a strong offer.
Risks & watch-outs
- Watch-outs: built in 1915 — expect roof / HVAC / electrical / plumbing capex.
Questions for the listing agent
- Built in 1915 — when were the roof, HVAC, electrical panel, plumbing, and water heater last replaced?
- Is there a deadline driving the sale (1031 exchange, divorce, estate, relocation)? That informs how much negotiation room exists.
- Schools are D-rated, which usually means shorter tenancies and higher turnover. Who's the typical renter profile here, and what's been the actual vacancy rate?
- What's the average days-on-market for RENTAL listings here right now (not sales)? A rising rental-DOM trend means longer vacancies and softer asking-rent achievability than the comps imply.
- What's the recent tenant-quality profile in this submarket — average credit score on applications, eviction rate, late-payment / NSF rate, and stable-employment percentage? A property-management company in the area should have these aggregated.
- How much new for-sale + rental construction is in the pipeline within 1–3 miles? Heavy new supply typically softens prices + rents 12–24 months out; constrained supply supports both.
Investment metrics
- 1% rule
- 1.22% ✓
- Cap rate
- 10.25%
- Cash-on-cash
- 14.12%
- DSCR
- 1.63
- GRM
- 6.8
CMA / ARV
- ARV (on-the-fly)
- $388,080
- Comps found
- 11
Show comp detail 11 sales within ~0.75 mi
| Address | Dist | Beds/Ba | Sqft | Sold | Price | $/sf | Match |
|---|---|---|---|---|---|---|---|
| 1114 Dayton Ave | 0.17mi | 3/3.0 | 2,352 (0%) | 9mo | $310,000 | $132 | 80 |
| 707 Ervin Ter | 0.31mi | 3/2.5 | 2,227 (-5%) | 5mo | $480,000 | $216 | 71 |
| 815 6th Ave | 0.15mi | 4/2.0 (+1) | 2,216 (-6%) | 11mo | $213,500 | $96 | 70 |
| 272 Van Voast Ave | 0.63mi | 3/2.0 | 2,330 (-1%) | 14mo | $385,000 | $165 | 58 |
| 314 Dayton Ave | 0.33mi | 4/2.5 (+1) | 2,081 (-12%) | 5mo | $354,500 | $170 | 54 |
| 305 6th Ave | 0.42mi | 4/2.0 (+1) | 2,218 (-6%) | 17mo | $200,000 | $90 | 51 |
| 706 Ervin Ter | 0.33mi | 4/2.5 (+1) | 2,220 (-6%) | 22mo | $345,000 | $155 | 50 |
| 702 Ervin Ter | 0.34mi | 3/2.0 | 2,000 (-15%) | 13mo | $394,000 | $197 | 48 |
| 223 Foote Ave | 0.72mi | 4/2.5 (+1) | 2,253 (-4%) | 21mo | $400,000 | $178 | 35 |
| 703 Fairfield Ave | 0.64mi | 3/2.0 | 2,114 (-10%) | 23mo | $150,000 | $71 | 34 |
| 249 Van Voast Ave | 0.61mi | 3/2.0 | 2,048 (-13%) | 22mo | $439,900 | $215 | 31 |
Match score weights: distance 35% · size 25% · config 20% · recency 20%. Top-matched comps best support the ARV.
Projected returns pro-forma
-3.0% appreciation · 7.15% rent growth · sell at horizon
- IRR
- 8.8%
- Equity multiple
- 1.36×
- Total profit
- $22,180
- Equity at exit
- $32,803
- IRR
- 21.1%
- Equity multiple
- 3.12×
- Total profit
- $130,880
- Equity at exit
- $19,022
Cash invested: $61,600 (down + closing). Projections, not guarantees.
Landlord ↔ Tenant lean methodology
- Overall (STATE)
- 83 Strongly Landlord-Friendly
- State Kentucky
- 83 Strongly Landlord-Friendly · R+16
- County
- — inherits STATE
- City
- — inherits STATE
ZIP-level market 41074
- Rents YoY
- 7.2%
- Active inventory
- 53
- Price-to-rent
- 6.8×
Monthly cashflow live
- Estimated rent
- $2,687 high interval (Pro) →
- Mortgage (P&I)
- −$1,154
- Tax from tax record
- −$152 /mo · $1,826/yr
- Insurance
- −$92
- HOA
- −$0
- Vacancy / Maint / Mgmt
- −$564
- Net cashflow
- $725
Break-even live
Sensitivity live
| Price | -10% $850 | -5% $787 | +0% $725 | +5% $663 | +10% $600 |
|---|---|---|---|---|---|
| Rent | -10% $513 | -5% $619 | +0% $725 | +5% $831 | +10% $937 |
| Rate | -1.0pp $836 | -0.5pp $781 | base $725 | +0.5pp $668 | +1.0pp $610 |
UW: 25.0% down · 7.5% · 30yr · 1.5% tax · 5.0% vac · 8.0% maint · 8.0% mgmt
Financing live
Cash to close
- Down payment
- $55,000
- Closing costs
- $6,600
- Reserves months
- —
- Total cash needed
- —
Loan-product check · same deal, 3 products live
Conventional
25% down · 7.5% · 30yr
- Down + closing
- —
- Monthly P&I
- —
- Monthly cashflow
- —
- DSCR
- —
- Eligible?
- —
Personal DTI + credit; lowest rate.
DSCR
20% down · 8.5% · 30yr
- Down + closing
- —
- Monthly P&I
- —
- Monthly cashflow
- —
- DSCR
- —
- Eligible?
- —
No personal income docs; deal must DSCR.
Hard money
10% down · 12.0% · 12mo
- Down + closing
- —
- Monthly P&I
- —
- Monthly cashflow
- —
- DSCR
- —
- Eligible?
- —
Short-term bridge; refi at stabilization.
Rent comps 8 comps
| Address | Beds | Baths | Sqft | Rent | $/sqft | DOM | Units | Dist |
|---|---|---|---|---|---|---|---|---|
| 327 Covert Run Pike Unit 1 Bellevue, KY | 2.0 | 2.0 | 1580 | $1,850 | $1.17 | 24d | 1 | 0.90mi |
| 1228 E McMillan St Cincinnati, OH | 1.0–2.0 | 1.0–2.0 | 1340 | $2,327 | $1.74 | 2d | 14 | 1.23mi |
| 2331 Park Ave Unit 1 Cincinnati, OH | 3.0 | 2.5 | 2200 | $2,350 | $1.07 | 2d | 1 | 1.23mi |
| 923 Rogers Pl Cincinnati, OH | 3.0 | 1.0 | 2061 | $1,600 | $0.78 | 24d | 1 | 1.39mi |
| 918 Windsor St Cincinnati, OH | 3.0 | 1.0 | 2583 | $1,675 | $0.65 | 24d | 1 | 1.41mi |
| 143 Capri Dr Fort Thomas, KY | 4.0 | 2.0 | 2200 | $3,400 | $1.55 | 2d | 1 | 1.43mi |
| 118 Beech St Newport, KY | 3.0 | 2.0 | 1610 | $2,400 | $1.49 | 2d | 1 | 1.43mi |
| 987 Hill St Cincinnati, OH | 3.0 | 3.0 | 2878 | $7,000 | $2.43 | 2d | 1 | 1.45mi |
Listing history 7 events
-
2026-06-21days on market $220,000 Active 10 DOM
-
2026-06-18days on market $220,000 Active 7 DOM
-
2026-06-17days on market $220,000 Active 6 DOM
-
2026-06-16days on market $220,000 Active 5 DOM
-
2026-06-15days on market $220,000 Active 4 DOM
-
2026-06-13remarks 699-char remark
-
2026-06-13$220,000 Active 2 DOM
ⓘ Source: listings_history table (triggers on properties + properties_extension) + one-shot
backfill from property_details.listing_events for pre-trigger history.
Tax reassessment forecast KY · Resets to sale price
- Current annual tax
- $1,826 · $152/mo
- Projected year-2 tax
- $1,892 · $158/mo
- Expected delta
- +$66/yr (+$5/mo · 3.6%)
ⓘ Screening estimate from a state-policy table — verify with the county assessor before closing.
Climate risk First Street
- Flood 1/10 Low FEMA zone X (unshaded) · 0% chance over 30 yrs
- Wildfire 1/10 Low
- Heat 4/10 Moderate 7 d/yr ≥103°F today · 17 d/yr by 30 yrs out
- Wind 2/10 Low 100% chance of damaging wind over 30 yrs
- Air quality 3/10 Moderate 2 unhealthy d/yr today · 3 by 30 yrs out
Nearby sold comps map
Loading sold comps map…
Walkable amenities ~0.75 mi
Loading nearby amenities…
Taxation est. · year 1
- Rental income
- $32,242
- − Mortgage interest
- −$12,323
- − Property taxes
- −$1,826
- − Insurance
- −$1,100
- − Repairs & maintenance
- −$2,579
- − Management
- −$2,579
- − Depreciation
- −$6,400
- Taxable income
- $5,433
- Est. tax owed @ 24.0%
- −$1,304
- After-tax cash flow
- $7,396/yr
For passive investors: Depreciation is non-cash, so a rental often shows a tax loss while cash-flowing — sheltering income. Rental losses are passive: they offset passive income freely, and up to $25,000/yr can offset ordinary (W-2) income if you actively participate and your MAGI is under $100k (phasing out to $0 by $150k); unused losses carry forward. On sale, claimed depreciation is recaptured at up to 25%, and gains may owe capital-gains tax (a 1031 exchange can defer both). Figures are a year-1 estimate at your 24.0% rate — not tax advice; consult a CPA.
Schools (NCES district)
- District
- Dayton Independent
- NCES district ID
- 2101530
- Math proficiency
- 23% ▼ -13.00%
- Reading proficiency
- 32% ▼ -12.00%
- Median HH income
- $38,533
- Composite
- 23.0/100
- National rank
- #7978
- State rank
- #129 of 165 in KY
Livability — Dayton
- Score
- 81/100
- State rank
- #67
- US rank
- #1485
Category grades
Schools grade is shown separately in the Schools card above.
Census & demographics
- Census place
- Dayton, KY
- County
- Campbell County · 84,793 people
- City population
- 5,756
- Metro
- Cincinnati, OH-KY-IN
- Population (ZIP)
- 5,756
- Household income
- $66,087
- Rent vs Own
- Severe rent burden
- 215.0
Population outlook (Campbell County) Hauer SSP2
- Today (2025)
- 95,668 people
- By 2030
- 96,886 · +1.3%
- By 2040
- 97,734 · +2.2%
- By 2050
- 96,413 · +0.8%
- By 2075
- 90,211 · -5.7%
- By 2100
- 79,434 · -17.0%
Race, ethnicity, and origin ACS 2023
- Neighborhood character
- Predominantly White (89%)
- Race & ethnicity
- White 89% Two or more races 7% Hispanic / Latino 3% Black 1%
- Common ancestry
- Slovak 5% Italian 3% Lithuanian 2%
- Foreign-born
- 2% · Canada
- Languages at home
- 98% English-only · Spanish 1%
Political lean MEDSL · Campbell
- 2024 margin
- R (+19.7) · D 39.2% · R 58.9% · Other 1.9%
- 2008→2024 swing
- +1.2pp toward D · 2008: -20.9pp · 2024: -19.7pp
- All cycles
- 2024: R+19.7 2020: R+18.6 2016: R+24.5 2012: R+22.8 2008: R+20.9
Not yet ingested
- Civics
- —
Market trends
- HPI YoY
- ▼ -171.48%
- Current HPI
- 235.1437
- Rent YoY
- ▲ 7.15%
- Metro
- Cincinnati, OH-KY-IN
- State GDP YoY
- ▲ 1.81%
- F500 in state
- 4
Industry mix (Fortune 500 HQ in KY)
| Industry | F500 HQs | Revenue |
|---|---|---|
| Healthcare | 1 | $118B |
|
||
| Food / Beverage | 1 | $7B |
|
||
Price history
+176.7% since first listed6 events — show timeline
- 2026-06-11 Listed $220,000 NKMLS
- 2024-01-05 Sold (Public Records) $142,000 Public Records
- 2023-10-11 Sold (Public Records) $89,500 Public Records
- 2003-03-11 Sold (Public Records) $83,000 Public Records
- 2003-03-07 Sold (MLS) $83,000 NKMLS
- 2002-12-05 Listed $79,500 NKMLS
Property tax history
+3.5%/yrLatest (2025): $1,826 · +0.5% YoY. Source: county tax records.
Cash-flow waterfall
monthlySold comps — $/sqft
last 12 mo · ≤1 miLoading sold comps…