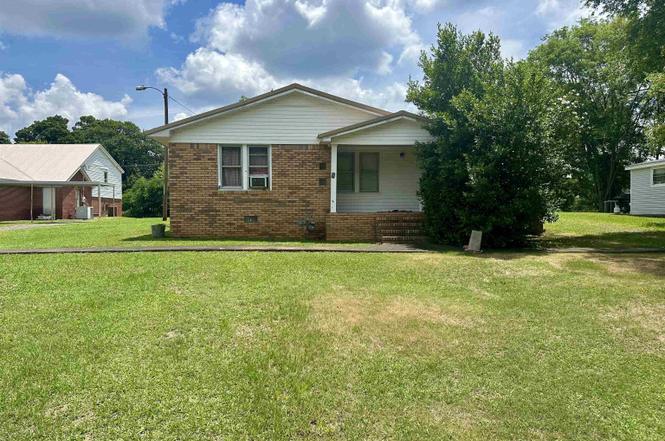
409 Magnolia Ave · Saks, AL
Flood risk 1/10 · Minimal
- FEMA flood zone
- X (unshaded)
- Chance of flooding over 30 yrs
- 0.0%
- Est. flood insurance / yr
- $507 – $1,088
Fire risk 4/10 · Minor
- Est. fire insurance / yr
- $916 – $1,700
Heat risk 6/10 · Moderate
- Hot days now (above 105°F)
- 7 days/yr
- Hot days in 30 yrs
- 19 days/yr
Wind risk 6/10 · Moderate
- Chance of severe wind over 30 yrs
- 27.0%
Air-quality risk 2/10 · Minimal
- Unhealthy air days now
- 1 days/yr
- Unhealthy air days in 30 yrs
- 1 days/yr
Risk factors via First Street. Map © Google.
Why this score? — see what drove the B- grade
The composite is a weighted blend of 9 inputs, each scored 0–100. Each bar is that input's sub-score; the figure is the points it added to the 100-point composite (weight × sub-score).
- Cash flow +30.0/30.0
- 1% rule +10.0/10.0
- DSCR +10.0/10.0
- ARV discount +7.5/15.0
- Schools +2.9/10.0
- Livability +2.8/5.0
- Rent growth +2.5/5.0
- Condition / age +2.5/5.0
- Appreciation +0.0/10.0
$49,900
🖨 Deal sheet 📄 Offer letter ✓ Due diligence
Listing remarks
Attention investors and flippers! This property is bursting with opportunity and ready for your vision. Featuring 3 generously sized bedrooms and 2 full bathrooms, each with a convenient tub/shower combination, this home offers a solid foundation for your next renovation project. Step inside to discover an open-concept living area that flows seamlessly into the kitchen, creating a layout that today's buyers love. A dedicated laundry room, adds everyday convenience and value. Don't miss your chance to transform this hidden gem into something truly special!
Key facts
- 8,712 sq ft lot
- Built 1939
- Listed 2 days
Tags
Property features AI
Finance
- Other: Residential property (not new construction)
- HOA & community: No homeowners association; Subdivision: Anniston City
Exterior
- Parking: Dirt driveway
- Utilities: Public water; Septic tank sewer
- Home design: Single-family residence; Built in 1939
- Construction: 1,471 square feet living area
- Exterior features: Public water; Septic tank sewer
Interior
- Bathrooms: 2 full bathrooms
- Heating & cooling: Wall furnace heating; Multiple window air conditioning units (2+)
- Interior features: Total of 10 rooms; Crawl space basement
Neighborhood map
What this means for you Summary
Snapshot
- This is a 3-bed/2.0-bath single-family listed at $50k.
Deal economics
- At list price, monthly cash flow is $531 ($6k/yr) — positive.
- The deal already cash-flows at list — no discount required.
- Meets the 1% rule at list price ($1k rent vs $50k).
- Cap rate 19.1% vs local median 5.4% in Saks — top-decile yield for the area; either an underpriced asset or a hidden risk that comps aren't pricing in. Stress-test before assuming the spread holds.
Location & tenants
- Location reads 56/100 on livability (#413 in AL) — a working-class tenant base; expect higher turnover. Strengths: cost of living A+, housing A; Watch: crime D+, employment D, amenities F.
- Calhoun County (rural): math 19% / reading 49% proficiency, ranked #46 of 129 in AL (top 36%) — families likely to look elsewhere, expect single-tenant / working-renter base with shorter leases.
- Zoned schools: Saks Elementary School (math 17% / reading 47%, grade F, #331 of 627 statewide, top 57%, 459 students, 86% FRL); Saks Middle School (math 8% / reading 38%, grade F, #176 of 257 statewide, top 70%, 301 students, 86% FRL); Saks High School (math 12% / reading 17%, grade F, #220 of 305 statewide, top 77%, 340 students, 77% FRL) — zoned schools average 83% FRL vs 49% district-wide (34 pts higher); higher-poverty schools than district average — tighter screening recommended.
- Market conditions: 73 active listings in the ZIP; 3 comparable units currently listed for rent nearby; rentals lingering (median 44d on market — plan ~5-8 weeks vacancy on turnover, expect pricing pressure); 100% of comp listings sitting > 30 days — soft ceiling on asking rent; 135 units permitted in Calhoun County in 2024 (0 in 5+ unit buildings).
Forward outlook
- Local home prices are declining (-3.0%/yr); year-one equity from $345 of loan paydown is wiped out by about $1k of value loss. Plan a longer hold.
- Calhoun County population projected at -21% by 2050 — secular population decline; favor cash flow + early exit over multi-decade hold.
- At projected returns (-3.0% appreciation + 3.0% rent growth), your $14k cash investment doubles in ~3 years — after that, you're playing with house money.
Negotiation context
- Only 3 days on market — expect competitive offers; lowballing is unlikely to land.
Risks & watch-outs
- Watch-outs: built in 1939 — expect roof / HVAC / electrical / plumbing capex.
- Climate carrying-cost: major wind risk, 27% chance of damaging wind over 30y; extreme-heat days projected 7→19/yr by 2055 (HVAC capex compounding) — expect insurance premiums to compound above CPI over the hold.
Questions for the listing agent
- Built in 1939 — when were the roof, HVAC, electrical panel, plumbing, and water heater last replaced?
- Is there a deadline driving the sale (1031 exchange, divorce, estate, relocation)? That informs how much negotiation room exists.
- Schools are F-rated, which usually means shorter tenancies and higher turnover. Who's the typical renter profile here, and what's been the actual vacancy rate?
- Crime grade is D in this area — have there been break-ins, vandalism, or insurance claims at this property in the last 3 years? What carrier currently insures it and at what premium?
- What's the average days-on-market for RENTAL listings here right now (not sales)? A rising rental-DOM trend means longer vacancies and softer asking-rent achievability than the comps imply.
- What's the recent tenant-quality profile in this submarket — average credit score on applications, eviction rate, late-payment / NSF rate, and stable-employment percentage? A property-management company in the area should have these aggregated.
- How much new for-sale + rental construction is in the pipeline within 1–3 miles? Heavy new supply typically softens prices + rents 12–24 months out; constrained supply supports both.
Investment metrics
- 1% rule
- 2.22% ✓
- Cap rate
- 19.06%
- Cash-on-cash
- 45.60%
- DSCR
- 3.03
- GRM
- 3.8
CMA / ARV
- ARV (on-the-fly)
- $131,502
- Comps found
- 12
Show comp detail 12 sales within ~0.75 mi
| Address | Dist | Beds/Ba | Sqft | Sold | Price | $/sf | Match |
|---|---|---|---|---|---|---|---|
| 4110 Skyline Dr | 0.34mi | 3/2.0 | 1,285 (-1%) | 2mo | $160,000 | $125 | 81 |
| 2921 Walnut Ave | 0.63mi | 3/2.0 | 1,314 (+1%) | 1mo | $28,000 | $21 | 68 |
| 326 W 41st St | 0.24mi | 3/1.0 | 1,387 (+6%) | 8mo | $125,000 | $90 | 67 |
| 4108 Saks Rd | 0.32mi | 3/1.0 | 1,172 (-10%) | 2mo | $139,500 | $119 | 63 |
| 1033 W 33rd St | 0.53mi | 3/1.0 | 1,242 (-5%) | 1mo | $99,000 | $80 | 63 |
| 314 W 41st St | 0.24mi | 3/1.0 | 1,489 (+14%) | 2mo | $150,000 | $101 | 59 |
| 118 W 35th St | 0.35mi | 2/1.0 (-1) | 1,216 (-7%) | 8mo | $88,000 | $72 | 57 |
| 3904 Calhoun Ave | 0.48mi | 3/1.0 | 1,204 (-8%) | 5mo | $161,700 | $134 | 57 |
| 4030 Ridge Dr | 0.26mi | 2/1.0 (-1) | 1,115 (-14%) | 6mo | $119,000 | $107 | 50 |
| 4100 Bryan Ave | 0.48mi | 3/1.0 | 1,132 (-13%) | 3mo | $86,000 | $76 | 49 |
| 3014 Walnut Ave | 0.54mi | 3/1.5 | 1,150 (-12%) | 10mo | $144,500 | $126 | 45 |
| 3912 Cross St N | 0.63mi | 2/1.0 (-1) | 1,143 (-12%) | 9mo | $67,000 | $59 | 34 |
Match score weights: distance 35% · size 25% · config 20% · recency 20%. Top-matched comps best support the ARV.
Projected returns pro-forma
-3.0% appreciation · 3.0% rent growth · sell at horizon
- IRR
- 42.8%
- Equity multiple
- 2.84×
- Total profit
- $25,747
- Equity at exit
- $7,440
- IRR
- 48.9%
- Equity multiple
- 5.73×
- Total profit
- $66,031
- Equity at exit
- $4,314
Cash invested: $13,972 (down + closing). Projections, not guarantees.
Landlord ↔ Tenant lean methodology
- Overall (STATE)
- 90 Strongly Landlord-Friendly
- State Alabama
- 90 Strongly Landlord-Friendly · R+15
- County
- — inherits STATE
- City
- — inherits STATE
ZIP-level market 36201
- Active inventory
- 73
- Price-to-rent
- 3.8×
Monthly cashflow live
- Estimated rent
- $1,109 medium interval (Pro) →
- Mortgage (P&I)
- −$262
- Tax est. 1.5%
- −$62 /mo · $748/yr
- Insurance
- −$21
- HOA
- −$0
- Vacancy / Maint / Mgmt
- −$233
- Net cashflow
- $531
Break-even live
UW: 25.0% down · 7.5% · 30yr · 1.5% tax · 5.0% vac · 8.0% maint · 8.0% mgmt
Financing live
Cash to close
- Down payment
- $12,475
- Closing costs
- $1,497
- Reserves months
- —
- Total cash needed
- —
Loan-product check · same deal, 3 products live
Conventional
25% down · 7.5% · 30yr
- Down + closing
- —
- Monthly P&I
- —
- Monthly cashflow
- —
- DSCR
- —
- Eligible?
- —
Personal DTI + credit; lowest rate.
DSCR
20% down · 8.5% · 30yr
- Down + closing
- —
- Monthly P&I
- —
- Monthly cashflow
- —
- DSCR
- —
- Eligible?
- —
No personal income docs; deal must DSCR.
Hard money
10% down · 12.0% · 12mo
- Down + closing
- —
- Monthly P&I
- —
- Monthly cashflow
- —
- DSCR
- —
- Eligible?
- —
Short-term bridge; refi at stabilization.
Rent comps 3 comps
| Address | Beds | Baths | Sqft | Rent | $/sqft | DOM | Units | Dist |
|---|---|---|---|---|---|---|---|---|
| 305 Dogwood Ave Anniston, AL | 3.0 | 2.0 | 1015 | $1,100 | $1.08 | 43d | 1 | 0.12mi |
| 323 W 22nd St Anniston, AL | 2.0 | 1.0 | 1194 | $950 | $0.80 | 43d | 1 | 1.38mi |
| 2117 Moore Ave Unit NA Anniston, AL | 2.0 | 1.0 | 1102 | $1,385 | $1.26 | 43d | 1 | 1.44mi |
Listing history 4 events
-
2026-06-19days on market $49,900 Active 3 DOM
-
2026-06-18days on market $49,900 Active 2 DOM
-
2026-06-17remarks 561-char remark
-
2026-06-17$49,900 Active 1 DOM
ⓘ Source: listings_history table (triggers on properties + properties_extension) + one-shot
backfill from property_details.listing_events for pre-trigger history.
Climate risk First Street
- Flood 1/10 Low FEMA zone X (unshaded) · 0% chance over 30 yrs
- Wildfire 4/10 Moderate
- Heat 6/10 Major 7 d/yr ≥105°F today · 19 d/yr by 30 yrs out
- Wind 6/10 Major 27% chance of damaging wind over 30 yrs
- Air quality 2/10 Low 1 unhealthy d/yr today · 1 by 30 yrs out
Nearby sold comps map
Loading sold comps map…
Walkable amenities ~0.75 mi
Loading nearby amenities…
Taxation est. · year 1
- Rental income
- $13,303
- − Mortgage interest
- −$2,795
- − Property taxes
- −$748
- − Insurance
- −$250
- − Repairs & maintenance
- −$1,064
- − Management
- −$1,064
- − Depreciation
- −$1,452
- Taxable income
- $5,930
- Est. tax owed @ 24.0%
- −$1,423
- After-tax cash flow
- $4,948/yr
For passive investors: Depreciation is non-cash, so a rental often shows a tax loss while cash-flowing — sheltering income. Rental losses are passive: they offset passive income freely, and up to $25,000/yr can offset ordinary (W-2) income if you actively participate and your MAGI is under $100k (phasing out to $0 by $150k); unused losses carry forward. On sale, claimed depreciation is recaptured at up to 25%, and gains may owe capital-gains tax (a 1031 exchange can defer both). Figures are a year-1 estimate at your 24.0% rate — not tax advice; consult a CPA.
Schools (NCES district)
- District
- Calhoun County
- NCES district ID
- 0100540
- Math proficiency
- 19% ▼ -26.00%
- Reading proficiency
- 49% ▬ 0.00%
- Median HH income
- $44,891
- Composite
- 28.91/100
- National rank
- #6635
- State rank
- #46 of 129 in AL
Livability — Saks
- Score
- 56/100
- State rank
- #413
- US rank
- #22683
Category grades
Schools grade is shown separately in the Schools card above.
Census & demographics
- Census place
- Saks, AL
- City population
- 11,172
- Population (ZIP)
- 17,406
Population outlook (Calhoun County) Hauer SSP2
- Today (2025)
- 109,765 people
- By 2030
- 105,708 · -3.7%
- By 2040
- 96,192 · -12.4%
- By 2050
- 86,413 · -21.3%
- By 2075
- 63,467 · -42.2%
- By 2100
- 44,704 · -59.3%
Race, ethnicity, and origin ACS 2023
- Neighborhood character
- Diverse neighborhood (Simpson 0.57)
- Race & ethnicity
- White 47% Black 46% Two or more races 5% Hispanic / Latino 3%
- Common ancestry
- Lithuanian 2% Slovak 1% Scandinavian 1%
- Foreign-born
- 2% · Canada
- Languages at home
- 98% English-only · Spanish 2%
Political lean MEDSL · Calhoun
- 2024 margin
- Solid R (+44.8) · D 27.2% · R 71.9%
- 2008→2024 swing
- -12.2pp toward R · 2008: -32.5pp · 2024: -44.8pp
- All cycles
- 2024: R+44.8 2020: R+39.0 2016: R+41.4 2012: R+31.9 2008: R+32.5
Not yet ingested
- Civics
- —
Market trends
- HPI YoY
- ▼ -78.92%
- Current HPI
- 59.1512
- Rent YoY
- —
- Metro
- —
- State GDP YoY
- ▲ 2.94%
- F500 in state
- 4
Industry mix (Fortune 500 HQ in AL)
| Industry | F500 HQs | Revenue |
|---|---|---|
| Financial Services | 1 | $8B |
|
||
| Healthcare | 1 | $5B |
|
||
Price history
1 event — show timeline
- 2026-06-16 Listed $49,900 VMLS
Cash-flow waterfall
monthlySold comps — $/sqft
last 12 mo · ≤1 miLoading sold comps…