 Multi-family
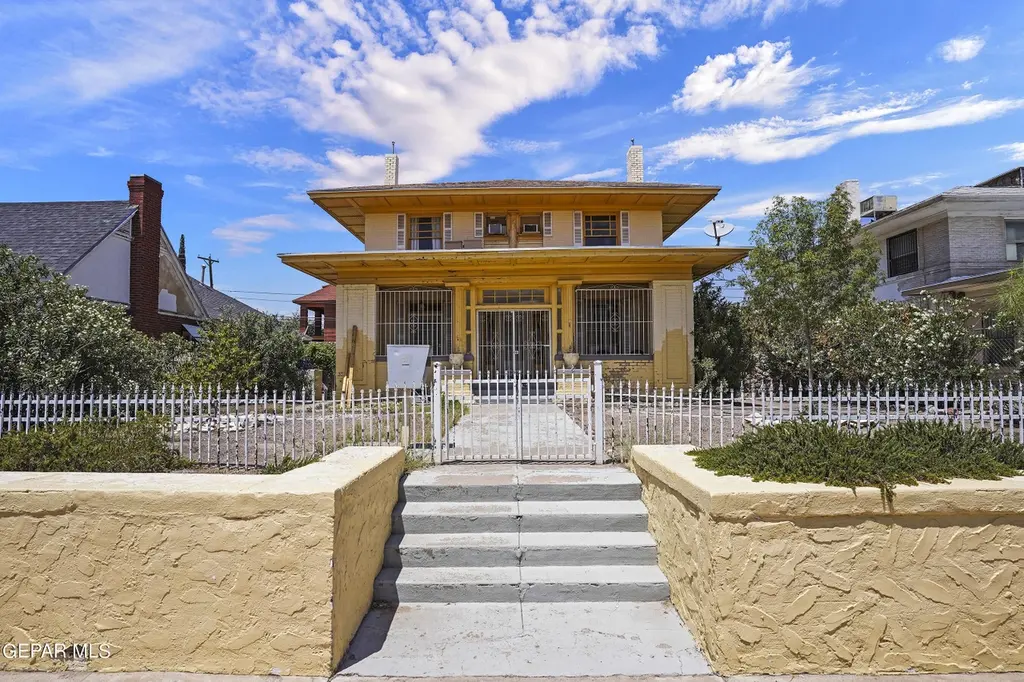
1207 E Rio Grande Ave · El Paso, TX
Flood risk No data
- FEMA flood zone
- —
- Chance of flooding over 30 yrs
- —
- Est. flood insurance / yr
- —
Fire risk No data
- Est. fire insurance / yr
- —
Heat risk No data
- Hot days now (above threshold)
- —
- Hot days in 30 yrs
- —
Wind risk No data
- Chance of severe wind over 30 yrs
- —
Air-quality risk No data
- Unhealthy air days now
- —
- Unhealthy air days in 30 yrs
- —
Risk factors via First Street. Map © Google.
Why this score? — see what drove the C grade
The composite is a weighted blend of 9 inputs, each scored 0–100. Each bar is that input's sub-score; the figure is the points it added to the 100-point composite (weight × sub-score).
- Cash flow +23.4/30.0
- DSCR +7.5/10.0
- ARV discount +7.5/15.0
- 1% rule +6.9/10.0
- Livability +4.0/5.0
- Rent growth +3.8/5.0
- Schools +2.7/10.0
- Condition / age +2.5/5.0
- Appreciation +0.0/10.0
$305,000
🖨 Deal sheet (PDF) 📄 Offer letter ✓ Due diligence
Multi-family units
County records classify this as Multi-Family (2-4 Unit). Listing-text estimate: 1 unit. estimate disagrees with records
Listing remarks MLS
DO NOT DISTURB TENANTS PLEASE. Charming 1900s home, converted into fully rented apartments prior to 1977, generating $3,100 a month in rental income. Convenient off-street parking is available through the back alley, providing easy access for tenants. A storage building and shed are included in the sale, adding additional value and convenience. This property is an excellent investment opportunity, blending historic charm with consistent rental income. There is some TLC needed. Don't miss out on this rare opportunity! Ask your agent for the 3D tours
Key facts
- Shed
- Storage building
- Rental income
Tags
Neighborhood map
What this means for you Summary
Snapshot
- This is a multifamily listed at $305k.
Deal economics
- At list price, monthly cash flow is $563 ($7k/yr) — positive.
- The deal already cash-flows at list — no discount required.
- Meets the 1% rule at list price ($4k rent vs $305k).
- Recommended offer: $278k (9.0% below list) — sets the bar for market timing.
Location & tenants
- Location reads 81/100 on livability (#23 in TX, #1,375 nationally) — a professional / high-income tenant draw. Strengths: commute A+, cost of living A+, housing A+; Watch: employment D+.
- El Paso ISD (urban): math 27% / reading 37% proficiency, ranked #591 of 826 in TX (top 72%) — families likely to look elsewhere, expect single-tenant / working-renter base with shorter leases; 65% free/reduced lunch — lower-income household profile, screen leases tightly.
- Zoned schools: Lamar El (math 24% / reading 34%, grade F, #2,525 of 4,322 statewide, top 62%, 271 students, 96% FRL); Wiggs Middle (math 47% / reading 46%, grade D+, #443 of 1,662 statewide, top 28%, 861 students, 72% FRL); El Paso H S (math 36% / reading 45%, grade F, #798 of 1,632 statewide, top 49%, 1,580 students, 68% FRL).
- Market conditions: Rents rising fast (+5.2%/yr); 117 active listings in the ZIP; 6 comparable units currently listed for rent nearby; rentals lingering (median 45d on market — plan ~5-8 weeks vacancy on turnover, expect pricing pressure); 67% of comp listings sitting > 30 days — soft ceiling on asking rent; 2,196 units permitted in El Paso County in 2024 (143 in 5+ unit buildings).
- At $3,626/mo this rent would consume 86% of the median local household income ($51k/yr) (locally 1380% of renters already pay >50% of income on rent) — very limited rent-growth headroom before tenants either downsize or default.
Forward outlook
- Local home prices are declining (-3.0%/yr); year-one equity from $2k of loan paydown is wiped out by about $9k of value loss. Plan a longer hold.
- El Paso County population projected at +10% by 2050 — modest demand growth; plan on rents tracking national, not racing it.
- At projected returns (-3.0% appreciation + 5.2% rent growth), your $85k cash investment doubles in ~10 years — after that, you're playing with house money.
Negotiation context
- It's been on market 108 days — a 9% lower offer ($278k) is reasonable based on typical stale-listing flexibility.
- 5 sale attempts since 2y ago with the ask held roughly flat each time — persistent listings suggest the price (not the market) is what's stuck; bring a comps-based counter.
Risks & watch-outs
- Watch-outs: built in 1901 — expect roof / HVAC / electrical / plumbing capex.
Questions for the listing agent
- It's been on market 108 days. Have you received any prior offers? Is the seller open to a 9% concession, seller financing, or rate buy-down credit?
- Built in 1901 — when were the roof, HVAC, electrical panel, plumbing, and water heater last replaced?
- Why hasn't it sold? Are there any deal-killer items the seller is aware of (foundation, flood, title, zoning, code violations)?
- Is there a deadline driving the sale (1031 exchange, divorce, estate, relocation)? That informs how much negotiation room exists.
- Schools are B-rated — typically a magnet for longer-tenancy family renters. What's the average tenant stay here, and is there a school-zone premium baked into asking?
- What's the average days-on-market for RENTAL listings here right now (not sales)? A rising rental-DOM trend means longer vacancies and softer asking-rent achievability than the comps imply.
- What's the recent tenant-quality profile in this submarket — average credit score on applications, eviction rate, late-payment / NSF rate, and stable-employment percentage? A property-management company in the area should have these aggregated.
- How much new apartment / multifamily construction is in the pipeline within 1–3 miles? Heavy new supply (>2% of stock underway) typically softens rents 12–24 months out; light construction supports rent growth.
Investment metrics
- 1% rule
- 1.19% ✓
- Cap rate
- 8.51%
- Cash-on-cash
- 7.91%
- DSCR
- 1.35
- GRM
- 7.0
CMA / ARV
No comps found within radius.
Projected returns pro-forma
-3.0% appreciation · 5.25% rent growth · sell at horizon
- IRR
- -1.5%
- Equity multiple
- 0.94×
- Total profit
- $-5,001
- Equity at exit
- $45,476
- IRR
- 10.6%
- Equity multiple
- 1.92×
- Total profit
- $78,586
- Equity at exit
- $26,371
Cash invested: $85,400 (down + closing). Projections, not guarantees.
Landlord ↔ Tenant lean methodology
- Overall (STATE)
- 87 Strongly Landlord-Friendly
- State Texas
- 87 Strongly Landlord-Friendly · R+5
- County
- — inherits STATE
- City
- — inherits STATE
ZIP-level market 79902
- Home prices YoY
- -23.1%
- Rents YoY
- 5.2%
- Active inventory
- 117
- Price-to-rent
- 35.0×
Monthly cashflow live
- Estimated rent
- $3,626 high interval (Pro) →
- Mortgage (P&I)
- −$1,599
- Tax from tax record
- −$575 /mo · $6,900/yr
- Insurance
- −$127
- HOA
- −$0
- Vacancy / Maint / Mgmt
- −$761
- Net cashflow
- $563
Break-even live
Sensitivity live
| Price | -10% $736 | -5% $649 | +0% $563 | +5% $477 | +10% $390 |
|---|---|---|---|---|---|
| Rent | -10% $277 | -5% $420 | +0% $563 | +5% $706 | +10% $849 |
| Rate | -1.0pp $717 | -0.5pp $641 | base $563 | +0.5pp $484 | +1.0pp $404 |
5-unit breakdown (identical units grouped — click to expand)
| Units | Beds | Baths | Est. rent |
|---|---|---|---|
| 5× units | 1 | 1 | $3,625 |
| #1 | 1 | 1 | $725 |
| #2 | 1 | 1 | $725 |
| #3 | 1 | 1 | $725 |
| #4 | 1 | 1 | $725 |
| #5 | 1 | 1 | $725 |
| Total (5 units) | $3,626 | ||
UW: 25.0% down · 7.5% · 30yr · 1.5% tax · 5.0% vac · 8.0% maint · 8.0% mgmt
Financing live
Cash to close
- Down payment
- $76,250
- Closing costs
- $9,150
- Reserves months
- —
- Total cash needed
- —
Loan-product check · same deal, 3 products live
Conventional
25% down · 7.5% · 30yr
- Down + closing
- —
- Monthly P&I
- —
- Monthly cashflow
- —
- DSCR
- —
- Eligible?
- —
Personal DTI + credit; lowest rate.
DSCR
20% down · 8.5% · 30yr
- Down + closing
- —
- Monthly P&I
- —
- Monthly cashflow
- —
- DSCR
- —
- Eligible?
- —
No personal income docs; deal must DSCR.
Hard money
10% down · 12.0% · 12mo
- Down + closing
- —
- Monthly P&I
- —
- Monthly cashflow
- —
- DSCR
- —
- Eligible?
- —
Short-term bridge; refi at stabilization.
Rent comps 6 comps
| Address | Beds | Baths | Sqft | Rent | $/sqft | DOM | Units | Dist |
|---|---|---|---|---|---|---|---|---|
| 1519 Golden Hill Ter El Paso, TX | 2.0 | 2.5 | 1600 | $2,750 | $1.72 | 45d | 6 | 0.23mi |
| 1519 Golden Hill Ter Unit 8 El Paso, TX | 2.0 | 2.5 | 1650 | $2,950 | $1.79 | 25d | 1 | 0.23mi |
| 1805 Gurss Pl El Paso, TX | 3.0 | 1.5 | 2198 | $2,400 | $1.09 | 4d | 1 | 0.68mi |
| 604 Upson Dr El Paso, TX | 3.0 | 3.0 | 1680 | $1,900 | $1.13 | 45d | 1 | 1.11mi |
| 1104 Madeline Dr El Paso, TX | 3.0 | 2.0 | 1584 | $2,500 | $1.58 | 45d | 1 | 1.11mi |
| 923 McKelligon Dr El Paso, TX | 3.0 | 2.0 | 2186 | $2,500 | $1.14 | 45d | 1 | 1.29mi |
Listing history 13 events
-
2026-06-21statusdays on market $305,000 Active 108 DOM
-
2026-05-16status Pending 559-char remark
Show marketing remark (559 chars)
DO NOT DISTURB TENANTS PLEASE. Charming 1900s home, converted into fully rented apartments prior to 1977, generating $3,100 a month in rental income. Convenient off-street parking is available through the back alley, providing easy access for tenants. A storage building and shed are included in the sale, adding additional value and convenience. This property is an excellent investment opportunity, blending historic charm with consistent rental income. There is some TLC needed. Don't miss out on this rare opportunity! Ask your agent for the 3D tours
-
2026-01-28$305,000 Active 559-char remark
Show marketing remark (559 chars)
DO NOT DISTURB TENANTS PLEASE. Charming 1900s home, converted into fully rented apartments prior to 1977, generating $3,100 a month in rental income. Convenient off-street parking is available through the back alley, providing easy access for tenants. A storage building and shed are included in the sale, adding additional value and convenience. This property is an excellent investment opportunity, blending historic charm with consistent rental income. There is some TLC needed. Don't miss out on this rare opportunity! Ask your agent for the 3D tours
-
2025-09-08price $305,000
-
2025-09-02status Active
-
2025-05-31status Active
-
2025-05-02status Pending
-
2025-05-02historical
-
2025-05-02historical
-
2025-01-23$315,000 Active
-
2024-08-22historical
-
2024-08-14$305,000 Active
-
1977-06-01soldstatus
ⓘ Source: listings_history table (triggers on properties + properties_extension) + one-shot
backfill from property_details.listing_events for pre-trigger history.
Tax reassessment forecast TX · Resets to sale price
- Current annual tax
- $6,900 · $575/mo
- Projected year-2 tax
- $6,900 · $575/mo
- Expected delta
- $0/yr ($0/mo · 0.0%)
ⓘ Screening estimate from a state-policy table — verify with the county assessor before closing.
Nearby sold comps map
Loading sold comps map…
Walkable amenities ~0.75 mi
Loading nearby amenities…
Taxation est. · year 1
- Rental income
- $43,512
- − Mortgage interest
- −$17,085
- − Property taxes
- −$6,900
- − Insurance
- −$1,525
- − Repairs & maintenance
- −$3,481
- − Management
- −$3,481
- − Depreciation
- −$8,873
- Taxable income
- $2,167
- Est. tax owed @ 24.0%
- −$520
- After-tax cash flow
- $6,236/yr
For passive investors: Depreciation is non-cash, so a rental often shows a tax loss while cash-flowing — sheltering income. Rental losses are passive: they offset passive income freely, and up to $25,000/yr can offset ordinary (W-2) income if you actively participate and your MAGI is under $100k (phasing out to $0 by $150k); unused losses carry forward. On sale, claimed depreciation is recaptured at up to 25%, and gains may owe capital-gains tax (a 1031 exchange can defer both). Figures are a year-1 estimate at your 24.0% rate — not tax advice; consult a CPA.
Schools (NCES district)
- District
- El Paso ISD
- NCES district ID
- 4818300
- Math proficiency
- 27% ▼ -24.00%
- Reading proficiency
- 37% ▼ -7.00%
- Median HH income
- $38,704
- Composite
- 26.75/100
- National rank
- #7138
- State rank
- #591 of 826 in TX
Livability — El Paso
- Score
- 81/100
- State rank
- #23
- US rank
- #1375
Category grades
Schools grade is shown separately in the Schools card above.
Census & demographics
- Census place
- El Paso, TX
- County
- El Paso County · 761,266 people
- City population
- 630,223
- Metro
- El Paso, TX
- Population (ZIP)
- 19,031
- Household income
- $50,873
- Rent vs Own
- Severe rent burden
- 1380.0
Population outlook (El Paso County) Hauer SSP2
- Today (2025)
- 897,899 people
- By 2030
- 922,694 · +2.8%
- By 2040
- 960,492 · +7.0%
- By 2050
- 982,919 · +9.5%
- By 2075
- 997,266 · +11.1%
- By 2100
- 900,630 · +0.3%
Race, ethnicity, and origin ACS 2023
- Neighborhood character
- Predominantly Hispanic (75%)
- Race & ethnicity
- Hispanic / Latino 75% Two or more races 40% White 19% Black 2% Asian 1% Native American 1%
- Hispanic origin (detail)
- Mexican 71%
- Common ancestry
- Slovak 1% American 1% Lithuanian 1%
- Foreign-born
- 24% · Canada, India, China
- Languages at home
- 33% English-only · Spanish 65% Other Asian/Pacific 1% Other Indo-European 1%
Political lean MEDSL · El Paso
- 2024 margin
- D (+15.1) · D 57.0% · R 41.8% · Other 1.2%
- 2008→2024 swing
- -17.4pp toward R · 2008: 32.5pp · 2024: 15.1pp
- All cycles
- 2024: D+15.1 2020: D+35.1 2016: D+43.2 2012: D+32.6 2008: D+32.5
Not yet ingested
- Civics
- —
Market trends
- HPI YoY
- ▼ -74.95%
- Current HPI
- 249.5804
- Rent YoY
- ▲ 5.25%
- Metro
- El Paso, TX
- State GDP YoY
- ▲ 3.95%
- F500 in state
- 110
Industry mix (Fortune 500 HQ in TX)
| Industry | F500 HQs | Revenue |
|---|---|---|
| Energy | 16 | $1,198B |
|
||
| Technology | 5 | $198B |
|
||
| Engineering / Construction | 4 | $72B |
|
||
| Energy Services | 3 | $60B |
|
||
| Utilities | 3 | $41B |
|
||
| Healthcare | 2 | $330B |
|
||
Price history
+0.0% since first listed12 events — show timeline
- 2026-05-16 Pending — GEPARMLS
- 2026-01-28 Listed $305,000 GEPARMLS
- 2025-09-08 Price Changed $305,000 GEPARMLS
- 2025-09-02 Relisted — GEPARMLS
- 2025-05-31 Relisted — GEPARMLS
- 2025-05-02 Pending — GEPARMLS
- 2025-05-02 Listing Removed — GEPARMLS
- 2025-05-02 Listing Removed — GEPARMLS
- 2025-01-23 Listed $315,000 GEPARMLS
- 2024-08-22 Listing Removed — GEPARMLS
- 2024-08-14 Listed $305,000 GEPARMLS
- 1977-06-01 Sold (Public Records) — Public Records
Property tax history
+3.6%/yrLatest (2025): $6,900 · +22.2% YoY. Source: county tax records.
Cash-flow waterfall
monthlySold comps — $/sqft
last 12 mo · ≤1 miLoading sold comps…