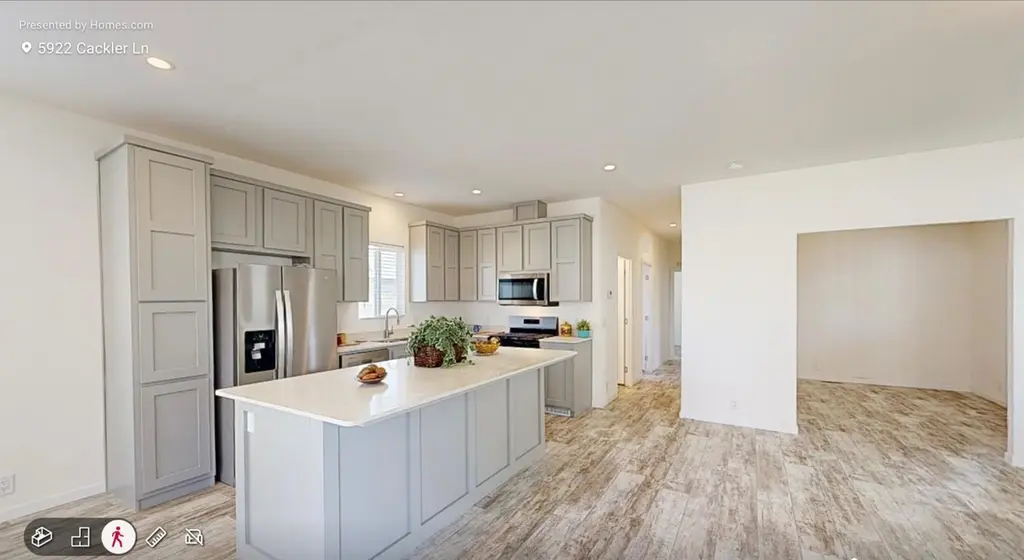
5922 Cackler Ln #83 · Citrus Heights, CA
Flood risk 1/10 · Minimal
- FEMA flood zone
- X (unshaded)
- Chance of flooding over 30 yrs
- 0.0%
- Est. flood insurance / yr
- $507 – $1,088
Fire risk 2/10 · Minimal
- Est. fire insurance / yr
- $659 – $1,223
Heat risk 7/10 · Major
- Hot days now (above 103°F)
- 7 days/yr
- Hot days in 30 yrs
- 15 days/yr
Wind risk 1/10 · Minimal
- Chance of severe wind over 30 yrs
- —
Air-quality risk 10/10 · Severe
- Unhealthy air days now
- 34 days/yr
- Unhealthy air days in 30 yrs
- 36 days/yr
Risk factors via First Street. Map © Google.
Why this score? — see what drove the C grade
The composite is a weighted blend of 9 inputs, each scored 0–100. Each bar is that input's sub-score; the figure is the points it added to the 100-point composite (weight × sub-score).
- Cash flow +25.6/30.0
- DSCR +8.5/10.0
- 1% rule +6.7/10.0
- Schools +4.4/10.0
- Condition / age +4.0/5.0
- Rent growth +3.0/5.0
- Livability +3.0/5.0
- ARV discount +0.0/15.0
- Appreciation +0.0/10.0
$199,995
🖨 Deal sheet (PDF) 📄 Offer letter ✓ Due diligence
Listing remarks
Rare FInd. NEW HOME. !! Factory Built in 2025. '7 Year' Limited Factory Warranty. Active 55 Plus Community. Features: 1,344 sq ft 2/3 bedrooms / 2 Full bathrooms + office (den). Kitchen island, Energy efficientStainless steel appliance package Luxury, Solid Stone countertops in kitchen & Both Bathrooms. Separate laundry room, to accommodate Side by Side Washer and Dryer. Large backyard. 9 foot ceilings. Central H/A. Covered Front Porch. Luxury comfort, Modern layout Parking: Brand-new Spacious carport, extends a full 40 ft. Spacious parking for 2 plus vehicles. Park offers Active Clubhouse. Relaxing pool, Quiet time relaxing in the Clubhouse library. Or you may enjoy socializing a
Key facts
- 2 parking spots
- Built 2025
- Listed 189 days
Neighborhood map
What this means for you Summary
Snapshot
- This is a 3-bed/2.0-bath manufactured listed at $200k. Condition is rated good.
Deal economics
- At list price, monthly cash flow is $472 ($6k/yr) — positive.
- The deal already cash-flows at list — no discount required.
- Meets the 1% rule at list price ($2k rent vs $200k).
- Recommended offer: $176k (12.0% below list) — sets the bar for market timing.
- Cap rate 9.1% vs local median 3.4% in Citrus Heights — top-decile yield for the area; either an underpriced asset or a hidden risk that comps aren't pricing in. Stress-test before assuming the spread holds.
Location & tenants
- Location reads 60/100 on livability (#614 in CA) — a middle-class / working-renter tenant base. Strengths: housing A+; Watch: schools D, crime D-, amenities F.
- San Juan Unified (suburban): math 40% / reading 62% proficiency, ranked #138 of 517 in CA (top 27%) — acceptable for families but not a draw, mixed tenant base, ~2y average lease.
- Market conditions: Rents rising (+1.9%/yr); 219 active listings in the ZIP; 21 comparable units currently listed for rent nearby; rentals leasing fast (median 13d on market — plan ~1-2 weeks tenant-placement turnaround); solid renter incomes; 6,825 units permitted in Sacramento County in 2024 (1,752 in 5+ unit buildings).
- This rent runs 35% of the median local income ($81k/yr) — at the standard rent-burdened threshold; future hikes will face affordability resistance.
Forward outlook
- Local home prices are declining (-3.0%/yr); year-one equity from $1k of loan paydown is wiped out by about $6k of value loss. Plan a longer hold.
- Sacramento County population projected at +17% by 2050 — long-run rental-demand tailwind backs the buy-and-hold thesis.
Negotiation context
- It's been on market 189 days — a 12% lower offer ($176k) is reasonable based on typical stale-listing flexibility.
Risks & watch-outs
- Climate carrying-cost: extreme-heat days projected 7→15/yr by 2055 (HVAC capex compounding) — expect insurance premiums to compound above CPI over the hold.
Questions for the listing agent
- It's been on market 189 days. Have you received any prior offers? Is the seller open to a 12% concession, seller financing, or rate buy-down credit?
- Why hasn't it sold? Are there any deal-killer items the seller is aware of (foundation, flood, title, zoning, code violations)?
- Is there a deadline driving the sale (1031 exchange, divorce, estate, relocation)? That informs how much negotiation room exists.
- Schools are D-rated, which usually means shorter tenancies and higher turnover. Who's the typical renter profile here, and what's been the actual vacancy rate?
- Crime grade is D in this area — have there been break-ins, vandalism, or insurance claims at this property in the last 3 years? What carrier currently insures it and at what premium?
- What's the average days-on-market for RENTAL listings here right now (not sales)? A rising rental-DOM trend means longer vacancies and softer asking-rent achievability than the comps imply.
- What's the recent tenant-quality profile in this submarket — average credit score on applications, eviction rate, late-payment / NSF rate, and stable-employment percentage? A property-management company in the area should have these aggregated.
- How much new for-sale + rental construction is in the pipeline within 1–3 miles? Heavy new supply typically softens prices + rents 12–24 months out; constrained supply supports both.
Investment metrics
- 1% rule
- 1.17% ✓
- Cap rate
- 9.13%
- Cash-on-cash
- 10.12%
- DSCR
- 1.45
- GRM
- 7.1
CMA / ARV
- ARV (median comp)
- $142,556
- List price
- $199,995
- Delta
- 40.29%
- Verdict
- OVERPRICED
- Comps
- 20 within 1.0 mi
Show comp detail 12 sales within ~0.75 mi
| Address | Dist | Beds/Ba | Sqft | Sold | Price | $/sf | Match |
|---|---|---|---|---|---|---|---|
| 6008 Cackler Ln #88 | 0.07mi | 2/2.0 (-1) | 1,344 (0%) | 3mo | $94,500 | $70 | 89 |
| 5913 Cackler Ln #62 | 0.03mi | 2/2.0 (-1) | 1,244 (-7%) | 1mo | $126,000 | $101 | 81 |
| 7633 Woodduck Ln #67 | 0.06mi | 3/2.0 | 1,440 (+7%) | 7mo | $89,450 | $62 | 79 |
| 7547 Golden Eye Ln #123 | 0.13mi | 3/2.0 | 1,480 (+10%) | 2mo | $147,182 | $99 | 75 |
| 7516 Scaup Ln | 0.17mi | 2/2.0 (-1) | 1,248 (-7%) | 7mo | $123,000 | $99 | 69 |
| 7437 Sylmar Ln #178 | 0.22mi | 4/2.0 (+1) | 1,440 (+7%) | 5mo | $160,000 | $111 | 69 |
| 7412 Newport Ln #144 | 0.29mi | 3/2.0 | 1,440 (+7%) | 9mo | $117,000 | $81 | 67 |
| 7348 Azimuth Ln #25 | 0.32mi | 4/2.0 (+1) | 1,440 (+7%) | 4mo | $160,000 | $111 | 65 |
| 7416 White River Ln #172 | 0.27mi | 4/2.0 (+1) | 1,440 (+7%) | 9mo | $160,000 | $111 | 63 |
| 5836 Stonyford | 0.36mi | 3/2.0 | 1,440 (+7%) | 10mo | $155,900 | $108 | 63 |
| 5873 Hobbs Ln #57 | 0.40mi | 4/2.0 (+1) | 1,440 (+7%) | 7mo | $165,000 | $115 | 59 |
| 7428 White River Ln #175 | 0.24mi | 4/2.0 (+1) | 1,536 (+14%) | 6mo | $161,000 | $105 | 55 |
Match score weights: distance 35% · size 25% · config 20% · recency 20%. Top-matched comps best support the ARV.
Projected returns pro-forma
-3.0% appreciation · 1.9% rent growth · sell at horizon
- IRR
- -2.3%
- Equity multiple
- 0.91×
- Total profit
- $-4,877
- Equity at exit
- $29,820
- IRR
- 6.1%
- Equity multiple
- 1.43×
- Total profit
- $24,298
- Equity at exit
- $17,292
Cash invested: $55,999 (down + closing). Projections, not guarantees.
Landlord ↔ Tenant lean methodology
- Overall (STATE)
- 18 Strongly Tenant-Friendly
- State California
- 18 Strongly Tenant-Friendly · D+13
- County
- — inherits STATE
- City
- — inherits STATE
ZIP-level market 95621
- Rents YoY
- 1.9%
- Active inventory
- 219
- Price-to-rent
- 7.1×
Monthly cashflow live
- Estimated rent
- $2,347 high interval (Pro) →
- Mortgage (P&I)
- −$1,049
- Tax est. 1.5%
- −$250 /mo · $3,000/yr
- Insurance
- −$83
- HOA
- −$0
- Vacancy / Maint / Mgmt
- −$493
- Net cashflow
- $472
Break-even live
Sensitivity live
| Price | -10% $610 | -5% $541 | +0% $472 | +5% $403 | +10% $334 |
|---|---|---|---|---|---|
| Rent | -10% $287 | -5% $379 | +0% $472 | +5% $565 | +10% $657 |
| Rate | -1.0pp $573 | -0.5pp $523 | base $472 | +0.5pp $420 | +1.0pp $368 |
UW: 25.0% down · 7.5% · 30yr · 1.5% tax · 5.0% vac · 8.0% maint · 8.0% mgmt
Financing live
Cash to close
- Down payment
- $49,999
- Closing costs
- $6,000
- Reserves months
- —
- Total cash needed
- —
Loan-product check · same deal, 3 products live
Conventional
25% down · 7.5% · 30yr
- Down + closing
- —
- Monthly P&I
- —
- Monthly cashflow
- —
- DSCR
- —
- Eligible?
- —
Personal DTI + credit; lowest rate.
DSCR
20% down · 8.5% · 30yr
- Down + closing
- —
- Monthly P&I
- —
- Monthly cashflow
- —
- DSCR
- —
- Eligible?
- —
No personal income docs; deal must DSCR.
Hard money
10% down · 12.0% · 12mo
- Down + closing
- —
- Monthly P&I
- —
- Monthly cashflow
- —
- DSCR
- —
- Eligible?
- —
Short-term bridge; refi at stabilization.
Rent comps 21 comps
| Address | Beds | Baths | Sqft | Rent | $/sqft | DOM | Units | Dist |
|---|---|---|---|---|---|---|---|---|
| 7761 Pompei Ct Unit 7763 Citrus Heights, CA | 2.0 | 1.0 | 900 | $1,705 | $1.89 | 24d | 1 | 0.41mi |
| 6413 Tupelo Dr Citrus Heights, CA | 1.0–2.0 | 1.0–2.0 | 775 | $2,000 | $2.58 | 3d | 10 | 0.48mi |
| 7827 Zenith Dr Citrus Heights, CA | 2.0 | 2.0 | 1031 | $1,995 | $1.94 | 15d | 1 | 0.57mi |
| 7915 Zenith Dr Citrus Heights, CA | 2.0 | 1.0 | 1015 | $1,895 | $1.87 | 23d | 1 | 0.67mi |
| 5411 Vichy Cir Antelope, CA | 2.0 | 2.0 | 886 | $2,375 | $2.68 | 2d | 1 | 0.84mi |
| 8077 Cornerstone Way Citrus Heights, CA | 4.0 | 2.0 | 1380 | $2,795 | $2.03 | 44d | 1 | 0.89mi |
| 7632 Van Maren Ln Unit 1 Citrus Heights, CA | 4.0 | 2.0 | 1300 | $2,495 | $1.92 | 15d | 1 | 0.89mi |
| 6948 Sunburst Way Citrus Heights, CA | 4.0 | 2.5 | 1673 | $3,000 | $1.79 | 44d | 1 | 0.91mi |
| 6319 Misty Wood Way Citrus Heights, CA | 3.0 | 2.0 | 1454 | $2,500 | $1.72 | 44d | 1 | 0.93mi |
| 7613 Luzern Way Antelope, CA | 3.0 | 2.0 | 1401 | $2,500 | $1.78 | 12d | 1 | 0.97mi |
| 7629 Downing Place Way Antelope, CA | 3.0 | 2.0 | 1200 | $2,600 | $2.17 | 2d | 1 | 1.03mi |
| 7120 Van Maren Ln Citrus Heights, CA | 3.0 | 2.0 | 1292 | $2,495 | $1.93 | 18d | 1 | 1.11mi |
| 7135 Cobalt Way Citrus Heights, CA | 3.0 | 1.0 | 1200 | $1,995 | $1.66 | 5d | 1 | 1.19mi |
| 6913 Gold Run Ave Sacramento, CA | 4.0 | 2.0 | 1474 | $2,800 | $1.90 | 21d | 1 | 1.24mi |
| 6940 Trailride Way Citrus Heights, CA | 3.0 | 2.0 | 1527 | $2,695 | $1.76 | 44d | 1 | 1.25mi |
| 7137 Reyn Oaks Way Sacramento, CA | 3.0 | 2.0 | 1279 | $2,455 | $1.92 | 13d | 1 | 1.31mi |
| 7137 Reyn Oaks Way Sacramento, CA | 3.0 | 2.0 | 1279 | $2,450 | $1.92 | 2d | 1 | 1.31mi |
| 7139 Baranga Dr Citrus Heights, CA | 3.0 | 1.5 | 1162 | $2,500 | $2.15 | 3d | 1 | 1.34mi |
| 6841 Concert Way Sacramento, CA | 2.0 | 2.0 | 1000 | $1,995 | $2.00 | 2d | 1 | 1.40mi |
| 6841 Castleberry Cir Citrus Heights, CA | 3.0 | 2.0 | 1162 | $2,300 | $1.98 | 5d | 1 | 1.46mi |
| 4901 Adorn Ct Sacramento, CA | 3.0 | 2.0 | 1361 | $2,450 | $1.80 | 2d | 1 | 1.50mi |
Listing history 21 events
-
2026-06-16status $199,995 Pending 189 DOM
-
2026-06-15days on market $199,995 Active 189 DOM
-
2026-06-13days on market $199,995 Active 187 DOM
-
2026-06-13days on market $199,995 Active 186 DOM
-
2026-06-09days on market $199,995 Active 183 DOM
-
2026-06-08days on market $199,995 Active 182 DOM
-
2026-06-07days on market $199,995 Active 181 DOM
-
2026-06-05days on market $199,995 Active 178 DOM
-
2026-06-03days on market $199,995 Active 177 DOM
-
2026-06-02days on market $199,995 Active 176 DOM
-
2026-06-01days on market $199,995 Active 175 DOM
-
2026-05-31days on market $199,995 Active 174 DOM
-
2025-10-17historical
-
2025-10-14price
-
2025-08-19price
-
2025-07-05price
-
2025-06-26price
-
2025-06-03price
-
2025-05-20price
-
2025-04-25price
-
2025-04-04Active
ⓘ Source: listings_history table (triggers on properties + properties_extension) + one-shot
backfill from property_details.listing_events for pre-trigger history.
Climate risk First Street
- Flood 1/10 Low FEMA zone X (unshaded) · 0% chance over 30 yrs
- Wildfire 2/10 Low
- Heat 7/10 Severe 7 d/yr ≥103°F today · 15 d/yr by 30 yrs out
- Wind 1/10 Low
- Air quality 10/10 Extreme 34 unhealthy d/yr today · 36 by 30 yrs out
Nearby sold comps map
Loading sold comps map…
Walkable amenities ~0.75 mi
Loading nearby amenities…
Taxation est. · year 1
- Rental income
- $28,165
- − Mortgage interest
- −$11,203
- − Property taxes
- −$3,000
- − Insurance
- −$1,000
- − Repairs & maintenance
- −$2,253
- − Management
- −$2,253
- − Depreciation
- −$5,818
- Taxable income
- $2,638
- Est. tax owed @ 24.0%
- −$633
- After-tax cash flow
- $5,032/yr
For passive investors: Depreciation is non-cash, so a rental often shows a tax loss while cash-flowing — sheltering income. Rental losses are passive: they offset passive income freely, and up to $25,000/yr can offset ordinary (W-2) income if you actively participate and your MAGI is under $100k (phasing out to $0 by $150k); unused losses carry forward. On sale, claimed depreciation is recaptured at up to 25%, and gains may owe capital-gains tax (a 1031 exchange can defer both). Figures are a year-1 estimate at your 24.0% rate — not tax advice; consult a CPA.
Condition & rehab AI · 11 photos
This home is in good condition with a fresh paint job and modern features. It has a good foundation and structure, and the kitchen and bathrooms are well-maintained. The home is move-in ready with a few minor updates that can significantly increase its value.
Value-add opportunities
- Resale Paint exterior siding — Fresh paint can enhance curb appeal and home value.
- Both Install new flooring in bathrooms — New flooring can improve both resale and rental value.
- Both Add landscaping features — Landscaping can enhance curb appeal and attract potential buyers/renters.
- Both Upgrade kitchen appliances — Upgrading appliances can increase both resale and rental value.
- Both Install smart home features — Smart home features can increase both resale and rental value by making the home more modern and energy-efficient.
Renovation cost estimate screening
Value-add ROI direction
- Resale Paint exterior siding — Fresh paint can enhance curb appeal and home value. ↑
- Both Install new flooring in bathrooms — New flooring can improve both resale and rental value. ↑
- Both Add landscaping features — Landscaping can enhance curb appeal and attract potential buyers/renters. ↑
- Both Upgrade kitchen appliances — Upgrading appliances can increase both resale and rental value. ↑
- Both Install smart home features — Smart home features can increase both resale and rental value by making the home more modern and energy-efficient. ↑
ⓘ Cost ranges are severity-bucket heuristics (US national rule-of-thumb). Get contractor quotes + a written scope before underwriting a rehab budget.
Schools (NCES district)
- District
- San Juan Unified
- NCES district ID
- 0634620
- Math proficiency
- 40% ▲ 3.00%
- Reading proficiency
- 62% ▲ 16.00%
- Median HH income
- $55,655
- Composite
- 44.07/100
- National rank
- #2878
- State rank
- #138 of 517 in CA
Livability — Citrus Heights
- Score
- 60/100
- State rank
- #614
- US rank
- #19580
Category grades
Schools grade is shown separately in the Schools card above.
Census & demographics
- Census place
- Citrus Heights, CA
- County
- Sacramento County · 1,539,646 people
- City population
- 89,370
- Metro
- Sacramento-Roseville-Folsom, CA
- Population (ZIP)
- 42,442
- Household income
- $80,901
- Rent vs Own
- Severe rent burden
- 1854.0
Population outlook (Sacramento County) Hauer SSP2
- Today (2025)
- 1,660,763 people
- By 2030
- 1,732,990 · +4.3%
- By 2040
- 1,855,755 · +11.7%
- By 2050
- 1,941,335 · +16.9%
- By 2075
- 2,046,162 · +23.2%
- By 2100
- 1,961,444 · +18.1%
Race, ethnicity, and origin ACS 2023
- Neighborhood character
- Predominantly White (66%)
- Race & ethnicity
- White 66% Hispanic / Latino 19% Two or more races 11% Asian 6% Black 2%
- Hispanic origin (detail)
- Mexican 16%
- Common ancestry
- Subsaharan African 3% Lithuanian 3% Scotch-Irish 2%
- Foreign-born
- 15% · Canada, Vietnam
- Languages at home
- 78% English-only · Spanish 10% Russian/Polish/Slavic 6% Other Indo-European 3%
Political lean MEDSL · Sacramento
- 2024 margin
- D (+19.7) · D 58.1% · R 38.4% · Other 3.5%
- 2008→2024 swing
- +0.7pp no change · 2008: 19.0pp · 2024: 19.7pp
- All cycles
- 2024: D+19.7 2020: D+25.3 2016: D+23.7 2012: D+16.3 2008: D+19.0
Not yet ingested
- Civics
- —
Market trends
- HPI YoY
- ▼ -408.14%
- Current HPI
- 351.9333
- Rent YoY
- ▲ 1.90%
- Metro
- Sacramento-Roseville-Folsom, CA
- State GDP YoY
- ▲ 3.21%
- F500 in state
- 116
Industry mix (Fortune 500 HQ in CA)
| Industry | F500 HQs | Revenue |
|---|---|---|
| Technology | 27 | $1,492B |
|
||
| Financial Services | 3 | $174B |
|
||
| Retail | 3 | $44B |
|
||
| Insurance | 3 | $26B |
|
||
| Media / Entertainment | 2 | $115B |
|
||
| Pharmaceuticals / Biotech | 2 | $62B |
|
||
Cash-flow waterfall
monthlySold comps — $/sqft
last 12 mo · ≤1 miLoading sold comps…