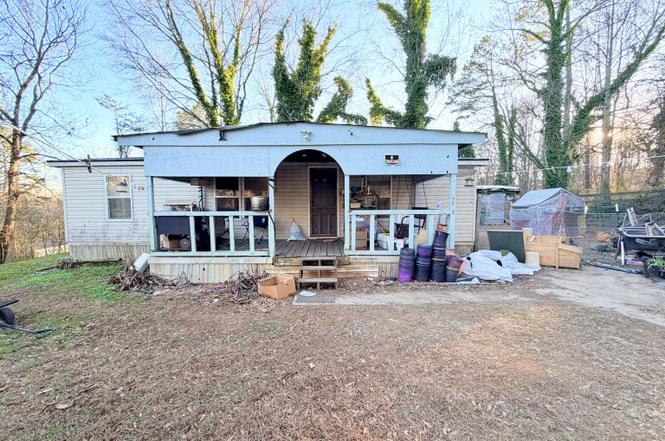
6120 River Run Cir · Clermont, GA
Flood risk 1/10 · Minimal
- FEMA flood zone
- X (unshaded)
- Chance of flooding over 30 yrs
- 0.0%
- Est. flood insurance / yr
- $507 – $1,088
Fire risk 4/10 · Minor
- Est. fire insurance / yr
- $963 – $1,789
Heat risk 4/10 · Minor
- Hot days now (above 101°F)
- 7 days/yr
- Hot days in 30 yrs
- 18 days/yr
Wind risk 3/10 · Minor
- Chance of severe wind over 30 yrs
- 5.0%
Air-quality risk 4/10 · Minor
- Unhealthy air days now
- 4 days/yr
- Unhealthy air days in 30 yrs
- 6 days/yr
Risk factors via First Street. Map © Google.
Why this score? — see what drove the B- grade
The composite is a weighted blend of 9 inputs, each scored 0–100. Each bar is that input's sub-score; the figure is the points it added to the 100-point composite (weight × sub-score).
- Cash flow +30.0/30.0
- 1% rule +10.0/10.0
- DSCR +10.0/10.0
- ARV discount +7.5/15.0
- Rent growth +3.5/5.0
- Livability +3.3/5.0
- Schools +2.7/10.0
- Condition / age +2.5/5.0
- Appreciation +0.0/10.0
$109,950
🖨 Deal sheet 📄 Offer letter ✓ Due diligence
Listing remarks
Solid Gainesville property featuring 3 bedrooms, 2 baths, and a versatile bonus room. Conveniently located near Lake Lanier and local shopping. Find a video tour on YouTube by typing in the address.
Key facts
- Near lake lanier
- Versatile bonus room
- Local shopping
Tags
Property features AI
Finance
- HOA & community: No homeowners association
Exterior
- Parking: Attached garage; Attached parking
- Utilities: Public water; Public sewer; Electricity available; Water available
- Home design: Single family residence (house); Residential property; Fixer condition; Built in 1989
- Construction: Vinyl siding; Composition roof; House structure
- Exterior features: Corner lot
Interior
- Kitchen: No appliances reported
- Bedrooms: 3 bedrooms on the main level
- Flooring: Other flooring
- Bathrooms: 2 full bathrooms, both on the main level
- Heating & cooling: Central heating; Central air conditioning
- Interior features: One-level layout; No basement; Living area reported as 960 (public records); Other interior features
- Laundry & utility: Laundry in hall
Neighborhood map
What this means for you Summary
Snapshot
- This is a 3-bed/2.0-bath manufactured listed at $110k.
Deal economics
- At list price, monthly cash flow is $790 ($9k/yr) — positive.
- The deal already cash-flows at list — no discount required.
- Meets the 1% rule at list price ($2k rent vs $110k).
- Recommended offer: $100k (9.0% below list) — sets the bar for market timing.
- Cap rate 14.9% vs local median 1.2% in Clermont — top-decile yield for the area; either an underpriced asset or a hidden risk that comps aren't pricing in. Stress-test before assuming the spread holds.
Location & tenants
- Location reads 66/100 on livability (#194 in GA) — a middle-class / working-renter tenant base. Strengths: employment A+, housing A+, crime A; Watch: schools F, amenities F, commute F.
- Hall County (rural): math 28% / reading 33% proficiency, ranked #81 of 174 in GA (top 47%) — families likely to look elsewhere, expect single-tenant / working-renter base with shorter leases.
- Market conditions: Rents rising (+3.8%/yr); 688 active listings in the ZIP; solid renter incomes; 2,274 units permitted in Hall County in 2024 (620 in 5+ unit buildings).
Forward outlook
- Local home prices are declining (-3.0%/yr); year-one equity from $760 of loan paydown is wiped out by about $3k of value loss. Plan a longer hold.
- Hall County population projected at +30% by 2050 — long-run rental-demand tailwind backs the buy-and-hold thesis.
- At projected returns (-3.0% appreciation + 3.8% rent growth), your $31k cash investment doubles in ~4 years — after that, you're playing with house money.
Negotiation context
- It's been on market 101 days — a 9% lower offer ($100k) is reasonable based on typical stale-listing flexibility.
- 6 sale attempts; this cycle's ask has dropped $19k (15%) from the opening price — seller is motivated, your offer sets the floor, not the list.
- Current owner paid $72k; list at $110k implies a 52% gain — meaningful room to come down on a strong offer.
Questions for the listing agent
- It's been on market 101 days. Have you received any prior offers? Is the seller open to a 9% concession, seller financing, or rate buy-down credit?
- Why hasn't it sold? Are there any deal-killer items the seller is aware of (foundation, flood, title, zoning, code violations)?
- Is there a deadline driving the sale (1031 exchange, divorce, estate, relocation)? That informs how much negotiation room exists.
- Schools are F-rated, which usually means shorter tenancies and higher turnover. Who's the typical renter profile here, and what's been the actual vacancy rate?
- What's the average days-on-market for RENTAL listings here right now (not sales)? A rising rental-DOM trend means longer vacancies and softer asking-rent achievability than the comps imply.
- What's the recent tenant-quality profile in this submarket — average credit score on applications, eviction rate, late-payment / NSF rate, and stable-employment percentage? A property-management company in the area should have these aggregated.
- How much new for-sale + rental construction is in the pipeline within 1–3 miles? Heavy new supply typically softens prices + rents 12–24 months out; constrained supply supports both.
Investment metrics
- 1% rule
- 1.65% ✓
- Cap rate
- 14.91%
- Cash-on-cash
- 30.78%
- DSCR
- 2.37
- GRM
- 5.1
CMA / ARV
No comps found within radius.
Projected returns pro-forma
-3.0% appreciation · 3.84% rent growth · sell at horizon
- IRR
- 26.4%
- Equity multiple
- 2.10×
- Total profit
- $33,976
- Equity at exit
- $16,394
- IRR
- 34.5%
- Equity multiple
- 4.27×
- Total profit
- $100,612
- Equity at exit
- $9,506
Cash invested: $30,786 (down + closing). Projections, not guarantees.
Landlord ↔ Tenant lean methodology
- Overall (STATE)
- 90 Strongly Landlord-Friendly
- State Georgia
- 90 Strongly Landlord-Friendly · R+3
- County
- — inherits STATE
- City
- — inherits STATE
ZIP-level market 30506
- Home prices YoY
- -32.1%
- Rents YoY
- 3.8%
- Active inventory
- 688
- Price-to-rent
- 5.1×
Monthly cashflow live
- Estimated rent
- $1,812 medium interval (Pro) →
- Mortgage (P&I)
- −$577
- Tax from tax record
- −$20 /mo · $238/yr
- Insurance
- −$46
- HOA
- −$0
- Vacancy / Maint / Mgmt
- −$381
- Net cashflow
- $790
Break-even live
UW: 25.0% down · 7.5% · 30yr · 1.5% tax · 5.0% vac · 8.0% maint · 8.0% mgmt
Financing live
Cash to close
- Down payment
- $27,488
- Closing costs
- $3,298
- Reserves months
- —
- Total cash needed
- —
Loan-product check · same deal, 3 products live
Conventional
25% down · 7.5% · 30yr
- Down + closing
- —
- Monthly P&I
- —
- Monthly cashflow
- —
- DSCR
- —
- Eligible?
- —
Personal DTI + credit; lowest rate.
DSCR
20% down · 8.5% · 30yr
- Down + closing
- —
- Monthly P&I
- —
- Monthly cashflow
- —
- DSCR
- —
- Eligible?
- —
No personal income docs; deal must DSCR.
Hard money
10% down · 12.0% · 12mo
- Down + closing
- —
- Monthly P&I
- —
- Monthly cashflow
- —
- DSCR
- —
- Eligible?
- —
Short-term bridge; refi at stabilization.
Listing history 21 events
-
2026-05-11status Under Contract
-
2026-04-28historical Active Under Contract
-
2026-03-18status Back On Market
-
2026-03-16historical
-
2026-02-27price $109,950
-
2026-02-17price $115,000
-
2026-01-21historical
-
2026-01-16$129,000 New
-
2026-01-16$129,000 New
-
2025-06-18status Under Contract
-
2025-06-13historical
-
2025-06-06status Back On Market
-
2025-04-22status Under Contract
-
2025-04-14status Back On Market
-
2025-04-14price $115,000
-
2025-04-07status Under Contract
-
2025-03-05price $179,900
-
2025-03-04price $179,000
-
2025-01-17$189,000 New
-
2001-12-27soldstatus $72,500
-
2001-11-20soldstatus $38,500
ⓘ Source: listings_history table (triggers on properties + properties_extension) + one-shot
backfill from property_details.listing_events for pre-trigger history.
Tax reassessment forecast GA · Resets to sale price
- Current annual tax
- $238 · $20/mo
- Projected year-2 tax
- $1,012 · $84/mo
- Expected delta
- +$774/yr (+$64/mo · 325.5%)
ⓘ Screening estimate from a state-policy table — verify with the county assessor before closing.
Climate risk First Street
- Flood 1/10 Low FEMA zone X (unshaded) · 0% chance over 30 yrs
- Wildfire 4/10 Moderate
- Heat 4/10 Moderate 7 d/yr ≥101°F today · 18 d/yr by 30 yrs out
- Wind 3/10 Moderate 5% chance of damaging wind over 30 yrs
- Air quality 4/10 Moderate 4 unhealthy d/yr today · 6 by 30 yrs out
Nearby sold comps map
Loading sold comps map…
Walkable amenities ~0.75 mi
Loading nearby amenities…
Taxation est. · year 1
- Rental income
- $21,750
- − Mortgage interest
- −$6,159
- − Property taxes
- −$238
- − Insurance
- −$550
- − Repairs & maintenance
- −$1,740
- − Management
- −$1,740
- − Depreciation
- −$3,199
- Taxable income
- $8,125
- Est. tax owed @ 24.0%
- −$1,950
- After-tax cash flow
- $7,526/yr
For passive investors: Depreciation is non-cash, so a rental often shows a tax loss while cash-flowing — sheltering income. Rental losses are passive: they offset passive income freely, and up to $25,000/yr can offset ordinary (W-2) income if you actively participate and your MAGI is under $100k (phasing out to $0 by $150k); unused losses carry forward. On sale, claimed depreciation is recaptured at up to 25%, and gains may owe capital-gains tax (a 1031 exchange can defer both). Figures are a year-1 estimate at your 24.0% rate — not tax advice; consult a CPA.
Schools (NCES district)
- District
- Hall County
- NCES district ID
- 1302610
- Math proficiency
- 28% ▼ -12.00%
- Reading proficiency
- 33% ▼ -5.00%
- Median HH income
- $55,708
- Composite
- 27.15/100
- National rank
- #7029
- State rank
- #81 of 174 in GA
Livability — Clermont
- Score
- 66/100
- State rank
- #194
- US rank
- #12104
Category grades
Schools grade is shown separately in the Schools card above.
Census & demographics
- County
- Hall County · 188,353 people
- City population
- 3,975
- Metro
- Gainesville, GA
- Population (ZIP)
- 45,612
- Household income
- $97,413
- Rent vs Own
- Severe rent burden
- 561.0
Population outlook (Hall County) Hauer SSP2
- Today (2025)
- 225,275 people
- By 2030
- 240,204 · +6.6%
- By 2040
- 268,440 · +19.2%
- By 2050
- 293,596 · +30.3%
- By 2075
- 350,293 · +55.5%
- By 2100
- 389,329 · +72.8%
Race, ethnicity, and origin ACS 2023
- Neighborhood character
- Predominantly White (80%)
- Race & ethnicity
- White 80% Hispanic / Latino 11% Two or more races 6% Black 3% Asian 2%
- Hispanic origin (detail)
- Mexican 8%
- Common ancestry
- Slovak 3% Italian 2% Romanian 1%
- Foreign-born
- 7% · Canada, Jamaica, Vietnam
- Languages at home
- 88% English-only · Spanish 10%
Political lean MEDSL · Hall
- 2024 margin
- Solid R (+43.8) · D 27.8% · R 71.6%
- 2008→2024 swing
- +7.1pp toward D · 2008: -50.9pp · 2024: -43.8pp
- All cycles
- 2024: R+43.8 2020: R+43.2 2016: R+50.7 2012: R+56.4 2008: R+50.9
Not yet ingested
- Civics
- —
Market trends
- HPI YoY
- ▼ -122.87%
- Current HPI
- 259.9978
- Rent YoY
- ▲ 3.84%
- Metro
- Gainesville, GA
- State GDP YoY
- ▲ 2.66%
- F500 in state
- 28
Industry mix (Fortune 500 HQ in GA)
| Industry | F500 HQs | Revenue |
|---|---|---|
| Paper / Packaging | 2 | $29B |
|
||
| Retail | 1 | $160B |
|
||
| Transportation / Logistics | 1 | $91B |
|
||
| Airlines | 1 | $62B |
|
||
| Consumer Goods | 1 | $47B |
|
||
| Utilities | 1 | $25B |
|
||
Price history
+185.6% since first listed21 events — show timeline
- 2026-05-11 Pending — GAMLS
- 2026-04-28 Contingent — GAMLS
- 2026-03-18 Relisted — GAMLS
- 2026-03-16 Listing Removed — GAMLS
- 2026-02-27 Price Changed $109,950 GAMLS
- 2026-02-17 Price Changed $115,000 GAMLS
- 2026-01-21 Listing Removed — GAMLS
- 2026-01-16 Listed $129,000 GAMLS
- 2026-01-16 Listed $129,000 GAMLS
- 2025-06-18 Pending — GAMLS
- 2025-06-13 Listing Removed — GAMLS
- 2025-06-06 Relisted — GAMLS
- 2025-04-22 Pending — GAMLS
- 2025-04-14 Relisted — GAMLS
- 2025-04-14 Price Changed $115,000 GAMLS
- 2025-04-07 Pending — GAMLS
- 2025-03-05 Price Changed $179,900 GAMLS
- 2025-03-04 Price Changed $179,000 GAMLS
- 2025-01-17 Listed $189,000 GAMLS
- 2001-12-27 Sold (Public Records) $72,500 Public Records
- 2001-11-20 Sold (Public Records) $38,500 Public Records
Property tax history
+9.6%/yrLatest (2025): $238 · -0.0% YoY. Source: county tax records.
Cash-flow waterfall
monthlySold comps — $/sqft
last 12 mo · ≤1 miLoading sold comps…