7749 Bergamot Cir · The Woodlands, TX
Flood risk No data
- FEMA flood zone
- —
- Chance of flooding over 30 yrs
- —
- Est. flood insurance / yr
- —
Fire risk No data
- Est. fire insurance / yr
- —
Heat risk No data
- Hot days now (above threshold)
- —
- Hot days in 30 yrs
- —
Wind risk No data
- Chance of severe wind over 30 yrs
- —
Air-quality risk No data
- Unhealthy air days now
- —
- Unhealthy air days in 30 yrs
- —
Risk factors via First Street. Map © Google.
Why this score? — see what drove the C grade
The composite is a weighted blend of 9 inputs, each scored 0–100. Each bar is that input's sub-score; the figure is the points it added to the 100-point composite (weight × sub-score).
- Cash flow +14.9/30.0
- Appreciation +10.0/10.0
- ARV discount +9.5/15.0
- DSCR +4.6/10.0
- Livability +4.5/5.0
- Schools +3.9/10.0
- 1% rule +3.1/10.0
- Rent growth +2.6/5.0
- Condition / age +2.5/5.0
$289,900
🖨 Deal sheet (PDF) 📄 Offer letter ✓ Due diligence
Listing remarks MLS
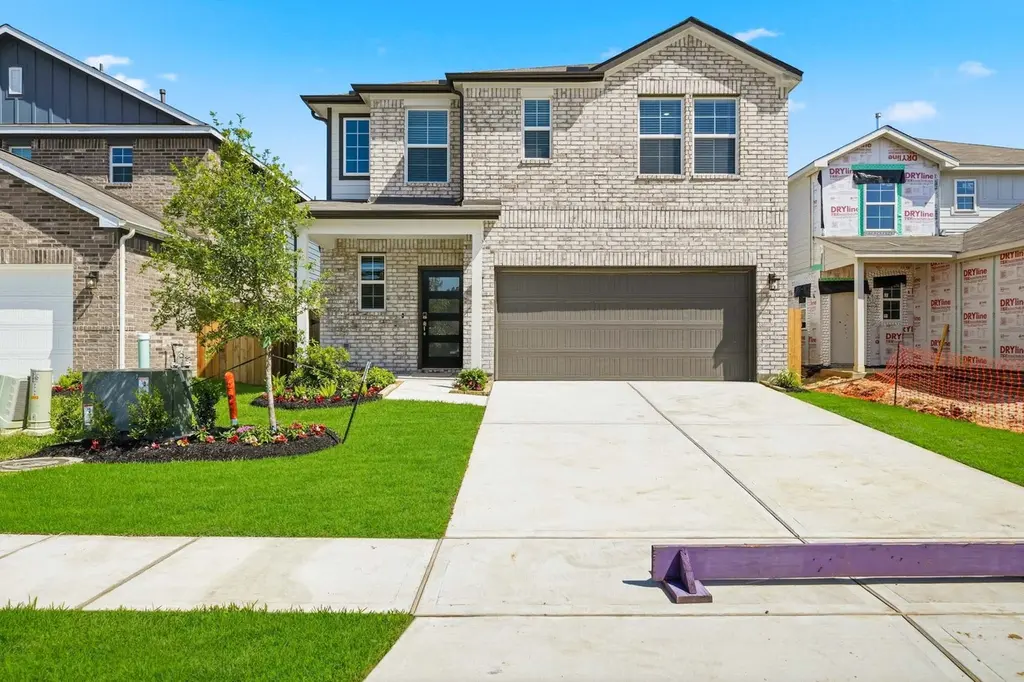
The open-concept design of the two-story Lexington floor plan shows the huge island kitchen connected to the great room and dining room. The open-feel of the home is popular with today's sophisticated buyer, who is looking for a design that fosters togetherness in the home and makes entertaining fun. The use of space in the Lexington is well thought out, with the primary suite privately situated on the first floor, while the secondary bedrooms are on the second floor.
Key facts
- Island kitchen
- Primary suite
- Secondary bedrooms
Tags
Neighborhood map
What this means for you Summary
Snapshot
- This is a 4-bed/2.5-bath land listed at $290k.
Deal economics
- At list price, monthly cash flow is $85 ($1k/yr) — positive.
- The deal already cash-flows at list — no discount required.
- To meet the 1% rule (rent ≥ 1% of price), the offer needs to be $235k (18.9% below list).
- Recommended offer: $235k (18.9% below list) — sets the bar for 1% rule.
- Cap rate 6.6% vs local median 2.3% in The Woodlands — top-decile yield for the area; either an underpriced asset or a hidden risk that comps aren't pricing in. Stress-test before assuming the spread holds.
Location & tenants
- Location reads 91/100 on livability (#1 in TX, #47 nationally) — a professional / high-income tenant draw. Strengths: amenities A+, commute A+, employment A+; Watch: cost of living D-.
- Magnolia ISD (rural): math 42% / reading 45% proficiency, ranked #247 of 826 in TX (top 30%) — families likely to look elsewhere, expect single-tenant / working-renter base with shorter leases.
- Zoned schools: Cedric C Smith (math 48% / reading 42%, grade D-, #1,133 of 4,322 statewide, top 27%, 724 students, 55% FRL); Bear Branch J H (math 44% / reading 46%, grade D, #479 of 1,662 statewide, top 29%, 1,076 students, 37% FRL); Magnolia H S (math 47% / reading 62%, grade C-, #379 of 1,632 statewide, top 26%, 2,248 students, 31% FRL) — zoned schools at 41% FRL track the district average.
- Market conditions: Rents flat; 1622 active listings in the ZIP; 9 comparable units currently listed for rent nearby; rentals at typical pace (median 27d on market — plan ~3-4 weeks tenant-placement turnaround); 44% of comp listings sitting > 30 days — soft ceiling on asking rent; high-income renter base; 13,259 units permitted in Montgomery County in 2024 (1,402 in 5+ unit buildings).
Forward outlook
- In year one you build about $31k of equity ($2k loan paydown + $29k appreciation (10.0% local appreciation)).
- Montgomery County population projected at +65% by 2050 — long-run rental-demand tailwind backs the buy-and-hold thesis.
- At projected returns (10.0% appreciation + 0.3% rent growth), your $81k cash investment doubles in ~3 years — after that, you're playing with house money.
- By year 2, paydown + projected appreciation supports a ~$50k cash-out refi (75% LTV) — recoverable capital for the next deal without selling this one.
Negotiation context
- It's been on market 61 days — a 6% lower offer ($273k) is reasonable based on typical stale-listing flexibility.
Questions for the listing agent
- It's been on market 61 days. Have you received any prior offers? Is the seller open to a 19% concession, seller financing, or rate buy-down credit?
- What does the HOA fee cover, when was the last increase, and are there any pending special assessments or reserve-fund shortfalls?
- Why hasn't it sold? Are there any deal-killer items the seller is aware of (foundation, flood, title, zoning, code violations)?
- Is there a deadline driving the sale (1031 exchange, divorce, estate, relocation)? That informs how much negotiation room exists.
- Schools are A-rated — typically a magnet for longer-tenancy family renters. What's the average tenant stay here, and is there a school-zone premium baked into asking?
- What's the average days-on-market for RENTAL listings here right now (not sales)? A rising rental-DOM trend means longer vacancies and softer asking-rent achievability than the comps imply.
- What's the recent tenant-quality profile in this submarket — average credit score on applications, eviction rate, late-payment / NSF rate, and stable-employment percentage? A property-management company in the area should have these aggregated.
- How much new for-sale + rental construction is in the pipeline within 1–3 miles? Heavy new supply typically softens prices + rents 12–24 months out; constrained supply supports both.
Investment metrics
- 1% rule
- 0.81% ✗
- Cap rate
- 6.64%
- Cash-on-cash
- 1.25%
- DSCR
- 1.06
- GRM
- 10.3
CMA / ARV
- ARV (median comp)
- $303,563
- List price
- $289,900
- Delta
- -4.50%
- Verdict
- FAIR
- Comps
- 20 within 1.0 mi
Projected returns pro-forma
10.0% appreciation · 0.32% rent growth · sell at horizon
- IRR
- 24.3%
- Equity multiple
- 2.93×
- Total profit
- $157,009
- Equity at exit
- $261,165
- IRR
- 21.0%
- Equity multiple
- 6.50×
- Total profit
- $446,696
- Equity at exit
- $563,212
Cash invested: $81,172 (down + closing). Projections, not guarantees.
Landlord ↔ Tenant lean methodology
- Overall (STATE)
- 87 Strongly Landlord-Friendly
- State Texas
- 87 Strongly Landlord-Friendly · R+5
- County
- — inherits STATE
- City
- — inherits STATE
ZIP-level market 77354
- Home prices YoY
- 2.4%
- Rents YoY
- 0.3%
- Active inventory
- 1622
- Price-to-rent
- 10.3×
Monthly cashflow live
- Estimated rent
- $2,351 high interval (Pro) →
- Mortgage (P&I)
- −$1,520
- Tax from tax record
- −$70 /mo · $836/yr
- Insurance
- −$121
- HOA
- −$62
- Lot rent
- −$0
- Vacancy / Maint / Mgmt
- −$494
- Net cashflow
- $85
Break-even live
Sensitivity live
| Price | -10% $249 | -5% $167 | +0% $85 | +5% $3 | +10% $-79 |
|---|---|---|---|---|---|
| Rent | -10% $-101 | -5% $-8 | +0% $85 | +5% $178 | +10% $271 |
| Rate | -1.0pp $231 | -0.5pp $159 | base $85 | +0.5pp $10 | +1.0pp $-67 |
UW: 25.0% down · 7.5% · 30yr · 1.5% tax · 5.0% vac · 8.0% maint · 8.0% mgmt
Financing live
Cash to close
- Down payment
- $72,475
- Closing costs
- $8,697
- Reserves months
- —
- Total cash needed
- —
Loan-product check · same deal, 3 products live
Conventional
25% down · 7.5% · 30yr
- Down + closing
- —
- Monthly P&I
- —
- Monthly cashflow
- —
- DSCR
- —
- Eligible?
- —
Personal DTI + credit; lowest rate.
DSCR
20% down · 8.5% · 30yr
- Down + closing
- —
- Monthly P&I
- —
- Monthly cashflow
- —
- DSCR
- —
- Eligible?
- —
No personal income docs; deal must DSCR.
Hard money
10% down · 12.0% · 12mo
- Down + closing
- —
- Monthly P&I
- —
- Monthly cashflow
- —
- DSCR
- —
- Eligible?
- —
Short-term bridge; refi at stabilization.
Rent comps 9 comps
| Address | Beds | Baths | Sqft | Rent | $/sqft | DOM | Units | Dist |
|---|---|---|---|---|---|---|---|---|
| 7910 Alset Dr Magnolia, TX | 4.0 | 3.0 | 1897 | $2,320 | $1.22 | 46d | 1 | 0.33mi |
| 139 Valiant Ridge Trl Magnolia, TX | 3.0 | 2.0 | 1511 | $1,846 | $1.22 | 15d | 1 | 0.48mi |
| 131 Valiant Ridge Trl Magnolia, TX | 4.0 | 2.0 | 1840 | $2,280 | $1.24 | 1d | 1 | 0.50mi |
| 94 Valiant Ridge Trl Magnolia, TX | 5.0 | 3.0 | 2517 | $2,350 | $0.93 | 46d | 1 | 0.60mi |
| 260 Gallant Front Ln Magnolia, TX | 3.0 | 2.0 | 1410 | $1,975 | $1.40 | 27d | 1 | 0.72mi |
| 260 Gallant Front Ln Magnolia, TX | 3.0 | 2.0 | 1410 | $2,000 | $1.42 | 46d | 1 | 0.72mi |
| 8344 Bristle Cone Pine Way Magnolia, TX | 5.0 | 2.5 | 2200 | $2,900 | $1.32 | 46d | 1 | 0.76mi |
| 3 Peachridge Pl Unit 1 Spring, TX | 3.0 | 2.5 | 1657 | $1,950 | $1.18 | 23d | 1 | 1.30mi |
| 139 Hawkhurst Cir Magnolia, TX | 4.0 | 3.0 | 2563 | $2,950 | $1.15 | 27d | 1 | 1.42mi |
HOA detail
- Monthly dues
- $62 · $744/yr
Listing history 3 events
-
2026-05-19status Pending 472-char remark
Show marketing remark (472 chars)
The open-concept design of the two-story Lexington floor plan shows the huge island kitchen connected to the great room and dining room. The open-feel of the home is popular with today's sophisticated buyer, who is looking for a design that fosters togetherness in the home and makes entertaining fun. The use of space in the Lexington is well thought out, with the primary suite privately situated on the first floor, while the secondary bedrooms are on the second floor.
-
2026-04-02price $289,900 472-char remark
Show marketing remark (472 chars)
The open-concept design of the two-story Lexington floor plan shows the huge island kitchen connected to the great room and dining room. The open-feel of the home is popular with today's sophisticated buyer, who is looking for a design that fosters togetherness in the home and makes entertaining fun. The use of space in the Lexington is well thought out, with the primary suite privately situated on the first floor, while the secondary bedrooms are on the second floor.
-
2026-03-19$296,900 Active 472-char remark
Show marketing remark (472 chars)
The open-concept design of the two-story Lexington floor plan shows the huge island kitchen connected to the great room and dining room. The open-feel of the home is popular with today's sophisticated buyer, who is looking for a design that fosters togetherness in the home and makes entertaining fun. The use of space in the Lexington is well thought out, with the primary suite privately situated on the first floor, while the secondary bedrooms are on the second floor.
ⓘ Source: listings_history table (triggers on properties + properties_extension) + one-shot
backfill from property_details.listing_events for pre-trigger history.
Tax reassessment forecast TX · Resets to sale price
- Current annual tax
- $836 · $70/mo
- Projected year-2 tax
- $5,305 · $442/mo
- Expected delta
- +$4,469/yr (+$372/mo · 534.4%)
ⓘ Screening estimate from a state-policy table — verify with the county assessor before closing.
Nearby sold comps map
Loading sold comps map…
Walkable amenities ~0.75 mi
Loading nearby amenities…
Taxation est. · year 1
- Rental income
- $28,216
- − Mortgage interest
- −$16,239
- − Property taxes
- −$836
- − Insurance
- −$1,450
- − Repairs & maintenance
- −$2,257
- − Management
- −$2,257
- − HOA
- −$744
- − Depreciation
- −$8,433
- Taxable loss
- −$4,000
- Est. tax savings @ 24.0%
- +$960
- After-tax cash flow
- $1,978/yr
For passive investors: Depreciation is non-cash, so a rental often shows a tax loss while cash-flowing — sheltering income. Rental losses are passive: they offset passive income freely, and up to $25,000/yr can offset ordinary (W-2) income if you actively participate and your MAGI is under $100k (phasing out to $0 by $150k); unused losses carry forward. On sale, claimed depreciation is recaptured at up to 25%, and gains may owe capital-gains tax (a 1031 exchange can defer both). Figures are a year-1 estimate at your 24.0% rate — not tax advice; consult a CPA.
Schools (NCES district)
- District
- Magnolia ISD
- NCES district ID
- 4828740
- Math proficiency
- 42% ▼ -7.00%
- Reading proficiency
- 45% ▼ -4.00%
- Median HH income
- $71,692
- Composite
- 39.46/100
- National rank
- #3958
- State rank
- #247 of 826 in TX
Livability — The Woodlands
- Score
- 91/100
- State rank
- #1
- US rank
- #47
Category grades
Schools grade is shown separately in the Schools card above.
Census & demographics
- County
- Montgomery County · 663,713 people
- City population
- 106,505
- Metro
- Houston-The Woodlands-Sugar Land, TX
- Population (ZIP)
- 44,900
- Household income
- $112,504
- Rent vs Own
- Severe rent burden
- 586.0
Population outlook (Montgomery County) Hauer SSP2
- Today (2025)
- 713,896 people
- By 2030
- 805,263 · +12.8%
- By 2040
- 992,708 · +39.1%
- By 2050
- 1,179,590 · +65.2%
- By 2075
- 1,628,084 · +128.1%
- By 2100
- 1,937,880 · +171.5%
Race, ethnicity, and origin ACS 2023
- Neighborhood character
- Predominantly White (66%)
- Race & ethnicity
- White 66% Hispanic / Latino 25% Two or more races 18% Black 3% Asian 1%
- Hispanic origin (detail)
- Mexican 14% Puerto Rican 1%
- Common ancestry
- Lithuanian 4% Slovak 2% Italian 2%
- Foreign-born
- 11% · Canada, Vietnam
- Languages at home
- 83% English-only · Spanish 15% Other Indo-European 1% German/W. Germanic 1%
Political lean MEDSL · Montgomery
- 2024 margin
- Solid R (+45.5) · D 26.8% · R 72.3%
- 2008→2024 swing
- +7.2pp toward D · 2008: -52.7pp · 2024: -45.5pp
- All cycles
- 2024: R+45.5 2020: R+43.8 2016: R+51.4 2012: R+60.7 2008: R+52.7
Not yet ingested
- Civics
- —
Market trends
- HPI YoY
- ▲ 12.09%
- Current HPI
- 512.87
- Rent YoY
- ▲ 0.32%
- Metro
- Houston-The Woodlands-Sugar Land, TX
- State GDP YoY
- ▲ 3.95%
- F500 in state
- 110
Industry mix (Fortune 500 HQ in TX)
| Industry | F500 HQs | Revenue |
|---|---|---|
| Energy | 16 | $1,198B |
|
||
| Technology | 5 | $198B |
|
||
| Engineering / Construction | 4 | $72B |
|
||
| Energy Services | 3 | $60B |
|
||
| Utilities | 3 | $41B |
|
||
| Healthcare | 2 | $330B |
|
||
Price history
-2.4% since first listed3 events — show timeline
- 2026-05-19 Pending — HARMLS
- 2026-04-02 Price Changed $289,900 HARMLS
- 2026-03-19 Listed $296,900 HARMLS
Cash-flow waterfall
monthlySold comps — $/sqft
last 12 mo · ≤1 miLoading sold comps…