23501 Oasis Blvd · Loxley, AL
Flood risk 1/10 · Minimal
- FEMA flood zone
- X (unshaded)
- Chance of flooding over 30 yrs
- 0.0%
- Est. flood insurance / yr
- $507 – $1,088
Fire risk 5/10 · Moderate
- Est. fire insurance / yr
- $916 – $1,700
Heat risk 9/10 · Severe
- Hot days now (above 105°F)
- 7 days/yr
- Hot days in 30 yrs
- 20 days/yr
Wind risk 9/10 · Severe
- Chance of severe wind over 30 yrs
- 99.0%
Air-quality risk 1/10 · Minimal
- Unhealthy air days now
- 0 days/yr
- Unhealthy air days in 30 yrs
- 0 days/yr
Risk factors via First Street. Map © Google.
Why this score? — see what drove the C grade
The composite is a weighted blend of 9 inputs, each scored 0–100. Each bar is that input's sub-score; the figure is the points it added to the 100-point composite (weight × sub-score).
- Cash flow +23.6/30.0
- DSCR +7.6/10.0
- ARV discount +7.6/15.0
- 1% rule +5.3/10.0
- Schools +3.9/10.0
- Livability +3.3/5.0
- Rent growth +2.5/5.0
- Condition / age +2.5/5.0
- Appreciation +0.0/10.0
$149,500
🖨 Deal sheet 📄 Offer letter ✓ Due diligence
Listing remarks MLS
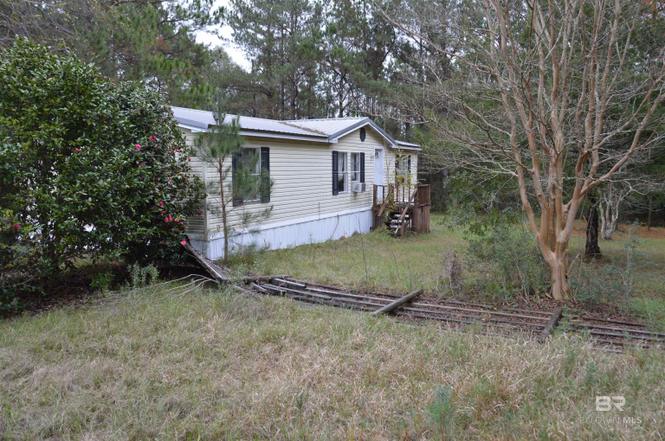
Live OFF the BEATEN PATH in this Well Maintained 3/2 Doublewide Mobile Home. OPEN Floor plan and Tile in the Spacious Living Room! The Master Features a Double Vanity, New Shower/Tub Combo, and Walk-In Closet! The Home Sits back on the Property behind a few Trees & Part of the front Yard is Fenced. Detached Single Garage with a Nice Concrete pad with Plenty of Parking! The storage building has power. Watch Wildlife from the Privacy of your own Back Porch! MUST SEE TO APPRECIATE!!!
Key facts
- Split floor plan
- Wired work shop
- Sunroom
Tags
Neighborhood map
What this means for you Summary
Snapshot
- This is a 3-bed/2.0-bath manufactured listed at $150k.
Deal economics
- At list price, monthly cash flow is $283 ($3k/yr) — positive.
- The deal already cash-flows at list — no discount required.
- Meets the 1% rule at list price ($2k rent vs $150k).
- Recommended offer: $136k (9.0% below list) — sets the bar for market timing.
- Cap rate 8.6% vs local median 4.1% in Loxley — top-decile yield for the area; either an underpriced asset or a hidden risk that comps aren't pricing in. Stress-test before assuming the spread holds.
Location & tenants
- Location reads 66/100 on livability (#95 in AL) — a middle-class / working-renter tenant base. Strengths: housing A+, cost of living A, employment B; Watch: crime D, amenities F, commute F.
- Baldwin County (rural): math 33% / reading 57% proficiency, ranked #18 of 129 in AL (top 14%) — families likely to look elsewhere, expect single-tenant / working-renter base with shorter leases.
- Zoned schools: Central Baldwin Middle School (math 17% / reading 49%, grade F, #101 of 257 statewide, top 40%, 757 students, 74% FRL); Robertsdale High School (math 34% / reading 34%, grade F, #53 of 305 statewide, top 18%, 1,450 students, 64% FRL) — zoned schools average 69% FRL vs 38% district-wide (30 pts higher); higher-poverty schools than district average — tighter screening recommended.
- Market conditions: 193 active listings in the ZIP; 3,883 units permitted in Baldwin County in 2024 (481 in 5+ unit buildings).
Forward outlook
- Local home prices are declining (-3.0%/yr); year-one equity from $1k of loan paydown is wiped out by about $4k of value loss. Plan a longer hold.
- Baldwin County population projected at +42% by 2050 — long-run rental-demand tailwind backs the buy-and-hold thesis.
Negotiation context
- It's been on market 93 days — a 9% lower offer ($136k) is reasonable based on typical stale-listing flexibility.
- 3 sale attempts since 9y ago; this cycle's ask has dropped $36k (20%) from the opening price — seller is motivated, your offer sets the floor, not the list.
Risks & watch-outs
- Climate carrying-cost: severe wind risk, 99% chance of damaging wind over 30y; moderate wildfire risk; extreme-heat days projected 7→20/yr by 2055 (HVAC capex compounding) — expect insurance premiums to compound above CPI over the hold.
Questions for the listing agent
- It's been on market 93 days. Have you received any prior offers? Is the seller open to a 9% concession, seller financing, or rate buy-down credit?
- Why hasn't it sold? Are there any deal-killer items the seller is aware of (foundation, flood, title, zoning, code violations)?
- Is there a deadline driving the sale (1031 exchange, divorce, estate, relocation)? That informs how much negotiation room exists.
- Schools are D-rated, which usually means shorter tenancies and higher turnover. Who's the typical renter profile here, and what's been the actual vacancy rate?
- Crime grade is D in this area — have there been break-ins, vandalism, or insurance claims at this property in the last 3 years? What carrier currently insures it and at what premium?
- What's the average days-on-market for RENTAL listings here right now (not sales)? A rising rental-DOM trend means longer vacancies and softer asking-rent achievability than the comps imply.
- What's the recent tenant-quality profile in this submarket — average credit score on applications, eviction rate, late-payment / NSF rate, and stable-employment percentage? A property-management company in the area should have these aggregated.
- How much new for-sale + rental construction is in the pipeline within 1–3 miles? Heavy new supply typically softens prices + rents 12–24 months out; constrained supply supports both.
Investment metrics
- 1% rule
- 1.03% ✓
- Cap rate
- 8.57%
- Cash-on-cash
- 8.12%
- DSCR
- 1.36
- GRM
- 8.1
CMA / ARV
- ARV (on-the-fly)
- $149,760
- Comps found
- 1
Show comp detail 1 sale within ~0.75 mi
| Address | Dist | Beds/Ba | Sqft | Sold | Price | $/sf | Match |
|---|---|---|---|---|---|---|---|
| 23501 Oasis Blvd | 0.01mi | 3/2.0 | 1,248 (0%) | 1mo | $149,500 | $120 | 99 |
Match score weights: distance 35% · size 25% · config 20% · recency 20%. Top-matched comps best support the ARV.
Projected returns pro-forma
-3.0% appreciation · 3.0% rent growth · sell at horizon
- IRR
- -4.0%
- Equity multiple
- 0.85×
- Total profit
- $-6,234
- Equity at exit
- $22,291
- IRR
- 5.7%
- Equity multiple
- 1.42×
- Total profit
- $17,627
- Equity at exit
- $12,926
Cash invested: $41,860 (down + closing). Projections, not guarantees.
Landlord ↔ Tenant lean methodology
- Overall (STATE)
- 90 Strongly Landlord-Friendly
- State Alabama
- 90 Strongly Landlord-Friendly · R+15
- County
- — inherits STATE
- City
- — inherits STATE
ZIP-level market 36567
- Home prices YoY
- -12.8%
- Active inventory
- 193
- Price-to-rent
- 8.1×
Monthly cashflow live
- Estimated rent
- $1,535 medium interval (Pro) →
- Mortgage (P&I)
- −$784
- Tax from tax record
- −$84 /mo · $1,003/yr
- Insurance
- −$62
- HOA
- −$0
- Vacancy / Maint / Mgmt
- −$322
- Net cashflow
- $283
Break-even live
UW: 25.0% down · 7.5% · 30yr · 1.5% tax · 5.0% vac · 8.0% maint · 8.0% mgmt
Financing live
Cash to close
- Down payment
- $37,375
- Closing costs
- $4,485
- Reserves months
- —
- Total cash needed
- —
Loan-product check · same deal, 3 products live
Conventional
25% down · 7.5% · 30yr
- Down + closing
- —
- Monthly P&I
- —
- Monthly cashflow
- —
- DSCR
- —
- Eligible?
- —
Personal DTI + credit; lowest rate.
DSCR
20% down · 8.5% · 30yr
- Down + closing
- —
- Monthly P&I
- —
- Monthly cashflow
- —
- DSCR
- —
- Eligible?
- —
No personal income docs; deal must DSCR.
Hard money
10% down · 12.0% · 12mo
- Down + closing
- —
- Monthly P&I
- —
- Monthly cashflow
- —
- DSCR
- —
- Eligible?
- —
Short-term bridge; refi at stabilization.
Listing history 11 events
-
2026-05-22soldstatus $149,500 Closed
-
2026-03-06status Pending
-
2026-02-27price $149,500
-
2026-01-29price $159,500
-
2025-12-17price $165,500
-
2025-12-03$185,900 Active
-
2018-10-31soldstatus $78,000
-
2018-10-29soldstatus $88,000 494-char remark
Show marketing remark (494 chars)
Live OFF the BEATEN PATH in this Well Maintained 3/2 Doublewide Mobile Home. OPEN Floor plan and Tile in the Spacious Living Room! The Master Features a Double Vanity, New Shower/Tub Combo, and Walk-In Closet! The Home Sits back on the Property behind a few Trees & Part of the front Yard is Fenced. Detached Single Garage with a Nice Concrete pad with Plenty of Parking! The storage building has power. Watch Wildlife from the Privacy of your own Back Porch! MUST SEE TO APPRECIATE!!!
-
2018-04-14$92,000 494-char remark
Show marketing remark (494 chars)
Live OFF the BEATEN PATH in this Well Maintained 3/2 Doublewide Mobile Home. OPEN Floor plan and Tile in the Spacious Living Room! The Master Features a Double Vanity, New Shower/Tub Combo, and Walk-In Closet! The Home Sits back on the Property behind a few Trees & Part of the front Yard is Fenced. Detached Single Garage with a Nice Concrete pad with Plenty of Parking! The storage building has power. Watch Wildlife from the Privacy of your own Back Porch! MUST SEE TO APPRECIATE!!!
-
2017-05-01$97,900
-
2000-08-07soldstatus $26,900
ⓘ Source: listings_history table (triggers on properties + properties_extension) + one-shot
backfill from property_details.listing_events for pre-trigger history.
Tax reassessment forecast AL · Resets to sale price
- Current annual tax
- $1,003 · $84/mo
- Projected year-2 tax
- $1,003 · $84/mo
- Expected delta
- $0/yr ($0/mo · 0.0%)
ⓘ Screening estimate from a state-policy table — verify with the county assessor before closing.
Climate risk First Street
- Flood 1/10 Low FEMA zone X (unshaded) · 0% chance over 30 yrs
- Wildfire 5/10 Major
- Heat 9/10 Extreme 7 d/yr ≥105°F today · 20 d/yr by 30 yrs out
- Wind 9/10 Extreme 99% chance of damaging wind over 30 yrs
- Air quality 1/10 Low 0 unhealthy d/yr today · 0 by 30 yrs out
Nearby sold comps map
Loading sold comps map…
Walkable amenities ~0.75 mi
Loading nearby amenities…
Taxation est. · year 1
- Rental income
- $18,425
- − Mortgage interest
- −$8,374
- − Property taxes
- −$1,003
- − Insurance
- −$748
- − Repairs & maintenance
- −$1,474
- − Management
- −$1,474
- − Depreciation
- −$4,349
- Taxable income
- $1,003
- Est. tax owed @ 24.0%
- −$241
- After-tax cash flow
- $3,157/yr
For passive investors: Depreciation is non-cash, so a rental often shows a tax loss while cash-flowing — sheltering income. Rental losses are passive: they offset passive income freely, and up to $25,000/yr can offset ordinary (W-2) income if you actively participate and your MAGI is under $100k (phasing out to $0 by $150k); unused losses carry forward. On sale, claimed depreciation is recaptured at up to 25%, and gains may owe capital-gains tax (a 1031 exchange can defer both). Figures are a year-1 estimate at your 24.0% rate — not tax advice; consult a CPA.
Schools (NCES district)
- District
- Baldwin County
- NCES district ID
- 0100270
- Math proficiency
- 33% ▼ -26.00%
- Reading proficiency
- 57% ▲ 1.00%
- Median HH income
- $50,677
- Composite
- 38.61/100
- National rank
- #4157
- State rank
- #18 of 129 in AL
Livability — Loxley
- Score
- 66/100
- State rank
- #95
- US rank
- #11346
Category grades
Schools grade is shown separately in the Schools card above.
Census & demographics
- County
- Baldwin County · 181,514 people
- Metro
- Daphne-Fairhope-Foley, AL
- Population (ZIP)
- 16,095
- Household income
- $66,432
- Rent vs Own
- Severe rent burden
- 274.0
Population outlook (Baldwin County) Hauer SSP2
- Today (2025)
- 248,264 people
- By 2030
- 270,315 · +8.9%
- By 2040
- 312,967 · +26.1%
- By 2050
- 352,262 · +41.9%
- By 2075
- 438,841 · +76.8%
- By 2100
- 487,736 · +96.5%
Race, ethnicity, and origin ACS 2023
- Neighborhood character
- Predominantly White (85%)
- Race & ethnicity
- White 85% Black 11% Two or more races 3% Hispanic / Latino 2%
- Common ancestry
- Serbian 2% Lithuanian 1% Subsaharan African 1%
- Foreign-born
- 1% · Canada
- Languages at home
- 99% English-only · Spanish 1%
Political lean MEDSL · Baldwin
- 2024 margin
- Solid R (+58.2) · D 20.5% · R 78.7%
- 2008→2024 swing
- -6.7pp toward R · 2008: -51.5pp · 2024: -58.2pp
- All cycles
- 2024: R+58.2 2020: R+53.8 2016: R+57.8 2012: R+55.8 2008: R+51.5
Not yet ingested
- Civics
- —
Market trends
- HPI YoY
- ▼ -47.36%
- Current HPI
- 323.3496
- Rent YoY
- —
- Metro
- Daphne-Fairhope-Foley, AL
- State GDP YoY
- ▲ 2.94%
- F500 in state
- 4
Industry mix (Fortune 500 HQ in AL)
| Industry | F500 HQs | Revenue |
|---|---|---|
| Financial Services | 1 | $8B |
|
||
| Healthcare | 1 | $5B |
|
||
Price history
+455.8% since first listed11 events — show timeline
- 2026-05-22 Sold (MLS) $149,500 BCAR
- 2026-03-06 Pending — BCAR
- 2026-02-27 Price Changed $149,500 BCAR
- 2026-01-29 Price Changed $159,500 BCAR
- 2025-12-17 Price Changed $165,500 BCAR
- 2025-12-03 Listed $185,900 BCAR
- 2018-10-31 Sold (Public Records) $78,000 Public Records
- 2018-10-29 Sold (MLS) $88,000 BCAR
- 2018-04-14 Listed $92,000 BCAR
- 2017-05-01 Listed $97,900 BCAR
- 2000-08-07 Sold (Public Records) $26,900 Public Records
Property tax history
+8.8%/yrLatest (2025): $1,003 · +493.4% YoY. Source: county tax records.
Cash-flow waterfall
monthlySold comps — $/sqft
last 12 mo · ≤1 miLoading sold comps…