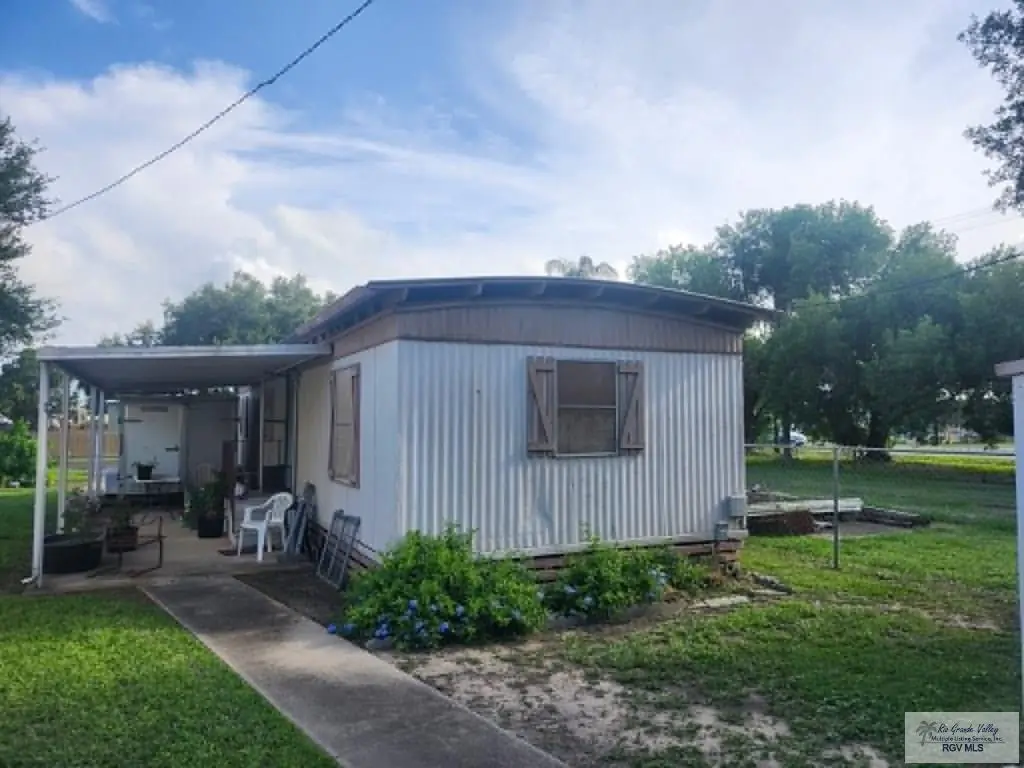
15699 Tangelo Dr · Harlingen, TX
Flood risk 1/10 · Minimal
- FEMA flood zone
- X (unshaded)
- Chance of flooding over 30 yrs
- 0.0%
- Est. flood insurance / yr
- $507 – $1,088
Fire risk 5/10 · Moderate
- Est. fire insurance / yr
- $1,222 – $2,270
Heat risk 9/10 · Severe
- Hot days now (above 111°F)
- 7 days/yr
- Hot days in 30 yrs
- 24 days/yr
Wind risk 8/10 · Major
- Chance of severe wind over 30 yrs
- 99.0%
Air-quality risk 1/10 · Minimal
- Unhealthy air days now
- 0 days/yr
- Unhealthy air days in 30 yrs
- 0 days/yr
Risk factors via First Street. Map © Google.
Why this score? — see what drove the B- grade
The composite is a weighted blend of 9 inputs, each scored 0–100. Each bar is that input's sub-score; the figure is the points it added to the 100-point composite (weight × sub-score).
- Cash flow +30.0/30.0
- 1% rule +10.0/10.0
- DSCR +10.0/10.0
- ARV discount +7.5/15.0
- Livability +3.7/5.0
- Schools +2.5/10.0
- Condition / age +2.2/5.0
- Rent growth +2.0/5.0
- Appreciation +0.0/10.0
$60,000
🖨 Deal sheet 📄 Offer letter ✓ Due diligence
Listing remarks
672 sq. ft. mobile home located at 15699 Tangelo Dr offering a great opportunity for an investor or buyer looking to add their personal touch. Property has potential with a functional layout and convenient location. NOT located in a 55+ community and NO HOA. Easy access to Hwy 77, shopping, dining, and everyday amenities. Sold AS IS. Fixer-Upper. Seller is a licensed Texas real estate agent.
Key facts
- Functional layout
- Convenient location
- 5,526 sq ft lot
Tags
Property features AI
Finance
- HOA & community: Located in Sun Valley Village Mobile Home Park
Exterior
- Utilities: Public sewer
- Home design: Manufactured home; Single-story
- Construction: Aluminum siding
- Exterior features: Metal roof
Interior
- Flooring: Carpet; Laminate
- Bathrooms: 1 full bathroom
- Heating & cooling: Central heating; Central air conditioning
- Interior features: Electric water heater; Crawl space foundation
- Laundry & utility: Washer
Neighborhood map
What this means for you Summary
Snapshot
- This is a 1-bed/1.0-bath manufactured listed at $60k. Condition is rated fair.
Deal economics
- At list price, monthly cash flow is $388 ($5k/yr) — positive.
- The deal already cash-flows at list — no discount required.
- Meets the 1% rule at list price ($1k rent vs $60k).
- Cap rate 14.1% vs local median 3.8% in Harlingen — top-decile yield for the area; either an underpriced asset or a hidden risk that comps aren't pricing in. Stress-test before assuming the spread holds.
Location & tenants
- Location reads 73/100 on livability (#217 in TX) — a middle-class / working-renter tenant base. Strengths: amenities A+, cost of living A+, housing A+; Watch: crime C-, commute F, employment F.
- Harlingen CISD (urban): math 25% / reading 35% proficiency, ranked #647 of 826 in TX (top 78%) — families likely to look elsewhere, expect single-tenant / working-renter base with shorter leases; 74% free/reduced lunch — lower-income household profile, screen leases tightly.
- Zoned schools: Stuart Place El (math 30% / reading 40%, grade F, #1,965 of 4,322 statewide, top 46%, 613 students, 59% FRL); Moises Vela Middle (math 27% / reading 30%, grade F, #1,122 of 1,662 statewide, top 69%, 742 students, 67% FRL); Harlingen H S - South (math 47% / reading 17%, grade F, #1,044 of 1,632 statewide, top 66%, 1,571 students, 75% FRL).
- Market conditions: Rents soft (-1.9%/yr); 534 active listings in the ZIP; 2,326 units permitted in Cameron County in 2024 (503 in 5+ unit buildings).
- This rent is only 17% of the median local income ($70k/yr) — well below the 30% rent-burden line; pricing power to push rent on renewal without tenant pushback.
Forward outlook
- Local home prices are declining (-3.0%/yr); year-one equity from $415 of loan paydown is wiped out by about $2k of value loss. Plan a longer hold.
- Cameron County population projected at +3% by 2050 — modest demand growth; plan on rents tracking national, not racing it.
- At projected returns (-3.0% appreciation + 0.0% rent growth), your $17k cash investment doubles in ~5 years — after that, you're playing with house money.
Negotiation context
- Only 11 days on market — expect competitive offers; lowballing is unlikely to land.
Risks & watch-outs
- Climate carrying-cost: severe wind risk, 99% chance of damaging wind over 30y; moderate wildfire risk; extreme-heat days projected 7→24/yr by 2055 (HVAC capex compounding) — expect insurance premiums to compound above CPI over the hold.
Questions for the listing agent
- Have any recent inspections been done? Can we get a copy of the seller's disclosures and any deferred-maintenance estimates?
- Is there a deadline driving the sale (1031 exchange, divorce, estate, relocation)? That informs how much negotiation room exists.
- Schools are D-rated, which usually means shorter tenancies and higher turnover. Who's the typical renter profile here, and what's been the actual vacancy rate?
- What's the average days-on-market for RENTAL listings here right now (not sales)? A rising rental-DOM trend means longer vacancies and softer asking-rent achievability than the comps imply.
- What's the recent tenant-quality profile in this submarket — average credit score on applications, eviction rate, late-payment / NSF rate, and stable-employment percentage? A property-management company in the area should have these aggregated.
- How much new for-sale + rental construction is in the pipeline within 1–3 miles? Heavy new supply typically softens prices + rents 12–24 months out; constrained supply supports both.
Investment metrics
- 1% rule
- 1.69% ✓
- Cap rate
- 14.06%
- Cash-on-cash
- 27.73%
- DSCR
- 2.23
- GRM
- 4.9
CMA / ARV
No comps found within radius.
Projected returns pro-forma
-3.0% appreciation · 0.0% rent growth · sell at horizon
- IRR
- 18.4%
- Equity multiple
- 1.72×
- Total profit
- $12,040
- Equity at exit
- $8,946
- IRR
- 24.6%
- Equity multiple
- 2.84×
- Total profit
- $30,875
- Equity at exit
- $5,188
Cash invested: $16,800 (down + closing). Projections, not guarantees.
Landlord ↔ Tenant lean methodology
- Overall (STATE)
- 87 Strongly Landlord-Friendly
- State Texas
- 87 Strongly Landlord-Friendly · R+5
- County
- — inherits STATE
- City
- — inherits STATE
ZIP-level market 78552
- Home prices YoY
- -13.8%
- Rents YoY
- -1.9%
- Active inventory
- 534
- Price-to-rent
- 4.9×
Monthly cashflow live
- Estimated rent
- $1,016 medium interval (Pro) →
- Mortgage (P&I)
- −$315
- Tax est. 1.5%
- −$75 /mo · $900/yr
- Insurance
- −$25
- HOA
- −$0
- Vacancy / Maint / Mgmt
- −$213
- Net cashflow
- $388
Break-even live
UW: 25.0% down · 7.5% · 30yr · 1.5% tax · 5.0% vac · 8.0% maint · 8.0% mgmt
Financing live
Cash to close
- Down payment
- $15,000
- Closing costs
- $1,800
- Reserves months
- —
- Total cash needed
- —
Loan-product check · same deal, 3 products live
Conventional
25% down · 7.5% · 30yr
- Down + closing
- —
- Monthly P&I
- —
- Monthly cashflow
- —
- DSCR
- —
- Eligible?
- —
Personal DTI + credit; lowest rate.
DSCR
20% down · 8.5% · 30yr
- Down + closing
- —
- Monthly P&I
- —
- Monthly cashflow
- —
- DSCR
- —
- Eligible?
- —
No personal income docs; deal must DSCR.
Hard money
10% down · 12.0% · 12mo
- Down + closing
- —
- Monthly P&I
- —
- Monthly cashflow
- —
- DSCR
- —
- Eligible?
- —
Short-term bridge; refi at stabilization.
Listing history 8 events
-
2026-06-14statusdays on market $60,000 Pending 11 DOM
-
2026-06-03days on market $60,000 Active 9 DOM
-
2026-06-03remarks 394-char remark
-
2026-06-02days on market $60,000 Active 8 DOM
-
2026-06-01days on market $60,000 Active 7 DOM
-
2026-05-31days on market $60,000 Active 6 DOM
-
2026-05-30days on market $60,000 Active 5 DOM
-
2026-05-25$60,000 Active
ⓘ Source: listings_history table (triggers on properties + properties_extension) + one-shot
backfill from property_details.listing_events for pre-trigger history.
Climate risk First Street
- Flood 1/10 Low FEMA zone X (unshaded) · 0% chance over 30 yrs
- Wildfire 5/10 Major
- Heat 9/10 Extreme 7 d/yr ≥111°F today · 24 d/yr by 30 yrs out
- Wind 8/10 Severe 99% chance of damaging wind over 30 yrs
- Air quality 1/10 Low 0 unhealthy d/yr today · 0 by 30 yrs out
Nearby sold comps map
Loading sold comps map…
Walkable amenities ~0.75 mi
Loading nearby amenities…
Taxation est. · year 1
- Rental income
- $12,195
- − Mortgage interest
- −$3,361
- − Property taxes
- −$900
- − Insurance
- −$300
- − Repairs & maintenance
- −$976
- − Management
- −$976
- − Depreciation
- −$1,745
- Taxable income
- $3,938
- Est. tax owed @ 24.0%
- −$945
- After-tax cash flow
- $3,714/yr
For passive investors: Depreciation is non-cash, so a rental often shows a tax loss while cash-flowing — sheltering income. Rental losses are passive: they offset passive income freely, and up to $25,000/yr can offset ordinary (W-2) income if you actively participate and your MAGI is under $100k (phasing out to $0 by $150k); unused losses carry forward. On sale, claimed depreciation is recaptured at up to 25%, and gains may owe capital-gains tax (a 1031 exchange can defer both). Figures are a year-1 estimate at your 24.0% rate — not tax advice; consult a CPA.
Condition & rehab AI · 21 photos
This mobile home requires significant repairs and updates to improve its condition and increase its value. The roof and exterior siding are in poor condition, and the interior needs painting and carpet replacement. A new HVAC system would also significantly enhance comfort and energy efficiency.
Repairs flagged
- Major roof — visible structural damage
- Major exterior siding — deteriorating condition
- Major HVAC system — visible rust and wear
- Major kitchen cabinets — dated and worn
- Major bathroom fixtures — dated and worn
- Major flooring — worn and exposed subfloor
Value-add opportunities
- Both paint interior walls — enhances curb appeal and interior aesthetics
- Both replace carpet — improves comfort and appearance
- Both repair roof — fixes structural issues and enhances safety
- Both repair exterior siding — enhances curb appeal and structural integrity
- Both replace HVAC system — improves comfort and energy efficiency
Renovation cost estimate screening
| Repair item | Severity | Est. cost |
|---|---|---|
| roof · visible structural damage | Major | $15,000–50,000 |
| exterior siding · deteriorating condition | Major | $15,000–50,000 |
| HVAC system · visible rust and wear | Major | $15,000–50,000 |
| kitchen cabinets · dated and worn | Major | $15,000–50,000 |
| bathroom fixtures · dated and worn | Major | $15,000–50,000 |
| flooring · worn and exposed subfloor | Major | $15,000–50,000 |
| Total estimated repair cost · 6 items | $90,000–300,000 |
Value-add ROI direction
- Both paint interior walls — enhances curb appeal and interior aesthetics ↑
- Both replace carpet — improves comfort and appearance ↑
- Both repair roof — fixes structural issues and enhances safety ↑
- Both repair exterior siding — enhances curb appeal and structural integrity ↑
- Both replace HVAC system — improves comfort and energy efficiency ↑
ⓘ Cost ranges are severity-bucket heuristics (US national rule-of-thumb). Get contractor quotes + a written scope before underwriting a rehab budget.
Schools (NCES district)
- District
- Harlingen CISD
- NCES district ID
- 4822530
- Math proficiency
- 25% ▼ -28.00%
- Reading proficiency
- 35% ▼ -11.00%
- Median HH income
- $37,182
- Composite
- 24.94/100
- National rank
- #7566
- State rank
- #647 of 826 in TX
Livability — Harlingen
- Score
- 73/100
- State rank
- #217
- US rank
- #5347
Category grades
Schools grade is shown separately in the Schools card above.
Census & demographics
- Census place
- Harlingen, TX
- County
- Cameron County · 310,734 people
- City population
- 95,667
- Metro
- Brownsville-Harlingen, TX
- Population (ZIP)
- 42,332
- Household income
- $69,811
- Rent vs Own
- Severe rent burden
- 487.0
Population outlook (Cameron County) Hauer SSP2
- Today (2025)
- 441,603 people
- By 2030
- 448,113 · +1.5%
- By 2040
- 456,385 · +3.3%
- By 2050
- 456,294 · +3.3%
- By 2075
- 423,851 · -4.0%
- By 2100
- 342,787 · -22.4%
Race, ethnicity, and origin ACS 2023
- Neighborhood character
- Predominantly Hispanic (80%)
- Race & ethnicity
- Hispanic / Latino 80% Two or more races 31% White 16% Asian 2%
- Hispanic origin (detail)
- Mexican 75%
- Common ancestry
- Lithuanian 1% Romanian 1% Slovak 1%
- Foreign-born
- 15% · Canada
- Languages at home
- 49% English-only · Spanish 49% Vietnamese 1%
Political lean MEDSL · Cameron
- 2024 margin
- Lean R (+5.8) · D 46.7% · R 52.5%
- 2008→2024 swing
- -34.6pp toward R · 2008: 28.8pp · 2024: -5.8pp
- All cycles
- 2024: R+5.8 2020: D+13.2 2016: D+32.5 2012: D+32.4 2008: D+28.8
Not yet ingested
- Civics
- —
Market trends
- HPI YoY
- ▼ -31.61%
- Current HPI
- 197.1906
- Rent YoY
- ▼ -1.87%
- Metro
- Brownsville-Harlingen, TX
- State GDP YoY
- ▲ 3.95%
- F500 in state
- 110
Industry mix (Fortune 500 HQ in TX)
| Industry | F500 HQs | Revenue |
|---|---|---|
| Energy | 16 | $1,198B |
|
||
| Technology | 5 | $198B |
|
||
| Engineering / Construction | 4 | $72B |
|
||
| Energy Services | 3 | $60B |
|
||
| Utilities | 3 | $41B |
|
||
| Healthcare | 2 | $330B |
|
||
Price history
1 event — show timeline
- 2026-05-25 Listed $60,000 RGVMLS
Cash-flow waterfall
monthlySold comps — $/sqft
last 12 mo · ≤1 miLoading sold comps…