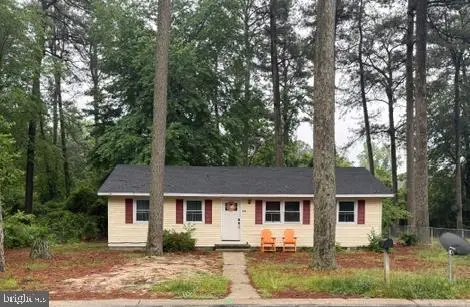
805 Mohawk Ave · Salisbury, MD
Flood risk 1/10 · Minimal
- FEMA flood zone
- X (unshaded)
- Chance of flooding over 30 yrs
- 0.0%
- Est. flood insurance / yr
- $507 – $1,088
Fire risk 3/10 · Minor
- Est. fire insurance / yr
- $755 – $1,403
Heat risk 8/10 · Major
- Hot days now (above 105°F)
- 7 days/yr
- Hot days in 30 yrs
- 15 days/yr
Wind risk 8/10 · Major
- Chance of severe wind over 30 yrs
- 80.0%
Air-quality risk 2/10 · Minimal
- Unhealthy air days now
- 1 days/yr
- Unhealthy air days in 30 yrs
- 2 days/yr
Risk factors via First Street. Map © Google.
Why this score? — see what drove the D grade
The composite is a weighted blend of 9 inputs, each scored 0–100. Each bar is that input's sub-score; the figure is the points it added to the 100-point composite (weight × sub-score).
- Cash flow +14.8/30.0
- ARV discount +6.8/15.0
- DSCR +4.5/10.0
- Rent growth +4.3/5.0
- 1% rule +3.0/10.0
- Livability +3.0/5.0
- Condition / age +2.5/5.0
- Schools +1.9/10.0
- Appreciation +0.0/10.0
$220,000
🖨 Deal sheet 📄 Offer letter ✓ Due diligence
Key facts
- Built 1970
- Listed 18 days
Property features AI
Exterior
- Parking: Driveway
- Utilities: Public sewer; Private water; Electric service
- Home design: Detached structure
- Construction: Block construction; Architectural shingle roof; Crawl space foundation; Year built (estimated)
- Exterior features: Not in a federal flood zone; Property is inside city limits; Above-grade and below-grade structures noted
Interior
- Bedrooms: Four bedrooms on the main level
- Flooring: Luxury vinyl plank
- Bathrooms: One full bathroom; One half bathroom
- Heating & cooling: Heat pump with electric backup; Central air conditioning; Electric hot water
- Interior features: Luxury vinyl plank flooring; No basement
Neighborhood map
What this means for you Summary
Snapshot
- This is a 4-bed/1.5-bath single-family listed at $220k.
Deal economics
- At list price, monthly cash flow is $60 ($726/yr) — positive.
- The deal already cash-flows at list — no discount required.
- To meet the 1% rule (rent ≥ 1% of price), the offer needs to be $175k (20.3% below list).
- Recommended offer: $175k (20.3% below list) — sets the bar for 1% rule.
- Cap rate 6.6% vs local median 4.8% in Salisbury — top-decile yield for the area; either an underpriced asset or a hidden risk that comps aren't pricing in. Stress-test before assuming the spread holds.
Location & tenants
- Location reads 60/100 on livability (#351 in MD) — a middle-class / working-renter tenant base. Strengths: health & safety A+, cost of living A, housing A; Watch: schools D-, crime F, amenities F.
- Wicomico County Public Schools (urban): math 16% / reading 26% proficiency, ranked #19 of 24 in MD (top 79%) — low school quality limits family demand, transient renter base, plan for 1-2y turnover.
- Market conditions: Rents rising fast (+7.2%/yr); 190 active listings in the ZIP; 10 comparable units currently listed for rent nearby; rentals lingering (median 44d on market — plan ~5-8 weeks vacancy on turnover, expect pricing pressure); 70% of comp listings sitting > 30 days — soft ceiling on asking rent; 278 units permitted in Wicomico County in 2024 (44 in 5+ unit buildings).
Forward outlook
- Local home prices are declining (-3.0%/yr); year-one equity from $2k of loan paydown is wiped out by about $7k of value loss. Plan a longer hold.
- Wicomico County population projected at +14% by 2050 — modest demand growth; plan on rents tracking national, not racing it.
Negotiation context
- It's been on market 18 days — a 2% lower offer ($217k) is reasonable based on typical stale-listing flexibility.
- Current owner paid $100k; list at $220k implies a 120% gain — meaningful room to come down on a strong offer.
Risks & watch-outs
- Climate carrying-cost: severe wind risk, 80% chance of damaging wind over 30y; extreme-heat days projected 7→15/yr by 2055 (HVAC capex compounding) — expect insurance premiums to compound above CPI over the hold.
Questions for the listing agent
- Built in 1970 — when were the roof, HVAC, electrical panel, plumbing, and water heater last replaced?
- Is there a deadline driving the sale (1031 exchange, divorce, estate, relocation)? That informs how much negotiation room exists.
- Schools are D-rated, which usually means shorter tenancies and higher turnover. Who's the typical renter profile here, and what's been the actual vacancy rate?
- Crime grade is F in this area — have there been break-ins, vandalism, or insurance claims at this property in the last 3 years? What carrier currently insures it and at what premium?
- The area grade is low — what's the realistic commute time and amenity access for the typical tenant pool here? Any planned neighborhood developments (good or bad) we should know about?
- What's the average days-on-market for RENTAL listings here right now (not sales)? A rising rental-DOM trend means longer vacancies and softer asking-rent achievability than the comps imply.
- What's the recent tenant-quality profile in this submarket — average credit score on applications, eviction rate, late-payment / NSF rate, and stable-employment percentage? A property-management company in the area should have these aggregated.
- How much new for-sale + rental construction is in the pipeline within 1–3 miles? Heavy new supply typically softens prices + rents 12–24 months out; constrained supply supports both.
Investment metrics
- 1% rule
- 0.80% ✗
- Cap rate
- 6.62%
- Cash-on-cash
- 1.18%
- DSCR
- 1.05
- GRM
- 10.5
CMA / ARV
- ARV (on-the-fly)
- $216,480
- Comps found
- 9
Show comp detail 9 sales within ~0.75 mi
| Address | Dist | Beds/Ba | Sqft | Sold | Price | $/sf | Match |
|---|---|---|---|---|---|---|---|
| 819 Miami Ave | 0.04mi | 3/2.0 (-1) | 1,120 (+6%) | 13mo | $235,000 | $210 | 70 |
| 1007 Mohawk Ave | 0.18mi | 3/1.5 (-1) | 1,056 (0%) | 21mo | $81,000 | $77 | 69 |
| 1109 Shawnee Ave | 0.30mi | 3/2.0 (-1) | 1,104 (+4%) | 5mo | $220,000 | $199 | 67 |
| 1109 Pocahontas Ave | 0.25mi | 3/2.0 (-1) | 1,050 (-1%) | 18mo | $235,000 | $224 | 66 |
| 1109 Mineola Ave | 0.25mi | 3/2.0 (-1) | 1,092 (+3%) | 17mo | $260,000 | $238 | 62 |
| 800 East Rd | 0.33mi | 3/2.0 (-1) | 1,165 (+10%) | 3mo | $245,000 | $210 | 58 |
| 723 Ebenezer Dr | 0.24mi | 3/2.0 (-1) | 1,120 (+6%) | 22mo | $229,900 | $205 | 54 |
| 1009 Mohawk Ave | 0.19mi | 3/1.0 (-1) | 912 (-14%) | 13mo | $125,000 | $137 | 50 |
| 310 Penn St | 0.70mi | 3/1.5 (-1) | 1,056 (0%) | 20mo | $205,900 | $195 | 46 |
Match score weights: distance 35% · size 25% · config 20% · recency 20%. Top-matched comps best support the ARV.
Projected returns pro-forma
-3.0% appreciation · 7.21% rent growth · sell at horizon
- IRR
- -10.4%
- Equity multiple
- 0.61×
- Total profit
- $-24,149
- Equity at exit
- $32,803
- IRR
- 3.5%
- Equity multiple
- 1.30×
- Total profit
- $18,207
- Equity at exit
- $19,022
Cash invested: $61,600 (down + closing). Projections, not guarantees.
Landlord ↔ Tenant lean methodology
- Overall (STATE)
- 27 Tenant-Leaning
- State Maryland
- 27 Tenant-Leaning · D+14
- County
- — inherits STATE
- City
- — inherits STATE
ZIP-level market 21801
- Home prices YoY
- -30.6%
- Rents YoY
- 7.2%
- Active inventory
- 190
- Price-to-rent
- 10.5×
Monthly cashflow live
- Estimated rent
- $1,753 high interval (Pro) →
- Mortgage (P&I)
- −$1,154
- Tax from tax record
- −$79 /mo · $952/yr
- Insurance
- −$92
- HOA
- −$0
- Vacancy / Maint / Mgmt
- −$368
- Net cashflow
- $60
Break-even live
UW: 25.0% down · 7.5% · 30yr · 1.5% tax · 5.0% vac · 8.0% maint · 8.0% mgmt
Financing live
Cash to close
- Down payment
- $55,000
- Closing costs
- $6,600
- Reserves months
- —
- Total cash needed
- —
Loan-product check · same deal, 3 products live
Conventional
25% down · 7.5% · 30yr
- Down + closing
- —
- Monthly P&I
- —
- Monthly cashflow
- —
- DSCR
- —
- Eligible?
- —
Personal DTI + credit; lowest rate.
DSCR
20% down · 8.5% · 30yr
- Down + closing
- —
- Monthly P&I
- —
- Monthly cashflow
- —
- DSCR
- —
- Eligible?
- —
No personal income docs; deal must DSCR.
Hard money
10% down · 12.0% · 12mo
- Down + closing
- —
- Monthly P&I
- —
- Monthly cashflow
- —
- DSCR
- —
- Eligible?
- —
Short-term bridge; refi at stabilization.
Rent comps 10 comps
| Address | Beds | Baths | Sqft | Rent | $/sqft | DOM | Units | Dist |
|---|---|---|---|---|---|---|---|---|
| 846 Derwent Ln Salisbury, MD | 3.0 | 2.5 | 1420 | $2,000 | $1.41 | 43d | 1 | 0.93mi |
| 915 N Division St Unit A Salisbury, MD | 3.0 | 1.0 | 900 | $1,395 | $1.55 | 43d | 1 | 1.07mi |
| 504 Plover Rd Salisbury, MD | 3.0 | 1.0 | 768 | $1,295 | $1.69 | 43d | 1 | 1.10mi |
| 507 Overbrook Dr Salisbury, MD | 3.0 | 1.0 | 1140 | $1,495 | $1.31 | 13d | 1 | 1.17mi |
| 550 Riverside Dr Salisbury, MD | 3.0 | 2.0 | 1250 | $1,975 | $1.58 | 43d | 1 | 1.23mi |
| 529 E William St Salisbury, MD | 3.0 | 1.0 | 1057 | $1,495 | $1.41 | 21d | 1 | 1.39mi |
| 518 Alabama Ave Salisbury, MD | 1.0–3.0 | 1.0–2.5 | 1028 | $1,784 | $1.73 | 13d | 14 | 1.40mi |
| 231 Newton St Unit A Salisbury, MD | 3.0 | 1.0 | 1000 | $1,595 | $1.59 | 43d | 1 | 1.41mi |
| 604 Liberty St Salisbury, MD | 3.0 | 1.0 | 1110 | $1,500 | $1.35 | 43d | 1 | 1.47mi |
| 906 Johnson St Salisbury, MD | 3.0 | 1.5 | 875 | $1,495 | $1.71 | 43d | 1 | 1.48mi |
Listing history 18 events
-
2026-06-18days on market $220,000 Active 18 DOM
-
2026-06-17days on market $220,000 Active 17 DOM
-
2026-06-16days on market $220,000 Active 16 DOM
-
2026-06-15days on market $220,000 Active 15 DOM
-
2026-06-14days on market $220,000 Active 13 DOM
-
2026-06-13days on market $220,000 Active 12 DOM
-
2026-06-10days on market $220,000 Active 10 DOM
-
2026-06-09days on market $220,000 Active 9 DOM
-
2026-06-08days on market $220,000 Active 8 DOM
-
2026-06-07days on market $220,000 Active 7 DOM
-
2026-06-03days on market $220,000 Active 3 DOM
-
2026-06-02days on market $220,000 Active 2 DOM
-
2026-06-01statusdays on market $220,000 Active 1 DOM
-
2026-05-31days on market $220,000 Coming Soon 7 DOM
-
2026-05-30days on market $220,000 Coming Soon 6 DOM
-
2026-05-25historical $220,000
-
2025-03-26soldstatus $100,000
-
1976-08-24soldstatus $19,600
ⓘ Source: listings_history table (triggers on properties + properties_extension) + one-shot
backfill from property_details.listing_events for pre-trigger history.
Tax reassessment forecast MD · Partial reset (capped growth)
- Current annual tax
- $952 · $79/mo
- Projected year-2 tax
- $1,675 · $140/mo
- Expected delta
- +$723/yr (+$60/mo · 75.9%)
ⓘ Screening estimate from a state-policy table — verify with the county assessor before closing.
Climate risk First Street
- Flood 1/10 Low FEMA zone X (unshaded) · 0% chance over 30 yrs
- Wildfire 3/10 Moderate
- Heat 8/10 Severe 7 d/yr ≥105°F today · 15 d/yr by 30 yrs out
- Wind 8/10 Severe 80% chance of damaging wind over 30 yrs
- Air quality 2/10 Low 1 unhealthy d/yr today · 2 by 30 yrs out
Nearby sold comps map
Loading sold comps map…
Walkable amenities ~0.75 mi
Loading nearby amenities…
Taxation est. · year 1
- Rental income
- $21,042
- − Mortgage interest
- −$12,323
- − Property taxes
- −$952
- − Insurance
- −$1,100
- − Repairs & maintenance
- −$1,683
- − Management
- −$1,683
- − Depreciation
- −$6,400
- Taxable loss
- −$3,101
- Est. tax savings @ 24.0%
- +$744
- After-tax cash flow
- $1,470/yr
For passive investors: Depreciation is non-cash, so a rental often shows a tax loss while cash-flowing — sheltering income. Rental losses are passive: they offset passive income freely, and up to $25,000/yr can offset ordinary (W-2) income if you actively participate and your MAGI is under $100k (phasing out to $0 by $150k); unused losses carry forward. On sale, claimed depreciation is recaptured at up to 25%, and gains may owe capital-gains tax (a 1031 exchange can defer both). Figures are a year-1 estimate at your 24.0% rate — not tax advice; consult a CPA.
Schools (NCES district)
- District
- Wicomico County Public Schools
- NCES district ID
- 2400690
- Math proficiency
- 16% ▼ -18.00%
- Reading proficiency
- 26% ▼ -13.00%
- Median HH income
- $51,745
- Composite
- 18.87/100
- National rank
- #8860
- State rank
- #19 of 24 in MD
Livability — Salisbury
- Score
- 60/100
- State rank
- #351
- US rank
- #18948
Category grades
Schools grade is shown separately in the Schools card above.
Census & demographics
- County
- Wicomico County · 75,969 people
- City population
- 70,518
- Metro
- Salisbury, MD-DE
- Population (ZIP)
- 30,088
- Household income
- $71,313
- Rent vs Own
- Severe rent burden
- 964.0
Population outlook (Wicomico County) Hauer SSP2
- Today (2025)
- 108,548 people
- By 2030
- 111,783 · +3.0%
- By 2040
- 118,139 · +8.8%
- By 2050
- 123,641 · +13.9%
- By 2075
- 139,784 · +28.8%
- By 2100
- 145,334 · +33.9%
Race, ethnicity, and origin ACS 2023
- Neighborhood character
- Diverse neighborhood (Simpson 0.60)
- Race & ethnicity
- White 54% Black 33% Two or more races 6% Hispanic / Latino 6% Asian 2%
- Hispanic origin (detail)
- Mexican 3%
- Common ancestry
- Hispanic 4% Romanian 2% Slovak 2%
- Foreign-born
- 8% · Canada, China
- Languages at home
- 89% English-only · Spanish 4% French/Haitian/Cajun 3% Other Indo-European 2%
Political lean MEDSL · Wicomico
- 2024 margin
- Lean R (+5.5) · D 46.1% · R 51.5% · Other 2.4%
- 2008→2024 swing
- +0.3pp no change · 2008: -5.8pp · 2024: -5.5pp
- All cycles
- 2024: R+5.5 2020: R+1.9 2016: R+11.6 2012: R+6.9 2008: R+5.8
Not yet ingested
- Civics
- —
Market trends
- HPI YoY
- ▼ -102.55%
- Current HPI
- 232.3103
- Rent YoY
- ▲ 7.21%
- Metro
- Salisbury, MD-DE
- State GDP YoY
- ▲ 2.97%
- F500 in state
- 12
Industry mix (Fortune 500 HQ in MD)
| Industry | F500 HQs | Revenue |
|---|---|---|
| Aerospace / Defense | 1 | $71B |
|
||
| Utilities | 1 | $25B |
|
||
| Hotels | 1 | $24B |
|
||
| Consumer Goods | 1 | $7B |
|
||
| Real Estate | 1 | $6B |
|
||
| Chemicals | 1 | $2B |
|
||
Price history
+1022.4% since first listed3 events — show timeline
- 2026-05-25 Coming Soon $220,000 BRIGHT MLS
- 2025-03-26 Sold (Public Records) $100,000 Public Records
- 1976-08-24 Sold (Public Records) $19,600 Public Records
Property tax history
+3.5%/yrLatest (2025): $952 · +9.6% YoY. Source: county tax records.
Cash-flow waterfall
monthlySold comps — $/sqft
last 12 mo · ≤1 miLoading sold comps…