6552 W 11 1/2 Mile Rd · Elk, MI
Flood risk 1/10 · Minimal
- FEMA flood zone
- —
- Chance of flooding over 30 yrs
- 0.0%
- Est. flood insurance / yr
- —
Fire risk 6/10 · Moderate
- Est. fire insurance / yr
- $784 – $1,456
Heat risk 1/10 · Minimal
- Hot days now (above 95°F)
- 7 days/yr
- Hot days in 30 yrs
- 14 days/yr
Wind risk 1/10 · Minimal
- Chance of severe wind over 30 yrs
- —
Air-quality risk 2/10 · Minimal
- Unhealthy air days now
- 1 days/yr
- Unhealthy air days in 30 yrs
- 2 days/yr
Risk factors via First Street. Map © Google.
Why this score? — see what drove the D grade
The composite is a weighted blend of 9 inputs, each scored 0–100. Each bar is that input's sub-score; the figure is the points it added to the 100-point composite (weight × sub-score).
- Cash flow +11.0/30.0
- Appreciation +10.0/10.0
- ARV discount +7.5/15.0
- DSCR +3.2/10.0
- Rent growth +2.5/5.0
- Livability +2.5/5.0
- Condition / age +2.5/5.0
- Schools +2.3/10.0
- 1% rule +1.9/10.0
$125,000
🖨 Deal sheet (PDF) 📄 Offer letter ✓ Due diligence
Listing remarks MLS
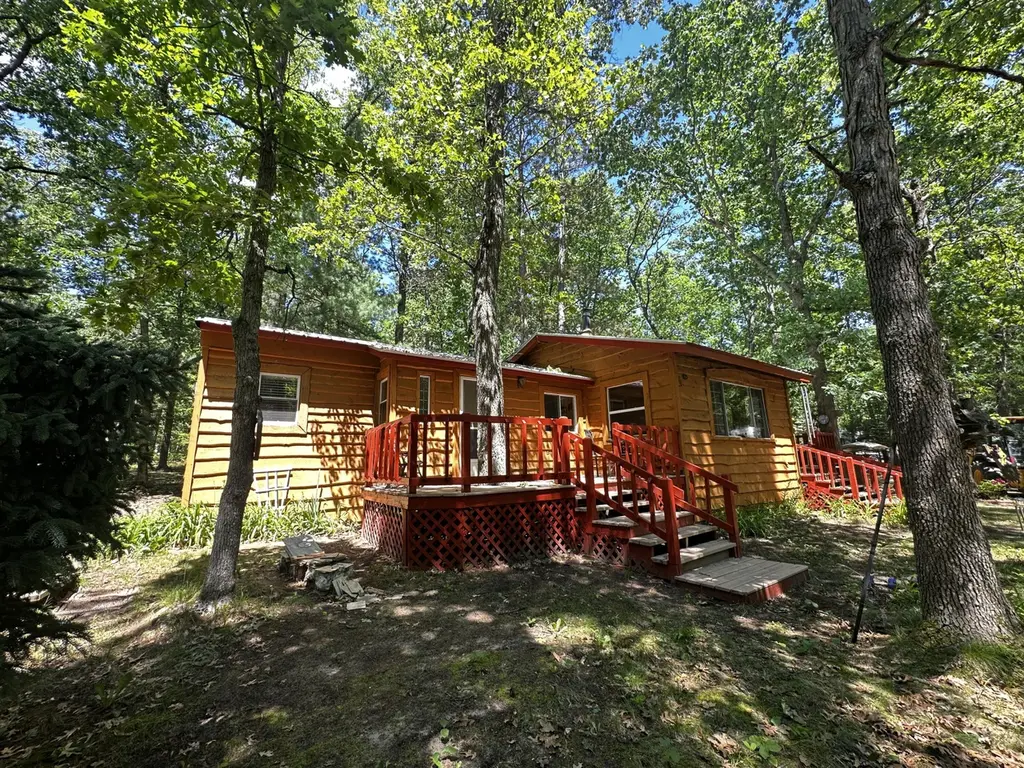
Discover this charming 2-bedroom, 1-bath ranch-style cottage tucked back off the road on a private, wooded 1.18-acre parcel in Irons, MI. The setting is peaceful and secluded, yet conveniently located just off N Brooks Road and only moments from Dublin. The home is an older mobile that has been thoughtfully added onto over the years, creating a more spacious layout with both front and back decks and even a small atrium off the shower--perfect for plants or a cozy spa-like touch. While the home does need some TLC, it's priced accordingly and offers loads of potential for the right buyer. Bring your paintbrush and tools, and with a little sweat equity you can transform this cottage into a delightful up-north retreat worth significantly more. A great opportunity to invest in a quiet, wooded setting close to all the recreational amenities the Irons area is known for.
Key facts
- Front and back decks
- Quiet wooded setting
- 1.18 acre lot
Tags
Property features AI
Exterior
- Utilities: Well water; Propane water heater
- Home design: Ranch-style single-family home; One-story
- Construction: Built in 1974; Wood siding; Metal roof
- Exterior features: Wooded lot; Shed(s) on the property
Interior
- Bathrooms: 1 full bathroom
- Heating & cooling: Forced air heating; Wall unit cooling
- Interior features: Insulated windows; 6 total rooms; Crawl space basement
Neighborhood map
What this means for you Summary
Snapshot
- This is a 2-bed/1.0-bath single-family listed at $125k.
Deal economics
- At list price, monthly cash flow is $-54 ($-644/yr) — negative.
- To cash-flow at today's rent, offer at most $116k (7.6% below list).
- To meet the 1% rule (rent ≥ 1% of price), the offer needs to be $86k (31.0% below list).
- Recommended offer: $86k (31.0% below list) — sets the bar for 1% rule.
Location & tenants
- Location reads: area grade D — affects rentability + tenant quality, not the cash-flow math above.
- Baldwin Community Schools (rural): math 21% / reading 28% proficiency, ranked #618 of 760 in MI (top 81%) — low school quality limits family demand, transient renter base, plan for 1-2y turnover; 85% free/reduced lunch — lower-income household profile, screen leases tightly.
- Zoned schools: Baldwin Elementary School (math 8% / reading 17%, grade F, #1,203 of 1,397 statewide, top 87%, 224 students, 97% FRL); Baldwin Junior High School (math 2% / reading 22%, grade F, #466 of 493 statewide, top 95%, 99 students, 98% FRL); Baldwin Senior High School (math 24% / reading 24%, grade F, #481 of 713 statewide, top 81%, 119 students, 96% FRL).
- Market conditions: 65 active listings in the ZIP; 30 units permitted in Lake County in 2024 (0 in 5+ unit buildings).
Forward outlook
- In year one you build about $13k of equity ($864 loan paydown + $12k appreciation (10.0% local appreciation)).
- Lake County population projected at -22% by 2050 — secular population decline; favor cash flow + early exit over multi-decade hold.
- At projected returns (10.0% appreciation + 3.0% rent growth), your $35k cash investment doubles in ~3 years — after that, you're playing with house money.
- By year 3, paydown + projected appreciation supports a ~$34k cash-out refi (75% LTV) — recoverable capital for the next deal without selling this one.
Negotiation context
- Only 6 days on market — expect competitive offers; lowballing is unlikely to land.
- 3 sale attempts with the ask held roughly flat each time — persistent listings suggest the price (not the market) is what's stuck; bring a comps-based counter.
Risks & watch-outs
- Climate carrying-cost: major wildfire risk — expect insurance premiums to compound above CPI over the hold.
Questions for the listing agent
- What do current leases actually rent for vs. the listed asking? Can we see a recent rent roll and the last 12 months of T-12 income?
- Built in 1974 — when were the roof, HVAC, electrical panel, plumbing, and water heater last replaced?
- Is there a deadline driving the sale (1031 exchange, divorce, estate, relocation)? That informs how much negotiation room exists.
- The area grade is low — what's the realistic commute time and amenity access for the typical tenant pool here? Any planned neighborhood developments (good or bad) we should know about?
- What's the average days-on-market for RENTAL listings here right now (not sales)? A rising rental-DOM trend means longer vacancies and softer asking-rent achievability than the comps imply.
- What's the recent tenant-quality profile in this submarket — average credit score on applications, eviction rate, late-payment / NSF rate, and stable-employment percentage? A property-management company in the area should have these aggregated.
- How much new for-sale + rental construction is in the pipeline within 1–3 miles? Heavy new supply typically softens prices + rents 12–24 months out; constrained supply supports both.
Investment metrics
- 1% rule
- 0.69% ✗
- Cap rate
- 5.78%
- Cash-on-cash
- -1.84%
- DSCR
- 0.92
- GRM
- 12.1
CMA / ARV
No comps found within radius.
Projected returns pro-forma
10.0% appreciation · 3.0% rent growth · sell at horizon
- IRR
- 22.9%
- Equity multiple
- 2.85×
- Total profit
- $64,594
- Equity at exit
- $112,610
- IRR
- 20.5%
- Equity multiple
- 6.51×
- Total profit
- $192,775
- Equity at exit
- $242,848
Cash invested: $35,000 (down + closing). Projections, not guarantees.
Landlord ↔ Tenant lean methodology
- Overall (STATE)
- 62 Landlord-Friendly
- State Michigan
- 62 Landlord-Friendly · EVEN
- County
- — inherits STATE
- City
- — inherits STATE
ZIP-level market 49644
- Home prices YoY
- 12.6%
- Active inventory
- 65
- Price-to-rent
- 12.1×
Monthly cashflow live
- Estimated rent
- $862 medium interval (Pro) →
- Mortgage (P&I)
- −$656
- Tax from tax record
- −$27 /mo · $329/yr
- Insurance
- −$52
- HOA
- −$0
- Vacancy / Maint / Mgmt
- −$181
- Net cashflow
- $-54
Break-even live
Sensitivity live
| Price | -10% $17 | -5% $-18 | +0% $-54 | +5% $-89 | +10% $-124 |
|---|---|---|---|---|---|
| Rent | -10% $-122 | -5% $-88 | +0% $-54 | +5% $-20 | +10% $14 |
| Rate | -1.0pp $9 | -0.5pp $-22 | base $-54 | +0.5pp $-86 | +1.0pp $-119 |
UW: 25.0% down · 7.5% · 30yr · 1.5% tax · 5.0% vac · 8.0% maint · 8.0% mgmt
Financing live
Cash to close
- Down payment
- $31,250
- Closing costs
- $3,750
- Reserves months
- —
- Total cash needed
- —
Loan-product check · same deal, 3 products live
Conventional
25% down · 7.5% · 30yr
- Down + closing
- —
- Monthly P&I
- —
- Monthly cashflow
- —
- DSCR
- —
- Eligible?
- —
Personal DTI + credit; lowest rate.
DSCR
20% down · 8.5% · 30yr
- Down + closing
- —
- Monthly P&I
- —
- Monthly cashflow
- —
- DSCR
- —
- Eligible?
- —
No personal income docs; deal must DSCR.
Hard money
10% down · 12.0% · 12mo
- Down + closing
- —
- Monthly P&I
- —
- Monthly cashflow
- —
- DSCR
- —
- Eligible?
- —
Short-term bridge; refi at stabilization.
Listing history 6 events
-
2026-06-21days on market $125,000 Active 6 DOM
-
2026-06-21days on market $125,000 Active 5 DOM
-
2026-06-18days on market $125,000 Active 3 DOM
-
2026-06-17days on market $125,000 Active 2 DOM
-
2026-06-16remarks 699-char remark
-
2026-06-16$125,000 Active 1 DOM
ⓘ Source: listings_history table (triggers on properties + properties_extension) + one-shot
backfill from property_details.listing_events for pre-trigger history.
Tax reassessment forecast MI · Partial reset (capped growth)
- Current annual tax
- $329 · $27/mo
- Projected year-2 tax
- $1,127 · $94/mo
- Expected delta
- +$798/yr (+$67/mo · 242.8%)
ⓘ Screening estimate from a state-policy table — verify with the county assessor before closing.
Climate risk First Street
- Flood 1/10 Low 0% chance over 30 yrs
- Wildfire 6/10 Major
- Heat 1/10 Low 7 d/yr ≥95°F today · 14 d/yr by 30 yrs out
- Wind 1/10 Low
- Air quality 2/10 Low 1 unhealthy d/yr today · 2 by 30 yrs out
Nearby sold comps map
Loading sold comps map…
Walkable amenities ~0.75 mi
Loading nearby amenities…
Taxation est. · year 1
- Rental income
- $10,349
- − Mortgage interest
- −$7,002
- − Property taxes
- −$329
- − Insurance
- −$625
- − Repairs & maintenance
- −$828
- − Management
- −$828
- − Depreciation
- −$3,636
- Taxable loss
- −$2,899
- Est. tax savings @ 24.0%
- +$696
- After-tax cash flow
- $52/yr
For passive investors: Depreciation is non-cash, so a rental often shows a tax loss while cash-flowing — sheltering income. Rental losses are passive: they offset passive income freely, and up to $25,000/yr can offset ordinary (W-2) income if you actively participate and your MAGI is under $100k (phasing out to $0 by $150k); unused losses carry forward. On sale, claimed depreciation is recaptured at up to 25%, and gains may owe capital-gains tax (a 1031 exchange can defer both). Figures are a year-1 estimate at your 24.0% rate — not tax advice; consult a CPA.
Schools (NCES district)
- District
- Baldwin Community Schools
- NCES district ID
- 2603810
- Math proficiency
- 21% ▲ 3.00%
- Reading proficiency
- 28% ▼ -2.00%
- Median HH income
- $27,638
- Composite
- 22.56/100
- National rank
- #13447
- State rank
- #618 of 760 in MI
Livability — Elk
No livability data for this city. (Only ~50 U.S. cities are tracked.)
Census & demographics
- Population (ZIP)
- 1,846
Population outlook (Lake County) Hauer SSP2
- Today (2025)
- 10,933 people
- By 2030
- 10,503 · -3.9%
- By 2040
- 9,470 · -13.4%
- By 2050
- 8,526 · -22.0%
- By 2075
- 7,160 · -34.5%
- By 2100
- 5,634 · -48.5%
Race, ethnicity, and origin ACS 2023
- Neighborhood character
- Predominantly White (92%)
- Race & ethnicity
- White 92% Two or more races 6% Hispanic / Latino 1%
- Common ancestry
- Romanian 8% Iranian 4% Lithuanian 2%
- Foreign-born
- 0%
- Languages at home
- 99% English-only · Spanish 1%
Political lean MEDSL · Lake
- 2024 margin
- Solid R (+32.2) · D 33.2% · R 65.4% · Other 1.4%
- 2008→2024 swing
- -44.5pp toward R · 2008: 12.3pp · 2024: -32.2pp
- All cycles
- 2024: R+32.2 2020: R+26.2 2016: R+22.9 2012: D+5.0 2008: D+12.3
Not yet ingested
- Civics
- —
Market trends
- HPI YoY
- ▲ 26.53%
- Current HPI
- 236.7989
- Rent YoY
- —
- Metro
- —
- State GDP YoY
- ▲ 1.37%
- F500 in state
- 28
Industry mix (Fortune 500 HQ in MI)
| Industry | F500 HQs | Revenue |
|---|---|---|
| Automotive Parts | 3 | $48B |
|
||
| Automotive | 2 | $372B |
|
||
| Chemicals | 1 | $45B |
|
||
| Automotive Retail | 1 | $29B |
|
||
| Healthcare / Medical Devices | 1 | $23B |
|
||
| Automotive Technology | 1 | $20B |
|
||
Price history
+0.0% since first listed3 events — show timeline
- 2026-06-15 Listed $125,000 REALCOMP
- 2026-06-15 Listed $125,000 MiRealSource-MiMLS
- 2026-06-15 Listed $125,000 SW Michigan MLS
Property tax history
+1.9%/yrLatest (2024): $329 · +4.5% YoY. Source: county tax records.
Cash-flow waterfall
monthlySold comps — $/sqft
last 12 mo · ≤1 miLoading sold comps…