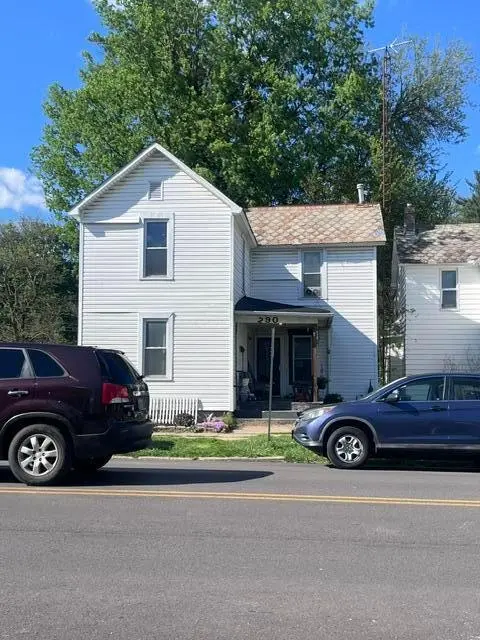
290 W Hunter St · Logan, OH
Flood risk 6/10 · Moderate
- FEMA flood zone
- X (unshaded)
- Chance of flooding over 30 yrs
- 0.71%
- Est. flood insurance / yr
- $473 – $860
Fire risk 3/10 · Minor
- Est. fire insurance / yr
- $713 – $1,323
Heat risk 4/10 · Minor
- Hot days now (above 99°F)
- 7 days/yr
- Hot days in 30 yrs
- 19 days/yr
Wind risk 2/10 · Minimal
- Chance of severe wind over 30 yrs
- 1.0%
Air-quality risk 2/10 · Minimal
- Unhealthy air days now
- 1 days/yr
- Unhealthy air days in 30 yrs
- 2 days/yr
Risk factors via First Street. Map © Google.
Why this score? — see what drove the B grade
The composite is a weighted blend of 9 inputs, each scored 0–100. Each bar is that input's sub-score; the figure is the points it added to the 100-point composite (weight × sub-score).
- Cash flow +28.6/30.0
- ARV discount +15.0/15.0
- DSCR +10.0/10.0
- 1% rule +7.1/10.0
- Schools +4.7/10.0
- Livability +3.9/5.0
- Rent growth +2.5/5.0
- Condition / age +2.5/5.0
- Appreciation +0.0/10.0
$135,000
🖨 Deal sheet 📄 Offer letter ✓ Due diligence
Listing remarks
Attention Home Renovators! This 2- story, 3-BR, 1 bath home may be the one you are looking for. Being sold in 'as is' condition, this will make a great family home or rental. Property was previously used as rental.
Key facts
- 3,049 sq ft lot
- Built 1900
- Listed 27 days
Property features AI
Exterior
- Utilities: Public water; Public sewer
- Home design: Single-family residence; Two levels; Built in 1900; No common walls
- Construction: Block foundation
- Exterior features: Outbuilding on the property
Interior
- Bedrooms: One main-level bedroom
- Flooring: Other flooring
- Bathrooms: One full bathroom
- Heating & cooling: Forced air heating; Hot water heating
- Interior features: Basement present; Living area approximately 1,456
Neighborhood map
What this means for you Summary
Snapshot
- This is a 3-bed/1.0-bath single-family listed at $135k.
Deal economics
- At list price, monthly cash flow is $447 ($5k/yr) — positive.
- The deal already cash-flows at list — no discount required.
- Meets the 1% rule at list price ($2k rent vs $135k).
- Recommended offer: $133k (1.5% below list) — sets the bar for market timing.
- Cap rate 10.3% vs local median 2.4% in Logan — top-decile yield for the area; either an underpriced asset or a hidden risk that comps aren't pricing in. Stress-test before assuming the spread holds.
Location & tenants
- Location reads 78/100 on livability (#162 in OH, #2,412 nationally) — a middle-class / working-renter tenant base. Strengths: amenities A+, cost of living A+, housing A+; Watch: commute F, employment F.
- Logan-Hocking Local (rural): math 55% / reading 58% proficiency, ranked #354 of 656 in OH (top 54%) — acceptable for families but not a draw, mixed tenant base, ~2y average lease.
- Market conditions: 163 active listings in the ZIP; 11 units permitted in Hocking County in 2024 (0 in 5+ unit buildings).
- This rent runs 30% of the median local income ($65k/yr) — at the standard rent-burdened threshold; future hikes will face affordability resistance.
Forward outlook
- Local home prices are declining (-3.0%/yr); year-one equity from $933 of loan paydown is wiped out by about $4k of value loss. Plan a longer hold.
- Hocking County population projected at -22% by 2050 — secular population decline; favor cash flow + early exit over multi-decade hold.
- At projected returns (-3.0% appreciation + 3.0% rent growth), your $38k cash investment doubles in ~9 years — after that, you're playing with house money.
Negotiation context
- It's been on market 27 days — a 2% lower offer ($133k) is reasonable based on typical stale-listing flexibility.
- Current owner paid $10k; list at $135k implies a 1250% gain — meaningful room to come down on a strong offer.
Risks & watch-outs
- Watch-outs: built in 1900 — expect roof / HVAC / electrical / plumbing capex.
- Climate carrying-cost: major flood risk — expect insurance premiums to compound above CPI over the hold.
Questions for the listing agent
- Built in 1900 — when were the roof, HVAC, electrical panel, plumbing, and water heater last replaced?
- Is there a deadline driving the sale (1031 exchange, divorce, estate, relocation)? That informs how much negotiation room exists.
- Schools are A-rated — typically a magnet for longer-tenancy family renters. What's the average tenant stay here, and is there a school-zone premium baked into asking?
- What's the average days-on-market for RENTAL listings here right now (not sales)? A rising rental-DOM trend means longer vacancies and softer asking-rent achievability than the comps imply.
- What's the recent tenant-quality profile in this submarket — average credit score on applications, eviction rate, late-payment / NSF rate, and stable-employment percentage? A property-management company in the area should have these aggregated.
- How much new for-sale + rental construction is in the pipeline within 1–3 miles? Heavy new supply typically softens prices + rents 12–24 months out; constrained supply supports both.
Investment metrics
- 1% rule
- 1.21% ✓
- Cap rate
- 10.26%
- Cash-on-cash
- 14.18%
- DSCR
- 1.63
- GRM
- 6.9
CMA / ARV
- ARV (on-the-fly)
- $205,296
- Comps found
- 12
Show comp detail 12 sales within ~0.75 mi
| Address | Dist | Beds/Ba | Sqft | Sold | Price | $/sf | Match |
|---|---|---|---|---|---|---|---|
| 235 W Main St | 0.10mi | 3/1.5 | 1,496 (+3%) | 2mo | $89,000 | $59 | 87 |
| 460 W 2nd St | 0.15mi | 3/1.0 | 1,392 (-4%) | 1mo | $227,800 | $164 | 85 |
| 394 Church St | 0.09mi | 3/2.0 | 1,558 (+7%) | 3mo | $220,000 | $141 | 78 |
| 578 N Market St | 0.36mi | 3/1.0 | 1,456 (0%) | 7mo | $240,000 | $165 | 77 |
| 447 Church St | 0.12mi | 3/1.5 | 1,560 (+7%) | 12mo | $170,000 | $109 | 70 |
| 582 N Walnut St | 0.50mi | 3/1.0 | 1,424 (-2%) | 6mo | $190,000 | $133 | 68 |
| 461 W 2nd St | 0.17mi | 3/1.0 | 1,279 (-12%) | 12mo | $80,000 | $63 | 62 |
| 507 W 2nd St | 0.17mi | 2/2.0 (-1) | 1,668 (+15%) | 0mo | $189,000 | $113 | 58 |
| 1240 Church St | 0.70mi | 3/1.5 | 1,404 (-4%) | 1mo | $240,000 | $171 | 58 |
| 111 Falls St | 0.62mi | 3/1.5 | 1,568 (+8%) | 6mo | $175,000 | $112 | 51 |
| 347 Belva Ct | 0.75mi | 3/1.0 | 1,273 (-13%) | 6mo | $206,999 | $163 | 39 |
| 707 Edgehill Dr | 0.71mi | 3/1.5 | 1,241 (-15%) | 5mo | $225,900 | $182 | 36 |
Match score weights: distance 35% · size 25% · config 20% · recency 20%. Top-matched comps best support the ARV.
Projected returns pro-forma
-3.0% appreciation · 3.0% rent growth · sell at horizon
- IRR
- 4.5%
- Equity multiple
- 1.17×
- Total profit
- $6,538
- Equity at exit
- $20,129
- IRR
- 13.9%
- Equity multiple
- 2.12×
- Total profit
- $42,195
- Equity at exit
- $11,672
Cash invested: $37,800 (down + closing). Projections, not guarantees.
Landlord ↔ Tenant lean methodology
- Overall (STATE)
- 73 Landlord-Friendly
- State Ohio
- 73 Landlord-Friendly · R+6
- County
- — inherits STATE
- City
- — inherits STATE
ZIP-level market 43138
- Home prices YoY
- -29.9%
- Active inventory
- 163
- Price-to-rent
- 6.9×
Monthly cashflow live
- Estimated rent
- $1,633 medium interval (Pro) →
- Mortgage (P&I)
- −$708
- Tax from tax record
- −$79 /mo · $949/yr
- Insurance
- −$56
- HOA
- −$0
- Vacancy / Maint / Mgmt
- −$343
- Net cashflow
- $447
Break-even live
UW: 25.0% down · 7.5% · 30yr · 1.5% tax · 5.0% vac · 8.0% maint · 8.0% mgmt
Financing live
Cash to close
- Down payment
- $33,750
- Closing costs
- $4,050
- Reserves months
- —
- Total cash needed
- —
Loan-product check · same deal, 3 products live
Conventional
25% down · 7.5% · 30yr
- Down + closing
- —
- Monthly P&I
- —
- Monthly cashflow
- —
- DSCR
- —
- Eligible?
- —
Personal DTI + credit; lowest rate.
DSCR
20% down · 8.5% · 30yr
- Down + closing
- —
- Monthly P&I
- —
- Monthly cashflow
- —
- DSCR
- —
- Eligible?
- —
No personal income docs; deal must DSCR.
Hard money
10% down · 12.0% · 12mo
- Down + closing
- —
- Monthly P&I
- —
- Monthly cashflow
- —
- DSCR
- —
- Eligible?
- —
Short-term bridge; refi at stabilization.
Listing history 16 events
-
2026-06-18days on market $135,000 Active 27 DOM
-
2026-06-17days on market $135,000 Active 26 DOM
-
2026-06-16days on market $135,000 Active 25 DOM
-
2026-06-15days on market $135,000 Active 24 DOM
-
2026-06-13days on market $135,000 Active 22 DOM
-
2026-06-13days on market $135,000 Active 21 DOM
-
2026-06-09days on market $135,000 Active 18 DOM
-
2026-06-08days on market $135,000 Active 17 DOM
-
2026-06-07days on market $135,000 Active 16 DOM
-
2026-06-05days on market $135,000 Active 13 DOM
-
2026-06-03days on market $135,000 Active 12 DOM
-
2026-06-02days on market $135,000 Active 11 DOM
-
2026-06-01days on market $135,000 Active 10 DOM
-
2026-05-31days on market $135,000 Active 9 DOM
-
2026-05-02$135,000 Active
-
1984-01-03soldstatus $10,000
ⓘ Source: listings_history table (triggers on properties + properties_extension) + one-shot
backfill from property_details.listing_events for pre-trigger history.
Tax reassessment forecast OH · Partial reset (capped growth)
- Current annual tax
- $949 · $79/mo
- Projected year-2 tax
- $1,527 · $127/mo
- Expected delta
- +$579/yr (+$48/mo · 61.0%)
ⓘ Screening estimate from a state-policy table — verify with the county assessor before closing.
Climate risk First Street
- Flood 6/10 Major FEMA zone X (unshaded) · 71% chance over 30 yrs
- Wildfire 3/10 Moderate
- Heat 4/10 Moderate 7 d/yr ≥99°F today · 19 d/yr by 30 yrs out
- Wind 2/10 Low 100% chance of damaging wind over 30 yrs
- Air quality 2/10 Low 1 unhealthy d/yr today · 2 by 30 yrs out
Nearby sold comps map
Loading sold comps map…
Walkable amenities ~0.75 mi
Loading nearby amenities…
Taxation est. · year 1
- Rental income
- $19,593
- − Mortgage interest
- −$7,562
- − Property taxes
- −$949
- − Insurance
- −$675
- − Repairs & maintenance
- −$1,567
- − Management
- −$1,567
- − Depreciation
- −$3,927
- Taxable income
- $3,345
- Est. tax owed @ 24.0%
- −$803
- After-tax cash flow
- $4,556/yr
For passive investors: Depreciation is non-cash, so a rental often shows a tax loss while cash-flowing — sheltering income. Rental losses are passive: they offset passive income freely, and up to $25,000/yr can offset ordinary (W-2) income if you actively participate and your MAGI is under $100k (phasing out to $0 by $150k); unused losses carry forward. On sale, claimed depreciation is recaptured at up to 25%, and gains may owe capital-gains tax (a 1031 exchange can defer both). Figures are a year-1 estimate at your 24.0% rate — not tax advice; consult a CPA.
Schools (NCES district)
- District
- Logan-Hocking Local
- NCES district ID
- 3904424
- Math proficiency
- 55% ▼ -16.00%
- Reading proficiency
- 58% ▼ -11.00%
- Median HH income
- $42,737
- Composite
- 47.48/100
- National rank
- #2276
- State rank
- #354 of 656 in OH
Livability — Logan
- Score
- 78/100
- State rank
- #162
- US rank
- #2412
Category grades
Schools grade is shown separately in the Schools card above.
Census & demographics
- Census place
- Logan, OH
- County
- Hocking · 26,658 people
- Metro
- Columbus, OH
- Population (ZIP)
- 19,147
- Household income
- $65,028
- Rent vs Own
- Severe rent burden
- 13.8
Population outlook (Hocking County) Hauer SSP2
- Today (2025)
- 26,807 people
- By 2030
- 25,723 · -4.0%
- By 2040
- 23,370 · -12.8%
- By 2050
- 20,947 · -21.9%
- By 2075
- 15,624 · -41.7%
- By 2100
- 11,134 · -58.5%
Race, ethnicity, and origin ACS 2023
- Neighborhood character
- Predominantly White (93%)
- Race & ethnicity
- White 93% Two or more races 3% Hispanic / Latino 1%
- Common ancestry
- Slovak 2% Iranian 2% Italian 1%
- Foreign-born
- 1%
- Languages at home
- 99% English-only · Spanish 1%
Political lean MEDSL · Hocking
- 2024 margin
- Solid R (+44.3) · D 27.5% · R 71.8%
- 2008→2024 swing
- -43.5pp toward R · 2008: -0.8pp · 2024: -44.3pp
- All cycles
- 2024: R+44.3 2020: R+42.4 2016: R+36.5 2012: R+1.1 2008: R+0.8
Not yet ingested
- Civics
- —
Market trends
- HPI YoY
- ▼ -108.44%
- Current HPI
- 253.6737
- Rent YoY
- —
- Metro
- —
- State GDP YoY
- ▲ 1.98%
- F500 in state
- 48
Industry mix (Fortune 500 HQ in OH)
| Industry | F500 HQs | Revenue |
|---|---|---|
| Insurance | 3 | $145B |
|
||
| Industrial Machinery | 3 | $49B |
|
||
| Financial Services | 3 | $24B |
|
||
| Consumer Goods | 2 | $93B |
|
||
| Aerospace / Defense | 2 | $47B |
|
||
| Utilities | 2 | $33B |
|
||
Price history
+1250.0% since first listed2 events — show timeline
- 2026-05-02 Listed $135,000 CBRMLS
- 1984-01-03 Sold (Public Records) $10,000 Public Records
Property tax history
+4.6%/yrLatest (2025): $949 · +30.9% YoY. Source: county tax records.
Cash-flow waterfall
monthlySold comps — $/sqft
last 12 mo · ≤1 miLoading sold comps…