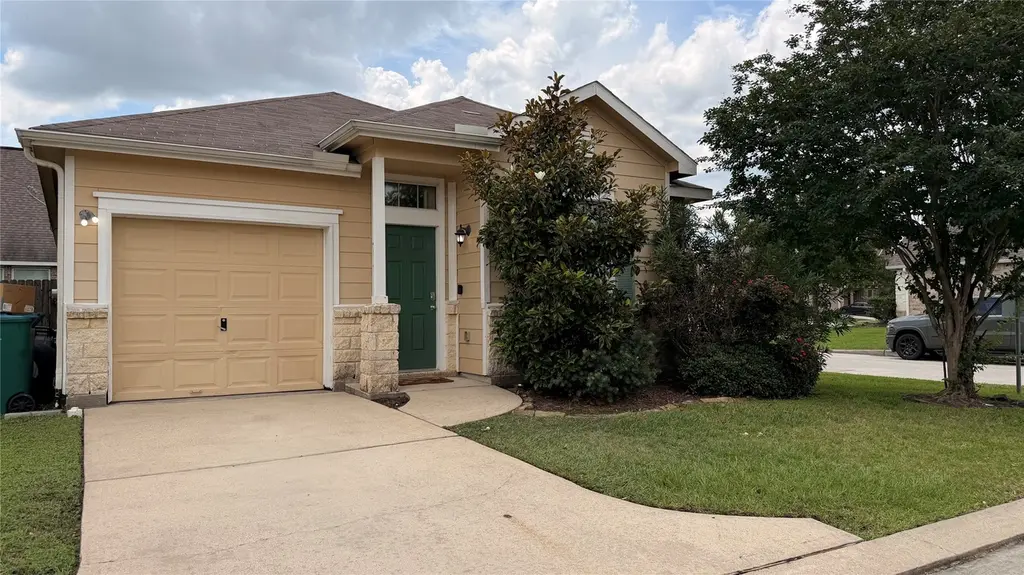
4079 Mossy Spring Ln · Houston, TX
Flood risk 7/10 · Major
- FEMA flood zone
- X (unshaded)
- Chance of flooding over 30 yrs
- 0.99%
- Est. flood insurance / yr
- $507 – $1,088
Fire risk 4/10 · Minor
- Est. fire insurance / yr
- $1,222 – $2,270
Heat risk 9/10 · Severe
- Hot days now (above 110°F)
- 7 days/yr
- Hot days in 30 yrs
- 26 days/yr
Wind risk 8/10 · Major
- Chance of severe wind over 30 yrs
- 99.0%
Air-quality risk 3/10 · Minor
- Unhealthy air days now
- 3 days/yr
- Unhealthy air days in 30 yrs
- 3 days/yr
Risk factors via First Street. Map © Google.
Why this score? — see what drove the D+ grade
The composite is a weighted blend of 9 inputs, each scored 0–100. Each bar is that input's sub-score; the figure is the points it added to the 100-point composite (weight × sub-score).
- Cash flow +14.2/30.0
- ARV discount +9.9/15.0
- 1% rule +5.1/10.0
- DSCR +4.3/10.0
- Schools +4.1/10.0
- Livability +3.7/5.0
- Condition / age +2.5/5.0
- Rent growth +2.2/5.0
- Appreciation +0.0/10.0
$205,000
🖨 Deal sheet (PDF) 📄 Offer letter ✓ Due diligence
Listing remarks MLS
Looking for a home in the Klein School District? Look no further. This classy, well lighted home is located on a corner lot and is not far from the freeway and local shopping venues. It has high ceilings with an open floor plan that opens up to the living room. Perfect for entertaining.
Key facts
- 3,741 sq ft lot
- Garage
- Built 2010
Property features AI
Finance
- HOA & community: Community managed by First Service Residential; Annual association fee of $440; Community amenities include picnic area and playground
Exterior
- Parking: Attached garage (1 car)
- Utilities: Public water; Public sewer
- Home design: Residential property; Single-story entry (all main rooms listed on first floor)
- Construction: Built in 2010; Cement siding with stone accents; Composition roof; Slab foundation
- Exterior features: Private fenced backyard; Corner lot in a subdivision; Concrete road/drive surface
Interior
- Kitchen: Dishwasher; Gas cooktop; Gas oven; Microwave; Garbage disposal
- Bedrooms: Three bedrooms total; Primary bedroom on first floor (approx. 15x10); Two additional bedrooms on first floor (each approx. 10x10)
- Bathrooms: Two full bathrooms
- Interior features: High ceilings; Kitchen/family room combo; Kitchen/dining combo; Tub with shower; Ceiling fan(s)
- Laundry & utility: Washer hookup; Gas dryer hookup
Neighborhood map
What this means for you Summary
Snapshot
- This is a 3-bed/2.0-bath single-family listed at $205k.
Deal economics
- At list price, monthly cash flow is $-32 ($-386/yr) — negative.
- To cash-flow at today's rent, offer at most $199k (2.8% below list).
- Meets the 1% rule at list price ($2k rent vs $205k).
- Recommended offer: $199k (2.8% below list) — sets the bar for cash-flow.
- Cap rate 6.5% vs local median 3.2% in Houston — top-decile yield for the area; either an underpriced asset or a hidden risk that comps aren't pricing in. Stress-test before assuming the spread holds.
Location & tenants
- Location reads 74/100 on livability (#184 in TX, #4,771 nationally) — a middle-class / working-renter tenant base. Strengths: amenities A+, cost of living A+, housing A+; Watch: crime F.
- Klein ISD (suburban): math 41% / reading 48% proficiency, ranked #213 of 826 in TX (top 26%) — families likely to look elsewhere, expect single-tenant / working-renter base with shorter leases.
- Zoned schools: Zwink El (math 44% / reading 46%, grade D-, #1,133 of 4,322 statewide, top 27%, 948 students, 56% FRL); Schindewolf Int (math 31% / reading 43%, grade F, #756 of 1,662 statewide, top 47%, 1,152 students, 55% FRL); Klein H S (math 58% / reading 67%, grade B-, #234 of 1,632 statewide, top 14%, 3,352 students, 45% FRL).
- Market conditions: Rents soft (-1.1%/yr); 330 active listings in the ZIP; 22 comparable units currently listed for rent nearby; rentals at typical pace (median 14d on market — plan ~3-4 weeks tenant-placement turnaround); solid renter incomes; 29,883 units permitted in Harris County in 2024 (8,621 in 5+ unit buildings).
Forward outlook
- Local home prices are declining (-3.0%/yr); year-one equity from $1k of loan paydown is wiped out by about $6k of value loss. Plan a longer hold.
- Harris County population projected at +47% by 2050 — long-run rental-demand tailwind backs the buy-and-hold thesis.
Negotiation context
- It's been on market 20 days — a 2% lower offer ($202k) is reasonable based on typical stale-listing flexibility.
- 3 sale attempts since 16y ago with the ask held roughly flat each time — persistent listings suggest the price (not the market) is what's stuck; bring a comps-based counter.
Risks & watch-outs
- Watch-outs: flood insurance adds $66/mo.
- Climate carrying-cost: major flood risk; severe wind risk, 99% chance of damaging wind over 30y; extreme-heat days projected 7→26/yr by 2055 (HVAC capex compounding) — expect insurance premiums to compound above CPI over the hold.
Questions for the listing agent
- What do current leases actually rent for vs. the listed asking? Can we see a recent rent roll and the last 12 months of T-12 income?
- What's the actual annual flood-insurance premium (NFIP or private), and is the property in a SFHA with mandatory coverage?
- What does the HOA fee cover, when was the last increase, and are there any pending special assessments or reserve-fund shortfalls?
- Is there a deadline driving the sale (1031 exchange, divorce, estate, relocation)? That informs how much negotiation room exists.
- Schools are D-rated, which usually means shorter tenancies and higher turnover. Who's the typical renter profile here, and what's been the actual vacancy rate?
- Crime grade is F in this area — have there been break-ins, vandalism, or insurance claims at this property in the last 3 years? What carrier currently insures it and at what premium?
- The area grade is low — what's the realistic commute time and amenity access for the typical tenant pool here? Any planned neighborhood developments (good or bad) we should know about?
- What's the average days-on-market for RENTAL listings here right now (not sales)? A rising rental-DOM trend means longer vacancies and softer asking-rent achievability than the comps imply.
- What's the recent tenant-quality profile in this submarket — average credit score on applications, eviction rate, late-payment / NSF rate, and stable-employment percentage? A property-management company in the area should have these aggregated.
- How much new for-sale + rental construction is in the pipeline within 1–3 miles? Heavy new supply typically softens prices + rents 12–24 months out; constrained supply supports both.
Investment metrics
- 1% rule
- 1.01% ✓
- Cap rate
- 6.49%
- Cash-on-cash
- 0.72%
- DSCR
- 1.03
- GRM
- 8.3
CMA / ARV
- ARV (on-the-fly)
- $216,423
- Comps found
- 12
Show comp detail 12 sales within ~0.75 mi
| Address | Dist | Beds/Ba | Sqft | Sold | Price | $/sf | Match |
|---|---|---|---|---|---|---|---|
| 21831 Mossy Field Ln | 0.17mi | 3/2.5 | 1,271 (+2%) | 0mo | $220,000 | $173 | 87 |
| 4071 Mossy Place Ln | 0.07mi | 3/2.0 | 1,199 (-4%) | 6mo | $200,000 | $167 | 85 |
| 21755 Mossy Field Ln | 0.13mi | 3/2.0 | 1,199 (-4%) | 9mo | $222,500 | $186 | 80 |
| 3938 Falvel Shadow Creek Dr | 0.09mi | 3/2.0 | 1,394 (+11%) | 4mo | $229,500 | $165 | 74 |
| 3962 Mossy Place Ln | 0.23mi | 3/2.5 | 1,388 (+11%) | 3mo | $199,900 | $144 | 67 |
| 22102 Falvel Dr | 0.44mi | 3/2.0 | 1,208 (-3%) | 9mo | $199,000 | $165 | 66 |
| 21531 Roseville Dr | 0.48mi | 3/1.0 | 1,196 (-4%) | 6mo | $190,000 | $159 | 61 |
| 3927 Falvel Cove Dr | 0.35mi | 3/2.0 | 1,434 (+15%) | 4mo | $259,000 | $181 | 56 |
| 21507 Meadowhill Dr | 0.71mi | 2/2.0 (-1) | 1,188 (-5%) | 2mo | $217,000 | $183 | 52 |
| 3327 Haydee Rd | 0.71mi | 3/2.0 | 1,335 (+7%) | 8mo | $224,900 | $168 | 49 |
| 3323 Hartfield Ln | 0.74mi | 2/2.0 (-1) | 1,190 (-5%) | 9mo | $218,000 | $183 | 45 |
| 3702 Acorn Way Ln | 0.66mi | 3/2.0 | 1,435 (+15%) | 6mo | $249,000 | $174 | 40 |
Match score weights: distance 35% · size 25% · config 20% · recency 20%. Top-matched comps best support the ARV.
Projected returns pro-forma
-3.0% appreciation · 0.0% rent growth · sell at horizon
- IRR
- -21.3%
- Equity multiple
- 0.28×
- Total profit
- $-41,134
- Equity at exit
- $30,566
- IRR
- -26.5%
- Equity multiple
- -0.06×
- Total profit
- $-61,096
- Equity at exit
- $17,725
Cash invested: $57,400 (down + closing). Projections, not guarantees.
Landlord ↔ Tenant lean methodology
- Overall (STATE)
- 87 Strongly Landlord-Friendly
- State Texas
- 87 Strongly Landlord-Friendly · R+5
- County
- — inherits STATE
- City
- — inherits STATE
ZIP-level market 77388
- Home prices YoY
- -34.8%
- Rents YoY
- -1.1%
- Active inventory
- 330
- Price-to-rent
- 8.3×
Monthly cashflow live
- Estimated rent
- $2,065 high interval (Pro) →
- Mortgage (P&I)
- −$1,075
- Tax from tax record
- −$399 /mo · $4,792/yr
- Insurance
- −$85
- Flood insurance flood zone
- −$66 /mo · $798/yr
- HOA
- −$37
- Vacancy / Maint / Mgmt
- −$434
- Net cashflow
- $-32
Break-even live
Sensitivity live
| Price | -10% $84 | -5% $26 | +0% $-32 | +5% $-90 | +10% $-148 |
|---|---|---|---|---|---|
| Rent | -10% $-195 | -5% $-114 | +0% $-32 | +5% $49 | +10% $131 |
| Rate | -1.0pp $71 | -0.5pp $20 | base $-32 | +0.5pp $-85 | +1.0pp $-139 |
UW: 25.0% down · 7.5% · 30yr · 1.5% tax · 5.0% vac · 8.0% maint · 8.0% mgmt
Financing live
Cash to close
- Down payment
- $51,250
- Closing costs
- $6,150
- Reserves months
- —
- Total cash needed
- —
Loan-product check · same deal, 3 products live
Conventional
25% down · 7.5% · 30yr
- Down + closing
- —
- Monthly P&I
- —
- Monthly cashflow
- —
- DSCR
- —
- Eligible?
- —
Personal DTI + credit; lowest rate.
DSCR
20% down · 8.5% · 30yr
- Down + closing
- —
- Monthly P&I
- —
- Monthly cashflow
- —
- DSCR
- —
- Eligible?
- —
No personal income docs; deal must DSCR.
Hard money
10% down · 12.0% · 12mo
- Down + closing
- —
- Monthly P&I
- —
- Monthly cashflow
- —
- DSCR
- —
- Eligible?
- —
Short-term bridge; refi at stabilization.
Rent comps 22 comps
| Address | Beds | Baths | Sqft | Rent | $/sqft | DOM | Units | Dist |
|---|---|---|---|---|---|---|---|---|
| 4018 Falvel Shadow Creek Dr Spring, TX | 4.0 | 2.0 | 1458 | $1,960 | $1.34 | 13d | 1 | 0.09mi |
| 4209 Spring Stuebner Rd Unit 4246 Spring, TX | 2.0 | 2.0 | 1277 | $1,950 | $1.53 | 1d | 1 | 0.13mi |
| 4209 Spring Stuebner Rd Unit 3228 Spring, TX | 3.0 | 2.0 | 1584 | $2,221 | $1.40 | 0d | 1 | 0.13mi |
| 4209 Spring Stuebner Rd Unit 4242 Spring, TX | 3.0 | 2.0 | 1584 | $2,210 | $1.40 | 13d | 1 | 0.13mi |
| 4209 Spring Stuebner Rd Unit 424 Spring, TX | 2.0 | 2.0 | 1277 | $1,966 | $1.54 | 9d | 1 | 0.13mi |
| 4209 Spring Stuebner Rd Unit 2228 Spring, TX | 2.0 | 2.0 | 1277 | $2,001 | $1.57 | 0d | 1 | 0.13mi |
| 21771 Mossy Field Ln Spring, TX | 3.0 | 3.0 | 1631 | $2,150 | $1.32 | 45d | 1 | 0.16mi |
| 3880 Farm to Market 2920 Spring, TX | 1.0–3.0 | 1.0–2.0 | 1037 | $2,536 | $2.45 | 0d | 26 | 0.60mi |
| 4114 Farm to Market 2920 Spring, TX | 1.0–2.0 | 1.0–2.0 | 964 | $2,146 | $2.22 | 1d | 23 | 0.62mi |
| 3899 Farm to Market 2920 Unit 2920 Spring, TX | 2.0 | 2.0 | 1149 | $1,796 | $1.56 | 14d | 1 | 0.68mi |
| 3869 Farm to Market 2920 Unit 2920 Spring, TX | 2.0 | 2.0 | 1056 | $1,774 | $1.68 | 26d | 1 | 0.69mi |
| 3402 Almondwood Dr Spring, TX | 3.0 | 2.0 | 1414 | $1,795 | $1.27 | 14d | 1 | 0.81mi |
| 3607 Nutwood Ln Spring, TX | 3.0 | 3.0 | 1299 | $2,399 | $1.85 | 45d | 1 | 0.87mi |
| 4703 Owens Creek Ln Spring, TX | 3.0 | 2.0 | 1662 | $1,920 | $1.16 | 21d | 1 | 1.24mi |
| 21330 N Tangle Creek Ln Spring, TX | 3.0 | 2.0 | 1231 | $1,836 | $1.49 | 45d | 1 | 1.26mi |
| 21400 Big Spring Valley Ave Spring, TX | 1.0–3.0 | 1.0–2.5 | 1074 | $2,370 | $2.21 | 4d | 67 | 1.28mi |
| 5222 Farm to Market 2920 Unit SOSG Spring, TX | 2.0 | 2.0 | 1173 | $1,548 | $1.32 | 14d | 1 | 1.28mi |
| 2953 FM 2920 Rd Spring, TX | 1.0–3.0 | 1.0–2.0 | 996 | $2,280 | $2.29 | 0d | 23 | 1.36mi |
| 4703 Fleming Downe Ln Spring, TX | 3.0 | 2.0 | 1490 | $1,950 | $1.31 | 26d | 1 | 1.37mi |
| 3789 Spring Cypress Rd Spring, TX | 2.0 | 2.0 | 1126 | $1,589 | $1.41 | 14d | 1 | 1.44mi |
| 5498 Farm to Market 2920 Unit 2920 Spring, TX | 2.0 | 2.0 | 975 | $1,419 | $1.46 | 26d | 1 | 1.49mi |
| 3223 Spring Cypress Rd Spring, TX | 1.0–2.0 | 1.0–2.0 | 999 | $1,739 | $1.74 | 45d | 1 | 1.50mi |
HOA detail
- Monthly dues
- $37 · $444/yr
Listing history 13 events
-
2026-06-21days on market $205,000 Active 20 DOM
-
2026-06-18days on market $205,000 Active 17 DOM
-
2026-06-17days on market $205,000 Active 16 DOM
-
2026-06-16days on market $205,000 Active 15 DOM
-
2026-06-15days on market $205,000 Active 14 DOM
-
2026-06-13days on market $205,000 Active 12 DOM
-
2026-06-09days on market $205,000 Active 8 DOM
-
2026-06-08days on market $205,000 Active 7 DOM
-
2026-06-07days on market $205,000 Active 6 DOM
-
2026-06-04days on market $205,000 Active 3 DOM
-
2026-06-03days on market $205,000 Active 2 DOM
-
2026-06-01remarks 459-char remark
-
2026-06-01$205,000 Active 1 DOM
ⓘ Source: listings_history table (triggers on properties + properties_extension) + one-shot
backfill from property_details.listing_events for pre-trigger history.
Tax reassessment forecast TX · Resets to sale price
- Current annual tax
- $4,792 · $399/mo
- Projected year-2 tax
- $4,792 · $399/mo
- Expected delta
- $0/yr ($0/mo · 0.0%)
ⓘ Screening estimate from a state-policy table — verify with the county assessor before closing.
Climate risk First Street
- Flood 7/10 Severe FEMA zone X (unshaded) · 99% chance over 30 yrs
- Wildfire 4/10 Moderate
- Heat 9/10 Extreme 7 d/yr ≥110°F today · 26 d/yr by 30 yrs out
- Wind 8/10 Severe 99% chance of damaging wind over 30 yrs
- Air quality 3/10 Moderate 3 unhealthy d/yr today · 3 by 30 yrs out
Nearby sold comps map
Loading sold comps map…
Walkable amenities ~0.75 mi
Loading nearby amenities…
Taxation est. · year 1
- Rental income
- $24,776
- − Mortgage interest
- −$11,483
- − Property taxes
- −$4,792
- − Insurance
- −$1,822
- − Repairs & maintenance
- −$1,982
- − Management
- −$1,982
- − HOA
- −$444
- − Depreciation
- −$5,964
- Taxable loss
- −$3,693
- Est. tax savings @ 24.0%
- +$886
- After-tax cash flow
- $501/yr
For passive investors: Depreciation is non-cash, so a rental often shows a tax loss while cash-flowing — sheltering income. Rental losses are passive: they offset passive income freely, and up to $25,000/yr can offset ordinary (W-2) income if you actively participate and your MAGI is under $100k (phasing out to $0 by $150k); unused losses carry forward. On sale, claimed depreciation is recaptured at up to 25%, and gains may owe capital-gains tax (a 1031 exchange can defer both). Figures are a year-1 estimate at your 24.0% rate — not tax advice; consult a CPA.
Schools (NCES district)
- District
- Klein ISD
- NCES district ID
- 4825740
- Math proficiency
- 41% ▼ -12.00%
- Reading proficiency
- 48% ▼ -3.00%
- Median HH income
- $78,288
- Composite
- 40.91/100
- National rank
- #3615
- State rank
- #213 of 826 in TX
Livability — Houston
- Score
- 74/100
- State rank
- #184
- US rank
- #4771
Category grades
Schools grade is shown separately in the Schools card above.
Census & demographics
- County
- Harris County · 4,702,590 people
- City population
- 3,226,434
- Metro
- Houston-The Woodlands-Sugar Land, TX
- Population (ZIP)
- 53,425
- Household income
- $102,323
- Rent vs Own
- Severe rent burden
- 1419.0
Population outlook (Harris County) Hauer SSP2
- Today (2025)
- 5,571,493 people
- By 2030
- 6,089,821 · +9.3%
- By 2040
- 7,142,806 · +28.2%
- By 2050
- 8,185,864 · +46.9%
- By 2075
- 10,574,329 · +89.8%
- By 2100
- 12,109,958 · +117.4%
Race, ethnicity, and origin ACS 2023
- Neighborhood character
- Diverse neighborhood (Simpson 0.70)
- Race & ethnicity
- White 45% Hispanic / Latino 25% Black 18% Two or more races 12% Asian 8%
- Hispanic origin (detail)
- Mexican 15%
- Common ancestry
- Slovak 2% Lithuanian 2% Romanian 1%
- Foreign-born
- 15% · Canada, Vietnam, China
- Languages at home
- 74% English-only · Spanish 18% Other Indo-European 2% Other Asian/Pacific 1%
Political lean MEDSL · Harris
- 2024 margin
- Lean D (+5.5) · D 52.0% · R 46.4% · Other 1.6%
- 2008→2024 swing
- +3.9pp toward D · 2008: 1.6pp · 2024: 5.5pp
- All cycles
- 2024: D+5.5 2020: D+13.3 2016: D+12.4 2012: D+0.1 2008: D+1.6
Not yet ingested
- Civics
- —
Market trends
- HPI YoY
- ▼ -121.68%
- Current HPI
- 228.128
- Rent YoY
- ▼ -1.08%
- Metro
- Houston-The Woodlands-Sugar Land, TX
- State GDP YoY
- ▲ 3.95%
- F500 in state
- 110
Industry mix (Fortune 500 HQ in TX)
| Industry | F500 HQs | Revenue |
|---|---|---|
| Energy | 16 | $1,198B |
|
||
| Technology | 5 | $198B |
|
||
| Engineering / Construction | 4 | $72B |
|
||
| Energy Services | 3 | $60B |
|
||
| Utilities | 3 | $41B |
|
||
| Healthcare | 2 | $330B |
|
||
Price history
+121.1% since first listed10 events — show timeline
- 2026-06-01 Listed $205,000 HARMLS
- 2014-11-17 Sold (Public Records) — Public Records
- 2014-11-07 Sold (MLS) — HARMLS
- 2014-10-19 Pending — HARMLS
- 2014-10-09 Pending — HARMLS
- 2014-10-02 Price Changed $122,700 HARMLS
- 2014-09-03 Listed $125,000 HARMLS
- 2010-07-27 Sold (MLS) — HARMLS
- 2010-06-15 Listing Removed — HARMLS
- 2010-06-14 Listed $92,730 HARMLS
Property tax history
+18.1%/yrLatest (2025): $4,792 · -6.2% YoY. Source: county tax records.
Cash-flow waterfall
monthlySold comps — $/sqft
last 12 mo · ≤1 miLoading sold comps…