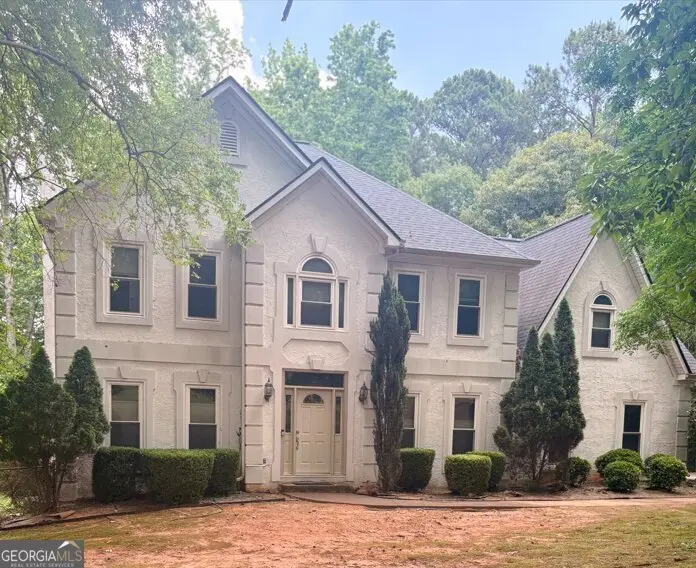
135 Golden Glen Way · Peachtree City, GA
Flood risk 1/10 · Minimal
- FEMA flood zone
- X (unshaded)
- Chance of flooding over 30 yrs
- 0.0%
- Est. flood insurance / yr
- $473 – $860
Fire risk 4/10 · Minor
- Est. fire insurance / yr
- $963 – $1,789
Heat risk 5/10 · Moderate
- Hot days now (above 104°F)
- 7 days/yr
- Hot days in 30 yrs
- 18 days/yr
Wind risk 6/10 · Moderate
- Chance of severe wind over 30 yrs
- 27.0%
Air-quality risk 3/10 · Minor
- Unhealthy air days now
- 4 days/yr
- Unhealthy air days in 30 yrs
- 4 days/yr
Risk factors via First Street. Map © Google.
Why this score? — see what drove the C+ grade
The composite is a weighted blend of 9 inputs, each scored 0–100. Each bar is that input's sub-score; the figure is the points it added to the 100-point composite (weight × sub-score).
- Cash flow +20.3/30.0
- ARV discount +15.0/15.0
- DSCR +6.4/10.0
- 1% rule +6.2/10.0
- Schools +5.1/10.0
- Livability +3.7/5.0
- Rent growth +3.6/5.0
- Condition / age +2.5/5.0
- Appreciation +0.0/10.0
$280,000
🖨 Deal sheet 📄 Offer letter ✓ Due diligence
Listing remarks
Located in The Landings, this 4 bedroom, 3.5 bathroom home offers a private cul-de-sac lot and a basement with both finished and unfinished space. The finished basement features a fireplace and full bathroom, providing flexible space for a second living area, recreation room, or guest retreat. Enjoy a great location close to Trilith with convenient access to all of Peachtree City's Golf Cart Paths.
Key facts
- 1.3 acre lot
- Garage
- Built 1996
Neighborhood map
What this means for you Summary
Snapshot
- This is a 4-bed/5.0-bath single-family listed at $280k.
Deal economics
- At list price, monthly cash flow is $356 ($4k/yr) — positive.
- The deal already cash-flows at list — no discount required.
- Meets the 1% rule at list price ($3k rent vs $280k).
- Cap rate 7.8% vs local median 3.1% in Peachtree City — top-decile yield for the area; either an underpriced asset or a hidden risk that comps aren't pricing in. Stress-test before assuming the spread holds.
Location & tenants
- Location reads 74/100 on livability (#34 in GA, #4,385 nationally) — a middle-class / working-renter tenant base. Strengths: crime A+, employment A+, housing A+; Watch: amenities F, commute F, cost of living F.
- Fayette County (suburban): math 52% / reading 60% proficiency, ranked #7 of 174 in GA (top 4%) — acceptable for families but not a draw, mixed tenant base, ~2y average lease.
- Zoned schools: Cleveland Elementary School (math 37% / reading 42%, grade F, #435 of 1,228 statewide, top 37%, 419 students, 45% FRL); Flat Rock Middle School (math 35% / reading 55%, grade D, #103 of 470 statewide, top 23%, 883 students, 46% FRL); Sandy Creek High School (math 23% / reading 42%, grade F, #104 of 424 statewide, top 25%, 1,188 students, 43% FRL) — zoned schools average 45% FRL vs 21% district-wide (24 pts higher); higher-poverty schools than district average — tighter screening recommended.
- Zoned-school proficiency averages 39% at this address vs 56% district-wide (-17 pts) — the specific schools serving this property underperform the Fayette County average; the district grade overstates school quality for this exact location.
- Market conditions: Rents rising fast (+4.3%/yr); 372 active listings in the ZIP; 1 comparable units currently listed for rent nearby; solid renter incomes; 323 units permitted in Fayette County in 2024 (0 in 5+ unit buildings).
- This rent runs 42% of the median local income ($90k/yr) — at the standard rent-burdened threshold; future hikes will face affordability resistance.
Forward outlook
- Local home prices are declining (-3.0%/yr); year-one equity from $2k of loan paydown is wiped out by about $8k of value loss. Plan a longer hold.
- Fayette County population projected at +13% by 2050 — modest demand growth; plan on rents tracking national, not racing it.
Negotiation context
- Only 0 days on market — expect competitive offers; lowballing is unlikely to land.
Risks & watch-outs
- Climate carrying-cost: major wind risk, 27% chance of damaging wind over 30y; extreme-heat days projected 7→18/yr by 2055 (HVAC capex compounding) — expect insurance premiums to compound above CPI over the hold.
Questions for the listing agent
- Is there a deadline driving the sale (1031 exchange, divorce, estate, relocation)? That informs how much negotiation room exists.
- Schools are A-rated — typically a magnet for longer-tenancy family renters. What's the average tenant stay here, and is there a school-zone premium baked into asking?
- What's the average days-on-market for RENTAL listings here right now (not sales)? A rising rental-DOM trend means longer vacancies and softer asking-rent achievability than the comps imply.
- What's the recent tenant-quality profile in this submarket — average credit score on applications, eviction rate, late-payment / NSF rate, and stable-employment percentage? A property-management company in the area should have these aggregated.
- How much new for-sale + rental construction is in the pipeline within 1–3 miles? Heavy new supply typically softens prices + rents 12–24 months out; constrained supply supports both.
Investment metrics
- 1% rule
- 1.12% ✓
- Cap rate
- 7.82%
- Cash-on-cash
- 5.45%
- DSCR
- 1.24
- GRM
- 7.4
CMA / ARV
- ARV (on-the-fly)
- $502,992
- Comps found
- 5
Show comp detail 5 sales within ~0.75 mi
| Address | Dist | Beds/Ba | Sqft | Sold | Price | $/sf | Match |
|---|---|---|---|---|---|---|---|
| 145 Old Plantation Way | 0.19mi | 5/3.0 (+1) | 3,005 (+0%) | 0mo | $600,000 | $200 | 77 |
| 100 Aspen Way | 0.38mi | 3/3.0 (-1) | 3,118 (+4%) | 12mo | $525,000 | $168 | 52 |
| 105 Old Plantation Way | 0.22mi | 4/2.5 | 3,187 (+6%) | 20mo | $514,000 | $161 | 52 |
| 410 Cedar Ln | 0.52mi | 3/2.5 (-1) | 2,798 (-6%) | 15mo | $580,000 | $207 | 38 |
| 1015 Brittany Way | 0.47mi | 3/2.0 (-1) | 2,594 (-13%) | 23mo | $369,000 | $142 | 20 |
Match score weights: distance 35% · size 25% · config 20% · recency 20%. Top-matched comps best support the ARV.
Projected returns pro-forma
-3.0% appreciation · 4.29% rent growth · sell at horizon
- IRR
- -6.2%
- Equity multiple
- 0.77×
- Total profit
- $-18,388
- Equity at exit
- $41,749
- IRR
- 5.1%
- Equity multiple
- 1.40×
- Total profit
- $31,255
- Equity at exit
- $24,209
Cash invested: $78,400 (down + closing). Projections, not guarantees.
Landlord ↔ Tenant lean methodology
- Overall (STATE)
- 90 Strongly Landlord-Friendly
- State Georgia
- 90 Strongly Landlord-Friendly · R+3
- County
- — inherits STATE
- City
- — inherits STATE
ZIP-level market 30214
- Rents YoY
- 4.3%
- Active inventory
- 372
- Price-to-rent
- 7.4×
Monthly cashflow live
- Estimated rent
- $3,139 medium interval (Pro) →
- Mortgage (P&I)
- −$1,468
- Tax from tax record
- −$538 /mo · $6,458/yr
- Insurance
- −$117
- HOA
- −$0
- Vacancy / Maint / Mgmt
- −$659
- Net cashflow
- $356
Break-even live
UW: 25.0% down · 7.5% · 30yr · 1.5% tax · 5.0% vac · 8.0% maint · 8.0% mgmt
Financing live
Cash to close
- Down payment
- $70,000
- Closing costs
- $8,400
- Reserves months
- —
- Total cash needed
- —
Loan-product check · same deal, 3 products live
Conventional
25% down · 7.5% · 30yr
- Down + closing
- —
- Monthly P&I
- —
- Monthly cashflow
- —
- DSCR
- —
- Eligible?
- —
Personal DTI + credit; lowest rate.
DSCR
20% down · 8.5% · 30yr
- Down + closing
- —
- Monthly P&I
- —
- Monthly cashflow
- —
- DSCR
- —
- Eligible?
- —
No personal income docs; deal must DSCR.
Hard money
10% down · 12.0% · 12mo
- Down + closing
- —
- Monthly P&I
- —
- Monthly cashflow
- —
- DSCR
- —
- Eligible?
- —
Short-term bridge; refi at stabilization.
Rent comps 1 comps
| Address | Beds | Baths | Sqft | Rent | $/sqft | DOM | Units | Dist |
|---|---|---|---|---|---|---|---|---|
| 202 Regester Way Peachtree City, GA | 5.0 | 3.5 | 2722 | $4,950 | $1.82 | 18d | 1 | 1.26mi |
Listing history 4 events
-
2026-05-28historical
-
2026-05-13$280,000
-
2002-06-05soldstatus $304,500
-
1996-12-18soldstatus $238,000
ⓘ Source: listings_history table (triggers on properties + properties_extension) + one-shot
backfill from property_details.listing_events for pre-trigger history.
Tax reassessment forecast GA · Resets to sale price
- Current annual tax
- $6,458 · $538/mo
- Projected year-2 tax
- $6,458 · $538/mo
- Expected delta
- $0/yr ($0/mo · 0.0%)
ⓘ Screening estimate from a state-policy table — verify with the county assessor before closing.
Climate risk First Street
- Flood 1/10 Low FEMA zone X (unshaded) · 0% chance over 30 yrs
- Wildfire 4/10 Moderate
- Heat 5/10 Major 7 d/yr ≥104°F today · 18 d/yr by 30 yrs out
- Wind 6/10 Major 27% chance of damaging wind over 30 yrs
- Air quality 3/10 Moderate 4 unhealthy d/yr today · 4 by 30 yrs out
Nearby sold comps map
Loading sold comps map…
Walkable amenities ~0.75 mi
Loading nearby amenities…
Taxation est. · year 1
- Rental income
- $37,663
- − Mortgage interest
- −$15,684
- − Property taxes
- −$6,458
- − Insurance
- −$1,400
- − Repairs & maintenance
- −$3,013
- − Management
- −$3,013
- − Depreciation
- −$8,145
- Taxable loss
- −$50
- Est. tax savings @ 24.0%
- +$12
- After-tax cash flow
- $4,288/yr
For passive investors: Depreciation is non-cash, so a rental often shows a tax loss while cash-flowing — sheltering income. Rental losses are passive: they offset passive income freely, and up to $25,000/yr can offset ordinary (W-2) income if you actively participate and your MAGI is under $100k (phasing out to $0 by $150k); unused losses carry forward. On sale, claimed depreciation is recaptured at up to 25%, and gains may owe capital-gains tax (a 1031 exchange can defer both). Figures are a year-1 estimate at your 24.0% rate — not tax advice; consult a CPA.
Schools (NCES district)
- District
- Fayette County
- NCES district ID
- 1302130
- Math proficiency
- 52% ▼ -12.00%
- Reading proficiency
- 60% ▼ -7.00%
- Median HH income
- $80,746
- Composite
- 50.67/100
- National rank
- #1824
- State rank
- #7 of 174 in GA
Livability — Peachtree City
- Score
- 74/100
- State rank
- #34
- US rank
- #4385
Category grades
Schools grade is shown separately in the Schools card above.
Census & demographics
- County
- Fayette County · 112,821 people
- City population
- 40,534
- Metro
- Atlanta-Sandy Springs-Alpharetta, GA
- Population (ZIP)
- 31,811
- Household income
- $89,912
- Rent vs Own
- Severe rent burden
- 634.0
Population outlook (Fayette County) Hauer SSP2
- Today (2025)
- 120,914 people
- By 2030
- 125,439 · +3.7%
- By 2040
- 132,378 · +9.5%
- By 2050
- 137,123 · +13.4%
- By 2075
- 156,091 · +29.1%
- By 2100
- 163,102 · +34.9%
Race, ethnicity, and origin ACS 2023
- Neighborhood character
- Diverse neighborhood (Simpson 0.62)
- Race & ethnicity
- Black 51% White 33% Hispanic / Latino 9% Two or more races 5% Asian 3%
- Hispanic origin (detail)
- Mexican 6% Puerto Rican 1%
- Common ancestry
- Italian 2% Slovak 1% Serbian 1%
- Foreign-born
- 10% · Canada, Vietnam
- Languages at home
- 85% English-only · Spanish 8% Other Asian/Pacific 1% French/Haitian/Cajun 1%
Political lean MEDSL · Fayette
- 2024 margin
- Toss-up / Even · D 48.0% · R 51.1%
- 2008→2024 swing
- +27.5pp toward D · 2008: -30.7pp · 2024: -3.1pp
- All cycles
- 2024: R+3.1 2020: R+6.8 2016: R+19.5 2012: R+31.4 2008: R+30.7
Not yet ingested
- Civics
- —
Market trends
- HPI YoY
- ▼ -142.65%
- Current HPI
- 243.9416
- Rent YoY
- ▲ 4.29%
- Metro
- Atlanta-Sandy Springs-Alpharetta, GA
- State GDP YoY
- ▲ 2.66%
- F500 in state
- 28
Industry mix (Fortune 500 HQ in GA)
| Industry | F500 HQs | Revenue |
|---|---|---|
| Paper / Packaging | 2 | $29B |
|
||
| Retail | 1 | $160B |
|
||
| Transportation / Logistics | 1 | $91B |
|
||
| Airlines | 1 | $62B |
|
||
| Consumer Goods | 1 | $47B |
|
||
| Utilities | 1 | $25B |
|
||
Price history
+17.6% since first listed4 events — show timeline
- 2026-05-28 Listing Removed — GAMLS
- 2026-05-13 Listed $280,000 GAMLS
- 2002-06-05 Sold (Public Records) $304,500 Public Records
- 1996-12-18 Sold (Public Records) $238,000 Public Records
Property tax history
+2.1%/yrLatest (2025): $6,458 · +7.9% YoY. Source: county tax records.
Cash-flow waterfall
monthlySold comps — $/sqft
last 12 mo · ≤1 miLoading sold comps…