 🌊 Lakefront
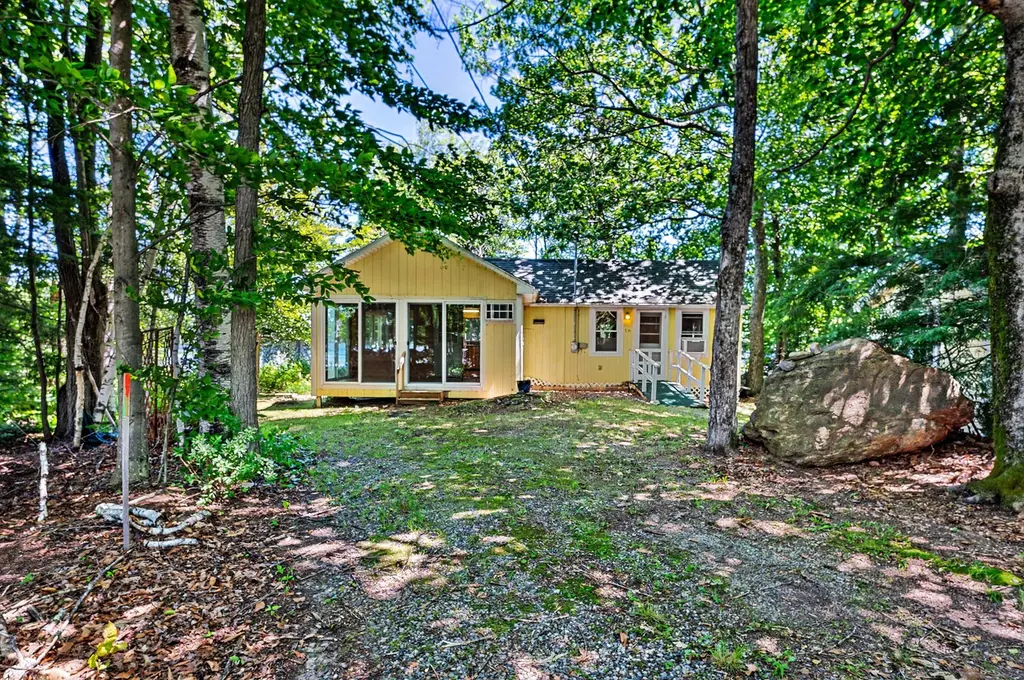
16 Maple Ridge Rd · Winthrop, ME
Flood risk 7/10 · Major
- FEMA flood zone
- X (unshaded)
- Chance of flooding over 30 yrs
- 0.99%
- Est. flood insurance / yr
- $507 – $1,088
Fire risk 2/10 · Minimal
- Est. fire insurance / yr
- $669 – $1,243
Heat risk 3/10 · Minor
- Hot days now (above 91°F)
- 7 days/yr
- Hot days in 30 yrs
- 16 days/yr
Wind risk 4/10 · Minor
- Chance of severe wind over 30 yrs
- 17.0%
Air-quality risk 2/10 · Minimal
- Unhealthy air days now
- 1 days/yr
- Unhealthy air days in 30 yrs
- 1 days/yr
Risk factors via First Street. Map © Google.
Why this score? — see what drove the D grade
The composite is a weighted blend of 9 inputs, each scored 0–100. Each bar is that input's sub-score; the figure is the points it added to the 100-point composite (weight × sub-score).
- ARV discount +15.0/15.0
- Appreciation +10.0/10.0
- Schools +7.2/10.0
- Livability +3.5/5.0
- Rent growth +2.5/5.0
- Condition / age +2.5/5.0
- Cash flow +0.0/30.0
- 1% rule +0.0/10.0
- DSCR +0.0/10.0
$339,000
🖨 Deal sheet 📄 Offer letter ✓ Due diligence
Listing remarks
Three season camp on Cobbossee Lake with 245 feet of waterfront on a private peninsula offering a rare opportunity in a truly special setting. Tucked away with exceptional privacy, this property features expansive waterfront, beautiful sunrise and sunset views, and frequent visits from ducks, loons, geese, and herons. The natural surroundings and location are what make this property so unique. Inside, the camp offers an open layout with cathedral ceilings, warm pine interior, an enclosed porch close to the water, a bonus room for flexible space, and two sheds for storage. The property will benefit from updates and improvements and is best suited for a buyer looking to bring new life to a cl
Key facts
- 0.52 acre lot
- Parking
- Built 1963
Property features AI
Finance
- HOA & community: Association with an annual fee of $400; Pets allowed with no restrictions
Exterior
- Parking: On-site parking on gravel for 1–4 vehicles
- Utilities: Private water supply; Septic system (design available) and holding tank; Electric circuit breakers; Electric water heater
- Home design: Single family residence; Built in 1963
- Construction: Wood frame construction with wood siding; Shingle roof; Built 1963
- Exterior features: Lake frontage and lake view (Cobbossee Lake); Near town; Right of way access; Wooded lot; Shed(s) on the property; Private road frontage; Gravel road surface
Interior
- Kitchen: Kitchen on the first floor
- Bedrooms: Two bedrooms (both on the first floor)
- Flooring: Laminate flooring
- Bathrooms: One full bathroom
- Heating & cooling: Direct vent heater
- Interior features: Six total rooms; Sunroom; Family room
Neighborhood map
What this means for you Summary
Snapshot
- This is a 1-bed/1.0-bath other listed at $339k.
Deal economics
- At list price, monthly cash flow is $-2k ($-20k/yr) — negative.
- To cash-flow at today's rent, offer at most $86k (74.7% below list).
- To meet the 1% rule (rent ≥ 1% of price), the offer needs to be $95k (72.0% below list).
- Recommended offer: $86k (74.7% below list) — sets the bar for cash-flow.
- Cap rate 0.8% vs local median 2.0% in Winthrop — below-typical yield; the buyer is paying a premium for something (appreciation thesis, condition, location) that the cap rate doesn't capture.
Location & tenants
- Location reads 69/100 on livability (#76 in ME) — a middle-class / working-renter tenant base. Strengths: crime A+, cost of living A, housing A; Watch: health & safety C-, employment D, amenities F.
- RSU 02 (rural): math 83% / reading 87% proficiency, ranked #52 of 112 in ME (top 46%) — strong family-tenant draw, lease renewals of 3-5y typical.
- Market conditions: 19 active listings in the ZIP; 460 units permitted in Kennebec County in 2024 (0 in 5+ unit buildings).
Forward outlook
- In year one you build about $36k of equity ($2k loan paydown + $34k appreciation (10.0% local appreciation)).
- Kennebec County population projected at -17% by 2050 — secular population decline; favor cash flow + early exit over multi-decade hold.
- By year 2, paydown + projected appreciation supports a ~$58k cash-out refi (75% LTV) — recoverable capital for the next deal without selling this one.
Negotiation context
- Only 5 days on market — expect competitive offers; lowballing is unlikely to land.
- 6 sale attempts since 21y ago with the ask held roughly flat each time — persistent listings suggest the price (not the market) is what's stuck; bring a comps-based counter.
Risks & watch-outs
- Watch-outs: flood insurance adds $66/mo.
- Climate carrying-cost: major flood risk — expect insurance premiums to compound above CPI over the hold.
Questions for the listing agent
- What do current leases actually rent for vs. the listed asking? Can we see a recent rent roll and the last 12 months of T-12 income?
- Built in 1963 — when were the roof, HVAC, electrical panel, plumbing, and water heater last replaced?
- What's the actual annual flood-insurance premium (NFIP or private), and is the property in a SFHA with mandatory coverage?
- What does the HOA fee cover, when was the last increase, and are there any pending special assessments or reserve-fund shortfalls?
- Is there a deadline driving the sale (1031 exchange, divorce, estate, relocation)? That informs how much negotiation room exists.
- The area grade is low — what's the realistic commute time and amenity access for the typical tenant pool here? Any planned neighborhood developments (good or bad) we should know about?
- This sits on a lake — are riparian / water-frontage rights deeded with the parcel? Any dock permits, shoreline easements, or HOA water-use restrictions?
- What's the documented flood / surge / shoreline-erosion history here (FEMA AND non-FEMA — e.g., storm surge, creek backup, septic-field saturation)?
- Any water-quality or seasonal algae-bloom issues that affect tenant satisfaction or short-term-rental demand?
- What's the average days-on-market for RENTAL listings here right now (not sales)? A rising rental-DOM trend means longer vacancies and softer asking-rent achievability than the comps imply.
- What's the recent tenant-quality profile in this submarket — average credit score on applications, eviction rate, late-payment / NSF rate, and stable-employment percentage? A property-management company in the area should have these aggregated.
- How much new for-sale + rental construction is in the pipeline within 1–3 miles? Heavy new supply typically softens prices + rents 12–24 months out; constrained supply supports both.
Investment metrics
- 1% rule
- 0.28% ✗
- Cap rate
- 0.77%
- Cash-on-cash
- -19.72%
- DSCR
- 0.12
- GRM
- 29.8
CMA / ARV
- ARV (median comp)
- $582,029
- List price
- $339,000
- Delta
- -41.76%
- Verdict
- UNDERPRICED
- Comps
- 5 within 1.0 mi
Projected returns pro-forma
10.0% appreciation · 3.0% rent growth · sell at horizon
- IRR
- 10.2%
- Equity multiple
- 1.85×
- Total profit
- $81,086
- Equity at exit
- $305,398
- IRR
- 11.4%
- Equity multiple
- 4.37×
- Total profit
- $320,306
- Equity at exit
- $658,602
Cash invested: $94,920 (down + closing). Projections, not guarantees.
Landlord ↔ Tenant lean methodology
- Overall (STATE)
- 41 Moderately Tenant-Leaning
- State Maine
- 41 Moderately Tenant-Leaning · D+2
- County
- — inherits STATE
- City
- — inherits STATE
ZIP-level market 04259
- Home prices YoY
- 5.7%
- Active inventory
- 19
- Price-to-rent
- 29.8×
Monthly cashflow live
- Estimated rent
- $950 medium interval (Pro) →
- Mortgage (P&I)
- −$1,778
- Tax from tax record
- −$358 /mo · $4,295/yr
- Insurance
- −$141
- Flood insurance flood zone
- −$66 /mo · $798/yr
- HOA
- −$33
- Vacancy / Maint / Mgmt
- −$199
- Net cashflow
- $-1,626
Break-even live
UW: 25.0% down · 7.5% · 30yr · 1.5% tax · 5.0% vac · 8.0% maint · 8.0% mgmt
Financing live
Cash to close
- Down payment
- $84,750
- Closing costs
- $10,170
- Reserves months
- —
- Total cash needed
- —
Loan-product check · same deal, 3 products live
Conventional
25% down · 7.5% · 30yr
- Down + closing
- —
- Monthly P&I
- —
- Monthly cashflow
- —
- DSCR
- —
- Eligible?
- —
Personal DTI + credit; lowest rate.
DSCR
20% down · 8.5% · 30yr
- Down + closing
- —
- Monthly P&I
- —
- Monthly cashflow
- —
- DSCR
- —
- Eligible?
- —
No personal income docs; deal must DSCR.
Hard money
10% down · 12.0% · 12mo
- Down + closing
- —
- Monthly P&I
- —
- Monthly cashflow
- —
- DSCR
- —
- Eligible?
- —
Short-term bridge; refi at stabilization.
HOA detail
- Monthly dues
- $33 · $396/yr
- Likely covers
- water
Listing history 7 events
-
2026-05-17status Pending 1110-char remark
-
2026-05-15status Active 1110-char remark
-
2026-05-14status Pending 1110-char remark
-
2026-05-13status Active 1110-char remark
-
2026-05-11status Pending 1110-char remark
-
2026-05-07$339,000 Active 1110-char remark
-
2024-07-05price $399,000
ⓘ Source: listings_history table (triggers on properties + properties_extension) + one-shot
backfill from property_details.listing_events for pre-trigger history.
Tax reassessment forecast ME · Partial reset (capped growth)
- Current annual tax
- $4,295 · $358/mo
- Projected year-2 tax
- $4,453 · $371/mo
- Expected delta
- +$158/yr (+$13/mo · 3.7%)
ⓘ Screening estimate from a state-policy table — verify with the county assessor before closing.
Climate risk First Street
- Flood 7/10 Severe FEMA zone X (unshaded) · 99% chance over 30 yrs
- Wildfire 2/10 Low
- Heat 3/10 Moderate 7 d/yr ≥91°F today · 16 d/yr by 30 yrs out
- Wind 4/10 Moderate 17% chance of damaging wind over 30 yrs
- Air quality 2/10 Low 1 unhealthy d/yr today · 1 by 30 yrs out
Nearby sold comps map
Loading sold comps map…
Walkable amenities ~0.75 mi
Loading nearby amenities…
Taxation est. · year 1
- Rental income
- $11,394
- − Mortgage interest
- −$18,989
- − Property taxes
- −$4,295
- − Insurance
- −$2,492
- − Repairs & maintenance
- −$912
- − Management
- −$912
- − HOA
- −$396
- − Depreciation
- −$9,862
- Taxable loss
- −$26,464
- Est. tax savings @ 24.0%
- +$6,351
- After-tax cash flow
- $-13,164/yr
For passive investors: Depreciation is non-cash, so a rental often shows a tax loss while cash-flowing — sheltering income. Rental losses are passive: they offset passive income freely, and up to $25,000/yr can offset ordinary (W-2) income if you actively participate and your MAGI is under $100k (phasing out to $0 by $150k); unused losses carry forward. On sale, claimed depreciation is recaptured at up to 25%, and gains may owe capital-gains tax (a 1031 exchange can defer both). Figures are a year-1 estimate at your 24.0% rate — not tax advice; consult a CPA.
Schools (NCES district)
- District
- RSU 02
- NCES district ID
- 2314776
- Math proficiency
- 83% ▲ 56.00%
- Reading proficiency
- 87% ▲ 34.00%
- Median HH income
- $52,565
- Composite
- 72.04/100
- National rank
- #208
- State rank
- #52 of 112 in ME
Livability — Winthrop
- Score
- 69/100
- State rank
- #76
- US rank
- #8395
Category grades
Schools grade is shown separately in the Schools card above.
Census & demographics
- City population
- 6,153
- Population (ZIP)
- 3,493
Population outlook (Kennebec County) Hauer SSP2
- Today (2025)
- 115,421 people
- By 2030
- 111,852 · -3.1%
- By 2040
- 103,757 · -10.1%
- By 2050
- 95,710 · -17.1%
- By 2075
- 78,172 · -32.3%
- By 2100
- 59,500 · -48.4%
Race, ethnicity, and origin ACS 2023
- Neighborhood character
- Predominantly White (94%)
- Race & ethnicity
- White 94% Two or more races 5% Hispanic / Latino 2%
- Common ancestry
- Lithuanian 23% Iranian 7% Slovak 4%
- Foreign-born
- 2% · Canada
- Languages at home
- 97% English-only · French/Haitian/Cajun 2% Spanish 1% German/W. Germanic 1%
Political lean MEDSL · Kennebec
- 2024 margin
- Toss-up / Even · D 47.5% · R 50.2% · Other 2.4%
- 2008→2024 swing
- -17.5pp toward R · 2008: 14.8pp · 2024: -2.8pp
- All cycles
- 2024: R+2.8 2020: D+0.2 2016: R+3.7 2012: D+13.5 2008: D+14.8
Not yet ingested
- Civics
- —
Market trends
- HPI YoY
- ▲ 21.99%
- Current HPI
- 408.6401
- Rent YoY
- —
- Metro
- —
- State GDP YoY
- —
- F500 in state
- 0
Price history
+88.4% since first listed12 events — show timeline
- 2026-05-17 Pending — MREIS
- 2026-05-15 Relisted — MREIS
- 2026-05-14 Pending — MREIS
- 2026-05-13 Relisted — MREIS
- 2026-05-11 Pending — MREIS
- 2026-05-07 Listed $339,000 MREIS
- 2025-12-05 Delisted — MREIS
- 2025-06-10 Listed $399,000 MREIS
- 2024-08-05 Delisted — MREIS
- 2024-07-05 Price Changed $399,000 MREIS
- 2024-06-29 Listed $449,000 MREIS
- 2005-07-27 Listed $179,900 MREIS
Property tax history
+7.8%/yrLatest (2024): $4,295 · +13.0% YoY. Source: county tax records.
Cash-flow waterfall
monthlySold comps — $/sqft
last 12 mo · ≤1 miLoading sold comps…