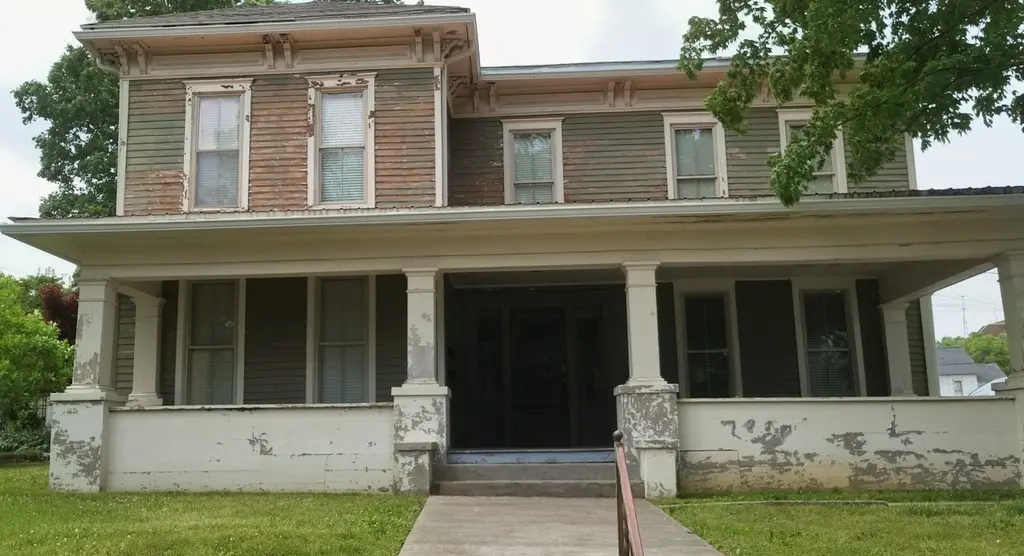
 Fourplex
1903 S Main St · Hopkinsville, KY
Flood risk 1/10 · Minimal
- FEMA flood zone
- X (unshaded)
- Chance of flooding over 30 yrs
- 0.0%
- Est. flood insurance / yr
- $507 – $1,088
Fire risk 1/10 · Minimal
- Est. fire insurance / yr
- $839 – $1,559
Heat risk 5/10 · Moderate
- Hot days now (above 108°F)
- 7 days/yr
- Hot days in 30 yrs
- 20 days/yr
Wind risk 3/10 · Minor
- Chance of severe wind over 30 yrs
- 8.0%
Air-quality risk 2/10 · Minimal
- Unhealthy air days now
- 0 days/yr
- Unhealthy air days in 30 yrs
- 1 days/yr
Risk factors via First Street. Map © Google.
Why this score? — see what drove the C- grade
The composite is a weighted blend of 9 inputs, each scored 0–100. Each bar is that input's sub-score; the figure is the points it added to the 100-point composite (weight × sub-score).
- Cash flow +26.9/30.0
- DSCR +9.3/10.0
- 1% rule +6.2/10.0
- Rent growth +4.2/5.0
- Livability +3.2/5.0
- Schools +2.7/10.0
- Condition / age +2.5/5.0
- ARV discount +0.0/15.0
- Appreciation +0.0/10.0
$319,000
🖨 Deal sheet 📄 Offer letter ✓ Due diligence
Multi-family units
County records classify this as Multi-Family (5+ Unit). Listing-text estimate: 4 units. estimate disagrees with records
5+ unit building — per-unit beds/baths from public records are typically unavailable; the breakdown below (if shown) is an estimate from the listing text.
Listing remarks MLS
Located in the heart of the historic district, this unique quadruplex offers charm, character, and strong investment potential. Each of the four units features a one bedroom, one bath layout, making it an ideal setup for consistent rental demand. The property showcases timeless curb appeal with a large inviting front porch, perfect for relaxing and enjoying the surrounding mature trees that provide both shade and a peaceful setting. Inside, residents benefit from a shared laundry facility, adding convenience and functionality. A distinctive upstairs common area creates an added sense of community and flexible shared space for tenants. With its classic architectural details, desirable location, and thoughtfully designed layout, this property stands out from typical multi family options. Whether you are looking to expand your portfolio or own a piece of historic charm with income producing potential, this quadruplex is a rare opportunity you will not want to miss.
Key facts
- 8,640 sq ft lot
- Built 1908
- Listed 50 days
Property features AI
Finance
- Other: Zoning: R-4
- Financial info: Gross income reported as $76,000; Net operating income reported as $76,000; Tenant pays: none
Exterior
- Parking: No designated covered parking reported; No total parking spaces reported
- Utilities: Public water; Public sewer; Water available
- Home design: Residential income property; Attached duplex-style structure; One level
- Construction: Wood siding exterior; Historic building
- Exterior features: Public water available; Public sewer
Interior
- Bedrooms: Four 1-bedroom units
- Flooring: Wood
- Bathrooms: Each unit has 1 bathroom
- Heating & cooling: Central heating; Central air
- Interior features: Wood flooring; Central heating; Central air conditioning
- Laundry & utility: Shared laundry with electric dryer hookup; Owner pays electricity
Neighborhood map
What this means for you Summary
Snapshot
- This is a 4 × 1-bed/1-bath units multifamily listed at $319k.
Deal economics
- At list price, monthly cash flow is $886 ($11k/yr) — positive. Per door: $222/mo.
- The deal already cash-flows at list — no discount required.
- Meets the 1% rule at list price ($4k rent vs $319k).
- Recommended offer: $309k (3.0% below list) — sets the bar for market timing.
- Cap rate 9.6% vs local median 4.3% in Hopkinsville — top-decile yield for the area; either an underpriced asset or a hidden risk that comps aren't pricing in. Stress-test before assuming the spread holds.
Location & tenants
- Location reads 64/100 on livability (#305 in KY) — a middle-class / working-renter tenant base. Strengths: cost of living A+, housing A, health & safety B+; Watch: crime F, amenities F, commute F.
- Christian County (town): math 30% / reading 34% proficiency, ranked #93 of 165 in KY (top 56%) — families likely to look elsewhere, expect single-tenant / working-renter base with shorter leases; 61% free/reduced lunch — lower-income household profile, screen leases tightly.
- Zoned schools: Indian Hills Elementary School (math 39% / reading 38%, grade F, #234 of 676 statewide, top 36%, 582 students, 71% FRL); Christian County High School (math 20% / reading 36%, grade F, #151 of 254 statewide, top 61%, 1,187 students, 67% FRL).
- Market conditions: Rents rising fast (+6.6%/yr); 252 active listings in the ZIP; 193 units permitted in Christian County in 2024 (66 in 5+ unit buildings).
- At $3,560/mo this rent would consume 83% of the median local household income ($52k/yr) (locally 1475% of renters already pay >50% of income on rent) — very limited rent-growth headroom before tenants either downsize or default.
Forward outlook
- Local home prices are declining (-3.0%/yr); year-one equity from $2k of loan paydown is wiped out by about $10k of value loss. Plan a longer hold.
- Christian County population projected at -20% by 2050 — secular population decline; favor cash flow + early exit over multi-decade hold.
- At projected returns (-3.0% appreciation + 6.6% rent growth), your $89k cash investment doubles in ~8 years — after that, you're playing with house money.
Negotiation context
- It's been on market 50 days — a 3% lower offer ($309k) is reasonable based on typical stale-listing flexibility.
- 2 sale attempts; this cycle's ask has dropped $21k (6%) from the opening price — seller is motivated, your offer sets the floor, not the list.
Risks & watch-outs
- Watch-outs: built in 1908 — expect roof / HVAC / electrical / plumbing capex.
- Climate carrying-cost: extreme-heat days projected 7→20/yr by 2055 (HVAC capex compounding) — expect insurance premiums to compound above CPI over the hold.
Questions for the listing agent
- It's been on market 50 days. Have you received any prior offers? Is the seller open to a 3% concession, seller financing, or rate buy-down credit?
- Can we see the unit-by-unit rent roll, current vacancy, and any below-market leases? What's the average tenancy length?
- What capital expenditures (roof, boiler, parking lot, exteriors) have been made in the last 5 years, and what's planned in the next 2?
- Built in 1908 — when were the roof, HVAC, electrical panel, plumbing, and water heater last replaced?
- Is there a deadline driving the sale (1031 exchange, divorce, estate, relocation)? That informs how much negotiation room exists.
- Schools are D-rated, which usually means shorter tenancies and higher turnover. Who's the typical renter profile here, and what's been the actual vacancy rate?
- Crime grade is F in this area — have there been break-ins, vandalism, or insurance claims at this property in the last 3 years? What carrier currently insures it and at what premium?
- What's the average days-on-market for RENTAL listings here right now (not sales)? A rising rental-DOM trend means longer vacancies and softer asking-rent achievability than the comps imply.
- What's the recent tenant-quality profile in this submarket — average credit score on applications, eviction rate, late-payment / NSF rate, and stable-employment percentage? A property-management company in the area should have these aggregated.
- How much new apartment / multifamily construction is in the pipeline within 1–3 miles? Heavy new supply (>2% of stock underway) typically softens rents 12–24 months out; light construction supports rent growth.
Investment metrics
- 1% rule
- 1.12% ✓
- Cap rate
- 9.63%
- Cash-on-cash
- 11.91%
- DSCR
- 1.53
- GRM
- 7.5
CMA / ARV
- ARV (median comp)
- $220,196
- List price
- $319,000
- Delta
- 44.87%
- Verdict
- OVERPRICED
- Comps
- 6 within 1.0 mi
Projected returns pro-forma
-3.0% appreciation · 6.61% rent growth · sell at horizon
- IRR
- 5.0%
- Equity multiple
- 1.20×
- Total profit
- $18,037
- Equity at exit
- $47,564
- IRR
- 17.3%
- Equity multiple
- 2.65×
- Total profit
- $147,142
- Equity at exit
- $27,581
Cash invested: $89,320 (down + closing). Projections, not guarantees.
Landlord ↔ Tenant lean methodology
- Overall (STATE)
- 83 Strongly Landlord-Friendly
- State Kentucky
- 83 Strongly Landlord-Friendly · R+16
- County
- — inherits STATE
- City
- — inherits STATE
ZIP-level market 42240
- Home prices YoY
- -17.5%
- Rents YoY
- 6.6%
- Active inventory
- 252
- Price-to-rent
- 29.9×
Monthly cashflow live
- Estimated rent
- $3,560 high interval (Pro) →
- Mortgage (P&I)
- −$1,673
- Tax from tax record
- −$120 /mo · $1,444/yr
- Insurance
- −$133
- HOA
- −$0
- Vacancy / Maint / Mgmt
- −$748
- Net cashflow
- $886
Break-even live
4-unit breakdown (identical units grouped — click to expand)
| Units | Beds | Baths | Est. rent |
|---|---|---|---|
| 4× units | 1 | 1 | $3,560 |
| #1 | 1 | 1 | $890 |
| #2 | 1 | 1 | $890 |
| #3 | 1 | 1 | $890 |
| #4 | 1 | 1 | $890 |
| Total (4 units) | $3,560 | ||
UW: 25.0% down · 7.5% · 30yr · 1.5% tax · 5.0% vac · 8.0% maint · 8.0% mgmt
Financing live
Cash to close
- Down payment
- $79,750
- Closing costs
- $9,570
- Reserves months
- —
- Total cash needed
- —
Loan-product check · same deal, 3 products live
Conventional
25% down · 7.5% · 30yr
- Down + closing
- —
- Monthly P&I
- —
- Monthly cashflow
- —
- DSCR
- —
- Eligible?
- —
Personal DTI + credit; lowest rate.
DSCR
20% down · 8.5% · 30yr
- Down + closing
- —
- Monthly P&I
- —
- Monthly cashflow
- —
- DSCR
- —
- Eligible?
- —
No personal income docs; deal must DSCR.
Hard money
10% down · 12.0% · 12mo
- Down + closing
- —
- Monthly P&I
- —
- Monthly cashflow
- —
- DSCR
- —
- Eligible?
- —
Short-term bridge; refi at stabilization.
Listing history 15 events
-
2026-06-18days on market $319,000 Active 50 DOM
-
2026-06-17days on market $319,000 Active 49 DOM
-
2026-06-16days on market $319,000 Active 48 DOM
-
2026-06-15days on market $319,000 Active 47 DOM
-
2026-06-14days on market $319,000 Active 45 DOM
-
2026-06-13days on market $319,000 Active 44 DOM
-
2026-06-10days on market $319,000 Active 42 DOM
-
2026-06-09days on market $319,000 Active 41 DOM
-
2026-06-08days on market $319,000 Active 40 DOM
-
2026-06-07pricedays on market $319,000 Active 39 DOM
-
2026-06-02days on market $339,900 Active 34 DOM
-
2026-06-01days on market $339,900 Active 33 DOM
-
2026-05-31days on market $339,900 Active 32 DOM
-
2026-05-30days on market $339,900 Active 31 DOM
-
2026-04-29$339,900 Active 976-char remark
ⓘ Source: listings_history table (triggers on properties + properties_extension) + one-shot
backfill from property_details.listing_events for pre-trigger history.
Tax reassessment forecast KY · Resets to sale price
- Current annual tax
- $1,444 · $120/mo
- Projected year-2 tax
- $2,743 · $229/mo
- Expected delta
- +$1,299/yr (+$108/mo · 90.0%)
ⓘ Screening estimate from a state-policy table — verify with the county assessor before closing.
Climate risk First Street
- Flood 1/10 Low FEMA zone X (unshaded) · 0% chance over 30 yrs
- Wildfire 1/10 Low
- Heat 5/10 Major 7 d/yr ≥108°F today · 20 d/yr by 30 yrs out
- Wind 3/10 Moderate 8% chance of damaging wind over 30 yrs
- Air quality 2/10 Low 0 unhealthy d/yr today · 1 by 30 yrs out
Nearby sold comps map
Loading sold comps map…
Walkable amenities ~0.75 mi
Loading nearby amenities…
Taxation est. · year 1
- Rental income
- $42,720
- − Mortgage interest
- −$17,869
- − Property taxes
- −$1,444
- − Insurance
- −$1,595
- − Repairs & maintenance
- −$3,418
- − Management
- −$3,418
- − Depreciation
- −$9,280
- Taxable income
- $5,697
- Est. tax owed @ 24.0%
- −$1,367
- After-tax cash flow
- $9,268/yr
For passive investors: Depreciation is non-cash, so a rental often shows a tax loss while cash-flowing — sheltering income. Rental losses are passive: they offset passive income freely, and up to $25,000/yr can offset ordinary (W-2) income if you actively participate and your MAGI is under $100k (phasing out to $0 by $150k); unused losses carry forward. On sale, claimed depreciation is recaptured at up to 25%, and gains may owe capital-gains tax (a 1031 exchange can defer both). Figures are a year-1 estimate at your 24.0% rate — not tax advice; consult a CPA.
Schools (NCES district)
- District
- Christian County
- NCES district ID
- 2101150
- Math proficiency
- 30% ▼ -9.00%
- Reading proficiency
- 34% ▼ -10.00%
- Median HH income
- $38,961
- Composite
- 26.8/100
- National rank
- #7118
- State rank
- #93 of 165 in KY
Livability — Hopkinsville
- Score
- 64/100
- State rank
- #305
- US rank
- #14474
Category grades
Schools grade is shown separately in the Schools card above.
Census & demographics
- Census place
- Hopkinsville, KY
- County
- Christian County · 51,080 people
- City population
- 41,415
- Metro
- Clarksville, TN-KY
- Population (ZIP)
- 41,415
- Household income
- $51,534
- Rent vs Own
- Severe rent burden
- 1475.0
Population outlook (Christian County) Hauer SSP2
- Today (2025)
- 67,861 people
- By 2030
- 65,808 · -3.0%
- By 2040
- 60,090 · -11.5%
- By 2050
- 54,561 · -19.6%
- By 2075
- 45,859 · -32.4%
- By 2100
- 38,310 · -43.5%
Race, ethnicity, and origin ACS 2023
- Neighborhood character
- Majority White (65%)
- Race & ethnicity
- White 65% Black 23% Two or more races 7% Hispanic / Latino 4%
- Common ancestry
- Slovak 3% Italian 1% Romanian 1%
- Foreign-born
- 3% · Canada
- Languages at home
- 95% English-only · Spanish 3% German/W. Germanic 1%
Political lean MEDSL · Christian
- 2024 margin
- Solid R (+33.6) · D 32.6% · R 66.1% · Other 1.3%
- 2008→2024 swing
- -12.4pp toward R · 2008: -21.2pp · 2024: -33.6pp
- All cycles
- 2024: R+33.6 2020: R+28.4 2016: R+31.4 2012: R+23.8 2008: R+21.2
Not yet ingested
- Civics
- —
Market trends
- HPI YoY
- ▼ -49.36%
- Current HPI
- 233.3958
- Rent YoY
- ▲ 6.61%
- Metro
- Clarksville, TN-KY
- State GDP YoY
- ▲ 1.81%
- F500 in state
- 4
Industry mix (Fortune 500 HQ in KY)
| Industry | F500 HQs | Revenue |
|---|---|---|
| Healthcare | 1 | $118B |
|
||
| Food / Beverage | 1 | $7B |
|
||
Price history
+0.0% since first listed3 events — show timeline
- 2026-06-05 Price Changed $319,000 REALTRACS as Distributed by MLS Grid
- 2026-04-29 Listed $339,900 REALTRACS as Distributed by MLS Grid
- 2026-04-24 Listed $319,000 ImagineMLS
Property tax history
-0.1%/yrLatest (2025): $1,444 · -4.4% YoY. Source: county tax records.
Cash-flow waterfall
monthlySold comps — $/sqft
last 12 mo · ≤1 miLoading sold comps…