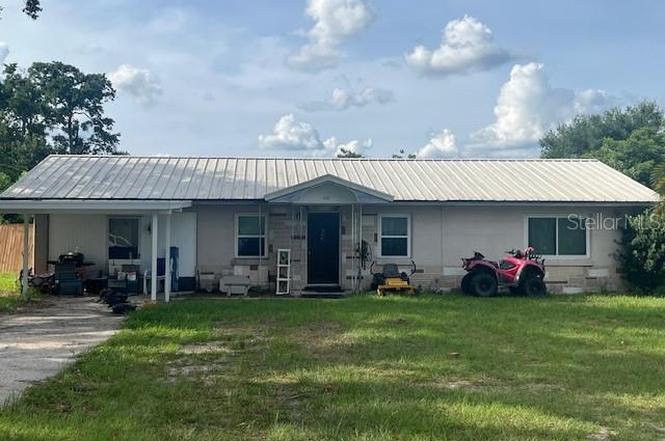
400 E Pomelo St · Lake Alfred, FL
Flood risk 1/10 · Minimal
- FEMA flood zone
- X (unshaded)
- Chance of flooding over 30 yrs
- 0.0%
- Est. flood insurance / yr
- $507 – $1,088
Fire risk 5/10 · Moderate
- Est. fire insurance / yr
- $947 – $1,759
Heat risk 8/10 · Major
- Hot days now (above 107°F)
- 7 days/yr
- Hot days in 30 yrs
- 24 days/yr
Wind risk 9/10 · Severe
- Chance of severe wind over 30 yrs
- 99.0%
Air-quality risk 1/10 · Minimal
- Unhealthy air days now
- 0 days/yr
- Unhealthy air days in 30 yrs
- 0 days/yr
Risk factors via First Street. Map © Google.
Why this score? — see what drove the D grade
The composite is a weighted blend of 9 inputs, each scored 0–100. Each bar is that input's sub-score; the figure is the points it added to the 100-point composite (weight × sub-score).
- Cash flow +16.0/30.0
- ARV discount +7.5/15.0
- DSCR +5.0/10.0
- Livability +3.6/5.0
- Schools +3.5/10.0
- 1% rule +3.0/10.0
- Rent growth +2.5/5.0
- Condition / age +2.5/5.0
- Appreciation +0.0/10.0
$250,000
🖨 Deal sheet (PDF) 📄 Offer letter ✓ Due diligence
Listing remarks
BACK ON THE MARKET!!! Great opportunity on a great home in Lake Alfred, Fl. This Block home has more potential than can be stated. All the big items are done. Newer roof, Newer HVAC, partial new flooring and a brand new kitchen that is 95% complete including appliances. Inside, the home boasts a functional layout with cozy living spaces, ideal for both everyday living and entertaining. This could be a 4 or even 5 bedroom home with the right kind of creativity. Perfect for a large family needing some room or anyone with a need for a home office or even if you are looking for an investment property, this home offers a fantastic opportunity in a well-established neighborhood. On a dead end roa
Key facts
- Brand new kitchen
- Newer roof
- Partial new flooring
Tags
Property features AI
Finance
- Other: Lot is in city limits, paved road access; Lot dimensions approximately 91 x 135 (about 0.28 acres); Zoned R-1A
- HOA & community: No association
Exterior
- Parking: Carport (1 space)
- Utilities: Public water; Public sewer and septic tank; Electricity connected; Water connected
- Home design: Single-family residence; One story; South-facing; Homestead property
- Construction: Block construction; Metal roof; Slab foundation; Built on 1 floor
- Exterior features: Private above-ground pool with deck; Shed(s)
Interior
- Kitchen: Dishwasher; Range; Microwave; Refrigerator
- Bedrooms: 3 bedrooms
- Flooring: Laminate; Tile
- Bathrooms: 2 full bathrooms
- Heating & cooling: Central heating; Central air conditioning
- Interior features: Ceiling fans; Solid surface counters; Walk-in closet(s)
- Laundry & utility: Washer; Dryer; Indoor laundry
Neighborhood map
What this means for you Summary
Snapshot
- This is a 3-bed/1.0-bath single-family listed at $250k.
Deal economics
- At list price, monthly cash flow is $125 ($1k/yr) — positive.
- The deal already cash-flows at list — no discount required.
- To meet the 1% rule (rent ≥ 1% of price), the offer needs to be $200k (19.9% below list).
- Recommended offer: $200k (19.9% below list) — sets the bar for 1% rule.
Location & tenants
- Location reads 72/100 on livability (#363 in FL) — a middle-class / working-renter tenant base. Strengths: crime A+, cost of living A+, housing A+; Watch: employment D, amenities F, commute F.
- Polk (suburban): math 39% / reading 43% proficiency, ranked #62 of 73 in FL (top 85%) — families likely to look elsewhere, expect single-tenant / working-renter base with shorter leases.
- Zoned schools: Lake Alfred Elementary School (math 43% / reading 41%, grade F, #1,403 of 2,144 statewide, top 67%, 821 students, 49% FRL); Jere L. Stambaugh Middle (math 23% / reading 26%, grade F, #522 of 571 statewide, top 93%, 1,127 students, 65% FRL); Auburndale Senior High School (math 25% / reading 31%, grade F, #464 of 667 statewide, top 70%, 1,716 students, 53% FRL) — zoned schools at 56% FRL track the district average.
- Market conditions: 280 active listings in the ZIP; 4 comparable units currently listed for rent nearby; rentals at typical pace (median 16d on market — plan ~3-4 weeks tenant-placement turnaround); 10,384 units permitted in Polk County in 2024 (1,716 in 5+ unit buildings).
- This rent runs 39% of the median local income ($62k/yr) — at the standard rent-burdened threshold; future hikes will face affordability resistance.
Forward outlook
- Local home prices are declining (-3.0%/yr); year-one equity from $2k of loan paydown is wiped out by about $8k of value loss. Plan a longer hold.
- Polk County population projected at +33% by 2050 — long-run rental-demand tailwind backs the buy-and-hold thesis.
Negotiation context
- It's been on market 334 days — a 12% lower offer ($220k) is reasonable based on typical stale-listing flexibility.
- Current owner paid $65k; list at $250k implies a 285% gain — meaningful room to come down on a strong offer.
Risks & watch-outs
- Climate carrying-cost: severe wind risk, 99% chance of damaging wind over 30y; moderate wildfire risk; extreme-heat days projected 7→24/yr by 2055 (HVAC capex compounding) — expect insurance premiums to compound above CPI over the hold.
Questions for the listing agent
- It's been on market 334 days. Have you received any prior offers? Is the seller open to a 20% concession, seller financing, or rate buy-down credit?
- Built in 1962 — when were the roof, HVAC, electrical panel, plumbing, and water heater last replaced?
- Why hasn't it sold? Are there any deal-killer items the seller is aware of (foundation, flood, title, zoning, code violations)?
- Is there a deadline driving the sale (1031 exchange, divorce, estate, relocation)? That informs how much negotiation room exists.
- The area grade is low — what's the realistic commute time and amenity access for the typical tenant pool here? Any planned neighborhood developments (good or bad) we should know about?
- What's the average days-on-market for RENTAL listings here right now (not sales)? A rising rental-DOM trend means longer vacancies and softer asking-rent achievability than the comps imply.
- What's the recent tenant-quality profile in this submarket — average credit score on applications, eviction rate, late-payment / NSF rate, and stable-employment percentage? A property-management company in the area should have these aggregated.
- How much new for-sale + rental construction is in the pipeline within 1–3 miles? Heavy new supply typically softens prices + rents 12–24 months out; constrained supply supports both.
Investment metrics
- 1% rule
- 0.80% ✗
- Cap rate
- 6.89%
- Cash-on-cash
- 2.14%
- DSCR
- 1.10
- GRM
- 10.4
CMA / ARV
No comps found within radius.
Projected returns pro-forma
-3.0% appreciation · 3.0% rent growth · sell at horizon
- IRR
- -13.0%
- Equity multiple
- 0.53×
- Total profit
- $-32,712
- Equity at exit
- $37,276
- IRR
- -4.1%
- Equity multiple
- 0.73×
- Total profit
- $-18,822
- Equity at exit
- $21,615
Cash invested: $70,000 (down + closing). Projections, not guarantees.
Landlord ↔ Tenant lean methodology
- Overall (STATE)
- 87 Strongly Landlord-Friendly
- State Florida
- 87 Strongly Landlord-Friendly · R+3
- County
- — inherits STATE
- City
- — inherits STATE
ZIP-level market 33850
- Home prices YoY
- -8.5%
- Active inventory
- 280
- Price-to-rent
- 10.4×
Monthly cashflow live
- Estimated rent
- $2,002 medium interval (Pro) →
- Mortgage (P&I)
- −$1,311
- Tax from tax record
- −$42 /mo · $503/yr
- Insurance
- −$104
- HOA
- −$0
- Vacancy / Maint / Mgmt
- −$420
- Net cashflow
- $125
Break-even live
Sensitivity live
| Price | -10% $266 | -5% $195 | +0% $125 | +5% $-232 | +10% $-319 |
|---|---|---|---|---|---|
| Rent | -10% $-34 | -5% $45 | +0% $125 | +5% $204 | +10% $283 |
| Rate | -1.0pp $250 | -0.5pp $188 | base $125 | +0.5pp $60 | +1.0pp $-6 |
UW: 25.0% down · 7.5% · 30yr · 1.5% tax · 5.0% vac · 8.0% maint · 8.0% mgmt
Financing live
Cash to close
- Down payment
- $62,500
- Closing costs
- $7,500
- Reserves months
- —
- Total cash needed
- —
Loan-product check · same deal, 3 products live
Conventional
25% down · 7.5% · 30yr
- Down + closing
- —
- Monthly P&I
- —
- Monthly cashflow
- —
- DSCR
- —
- Eligible?
- —
Personal DTI + credit; lowest rate.
DSCR
20% down · 8.5% · 30yr
- Down + closing
- —
- Monthly P&I
- —
- Monthly cashflow
- —
- DSCR
- —
- Eligible?
- —
No personal income docs; deal must DSCR.
Hard money
10% down · 12.0% · 12mo
- Down + closing
- —
- Monthly P&I
- —
- Monthly cashflow
- —
- DSCR
- —
- Eligible?
- —
Short-term bridge; refi at stabilization.
Rent comps 4 comps
| Address | Beds | Baths | Sqft | Rent | $/sqft | DOM | Units | Dist |
|---|---|---|---|---|---|---|---|---|
| 505 Interlock St Lake Alfred, FL | 3.0 | 2.0 | 1443 | $1,919 | $1.33 | 4d | 1 | 0.63mi |
| 515 S Nekoma Ave Lake Alfred, FL | 3.0 | 2.0 | 2029 | $2,095 | $1.03 | 12d | 1 | 0.75mi |
| 709 Mosley Rd Lake Alfred, FL | 2.0 | 1.0 | 1980 | $1,250 | $0.63 | 25d | 1 | 0.94mi |
| 234 Cattail Way Lake Alfred, FL | 4.0 | 2.0 | 1689 | $1,911 | $1.13 | 15d | 1 | 1.20mi |
Listing history 15 events
-
2026-06-22days on market $250,000 Active 334 DOM
-
2026-06-18days on market $250,000 Active 331 DOM
-
2026-06-17days on market $250,000 Active 330 DOM
-
2026-06-16days on market $250,000 Active 329 DOM
-
2026-06-15days on market $250,000 Active 328 DOM
-
2026-06-13days on market $250,000 Active 326 DOM
-
2026-06-10days on market $250,000 Active 323 DOM
-
2026-06-09days on market $250,000 Active 322 DOM
-
2026-06-08days on market $250,000 Active 321 DOM
-
2026-06-07days on market $250,000 Active 320 DOM
-
2026-06-05status $250,000 Active 317 DOM
-
2026-05-22status Pending
-
2025-07-09$250,000 Active
-
1995-07-05soldstatus $65,000
-
1974-09-01soldstatus $26,300
ⓘ Source: listings_history table (triggers on properties + properties_extension) + one-shot
backfill from property_details.listing_events for pre-trigger history.
Tax reassessment forecast FL · Resets to sale price
- Current annual tax
- $503 · $42/mo
- Projected year-2 tax
- $2,075 · $173/mo
- Expected delta
- +$1,572/yr (+$131/mo · 312.6%)
ⓘ Screening estimate from a state-policy table — verify with the county assessor before closing.
Climate risk First Street
- Flood 1/10 Low FEMA zone X (unshaded) · 0% chance over 30 yrs
- Wildfire 5/10 Major
- Heat 8/10 Severe 7 d/yr ≥107°F today · 24 d/yr by 30 yrs out
- Wind 9/10 Extreme 99% chance of damaging wind over 30 yrs
- Air quality 1/10 Low 0 unhealthy d/yr today · 0 by 30 yrs out
Nearby sold comps map
Loading sold comps map…
Walkable amenities ~0.75 mi
Loading nearby amenities…
Taxation est. · year 1
- Rental income
- $24,026
- − Mortgage interest
- −$14,004
- − Property taxes
- −$503
- − Insurance
- −$1,250
- − Repairs & maintenance
- −$1,922
- − Management
- −$1,922
- − Depreciation
- −$7,273
- Taxable loss
- −$2,848
- Est. tax savings @ 24.0%
- +$684
- After-tax cash flow
- $2,178/yr
For passive investors: Depreciation is non-cash, so a rental often shows a tax loss while cash-flowing — sheltering income. Rental losses are passive: they offset passive income freely, and up to $25,000/yr can offset ordinary (W-2) income if you actively participate and your MAGI is under $100k (phasing out to $0 by $150k); unused losses carry forward. On sale, claimed depreciation is recaptured at up to 25%, and gains may owe capital-gains tax (a 1031 exchange can defer both). Figures are a year-1 estimate at your 24.0% rate — not tax advice; consult a CPA.
Schools (NCES district)
- District
- Polk
- NCES district ID
- 1201590
- Math proficiency
- 39% ▼ -11.00%
- Reading proficiency
- 43% ▼ -4.00%
- Median HH income
- $43,979
- Composite
- 34.74/100
- National rank
- #5132
- State rank
- #62 of 73 in FL
Livability — Lake Alfred
- Score
- 72/100
- State rank
- #363
- US rank
- #6406
Category grades
Schools grade is shown separately in the Schools card above.
Census & demographics
- Census place
- Lake Alfred, FL
- County
- Polk County · 740,051 people
- City population
- 9,757
- Metro
- Lakeland-Winter Haven, FL
- Population (ZIP)
- 9,757
- Household income
- $61,622
- Rent vs Own
- Severe rent burden
- 431.0
Population outlook (Polk County) Hauer SSP2
- Today (2025)
- 752,975 people
- By 2030
- 804,621 · +6.9%
- By 2040
- 906,117 · +20.3%
- By 2050
- 1,000,476 · +32.9%
- By 2075
- 1,197,520 · +59.0%
- By 2100
- 1,271,518 · +68.9%
Race, ethnicity, and origin ACS 2023
- Neighborhood character
- Diverse neighborhood (Simpson 0.63)
- Race & ethnicity
- White 54% Hispanic / Latino 24% Black 11% Asian 9% Two or more races 8%
- Hispanic origin (detail)
- Mexican 3% Puerto Rican 15% Dominican 2%
- Common ancestry
- Lithuanian 2% Italian 2% Romanian 1%
- Foreign-born
- 15% · Canada, China
- Languages at home
- 72% English-only · Spanish 21% Other Asian/Pacific 2% Other Indo-European 2%
Political lean MEDSL · Polk
- 2024 margin
- Strong R (+20.7) · D 39.2% · R 59.9%
- 2008→2024 swing
- -14.6pp toward R · 2008: -6.1pp · 2024: -20.7pp
- All cycles
- 2024: R+20.7 2020: R+14.4 2016: R+14.1 2012: R+6.8 2008: R+6.1
Not yet ingested
- Civics
- —
Market trends
- HPI YoY
- ▼ -32.91%
- Current HPI
- 353.941
- Rent YoY
- —
- Metro
- Lakeland-Winter Haven, FL
- State GDP YoY
- ▲ 3.28%
- F500 in state
- 36
Industry mix (Fortune 500 HQ in FL)
| Industry | F500 HQs | Revenue |
|---|---|---|
| Industrial Technology | 2 | $29B |
|
||
| Insurance | 2 | $17B |
|
||
| Retail | 1 | $60B |
|
||
| Technology Distribution | 1 | $58B |
|
||
| Homebuilding | 1 | $35B |
|
||
| Technology Manufacturing | 1 | $35B |
|
||
Price history
+850.6% since first listed4 events — show timeline
- 2026-05-22 Pending — Stellar MLS as Distributed by MLS Grid
- 2025-07-09 Listed $250,000 Stellar MLS as Distributed by MLS Grid
- 1995-07-05 Sold (Public Records) $65,000 Public Records
- 1974-09-01 Sold (Public Records) $26,300 Public Records
Property tax history
-1.5%/yrLatest (2025): $503 · +2.0% YoY. Source: county tax records.
Cash-flow waterfall
monthlySold comps — $/sqft
last 12 mo · ≤1 miLoading sold comps…