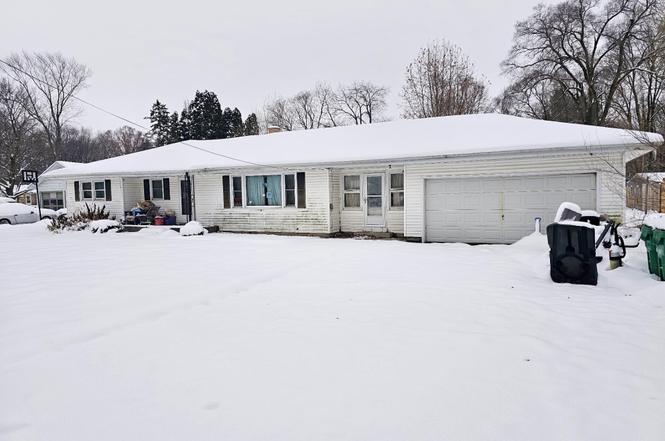
826 S Mayflower Rd · La Porte, IN
Flood risk 1/10 · Minimal
- FEMA flood zone
- X (unshaded)
- Chance of flooding over 30 yrs
- 0.0%
- Est. flood insurance / yr
- $473 – $860
Fire risk 1/10 · Minimal
- Est. fire insurance / yr
- $717 – $1,331
Heat risk 2/10 · Minimal
- Hot days now (above 99°F)
- 7 days/yr
- Hot days in 30 yrs
- 15 days/yr
Wind risk 2/10 · Minimal
- Chance of severe wind over 30 yrs
- —
Air-quality risk 2/10 · Minimal
- Unhealthy air days now
- 2 days/yr
- Unhealthy air days in 30 yrs
- 2 days/yr
Risk factors via First Street. Map © Google.
Why this score? — see what drove the B- grade
The composite is a weighted blend of 9 inputs, each scored 0–100. Each bar is that input's sub-score; the figure is the points it added to the 100-point composite (weight × sub-score).
- Cash flow +30.0/30.0
- 1% rule +10.0/10.0
- DSCR +10.0/10.0
- ARV discount +7.5/15.0
- Livability +3.7/5.0
- Schools +3.5/10.0
- Rent growth +2.5/5.0
- Condition / age +2.5/5.0
- Appreciation +0.0/10.0
$70,000
🖨 Deal sheet (PDF) 📄 Offer letter ✓ Due diligence
Listing remarks MLS
Great one owner home with pride of ownership throughout. Move in condition gorgeous oversized lot close to town. Large rooms including living room 3 bedrooms , dining area, kitchen, family room, 1 3/4 baths and den. Hardwood floors under bedrooms and living room. 20 X 50 garage for extra cars or huge work shop. Storage shed , new electric and much more. Take a look.
Key facts
- Generous lot
- Attached garage
- Flexible layout
Tags
Neighborhood map
What this means for you Summary
Snapshot
- This is a 3-bed/2.0-bath single-family listed at $70k.
Deal economics
- At list price, monthly cash flow is $613 ($7k/yr) — positive.
- The deal already cash-flows at list — no discount required.
- Meets the 1% rule at list price ($1k rent vs $70k).
- Cap rate 16.8% vs local median 3.7% in La Porte — top-decile yield for the area; either an underpriced asset or a hidden risk that comps aren't pricing in. Stress-test before assuming the spread holds.
Location & tenants
- Location reads 74/100 on livability (#81 in IN, #4,852 nationally) — a middle-class / working-renter tenant base. Strengths: amenities A+, cost of living A+, housing A+; Watch: commute F, employment F.
- Laporte Community School Corporation (urban): math 37% / reading 44% proficiency, ranked #139 of 301 in IN (top 46%) — families likely to look elsewhere, expect single-tenant / working-renter base with shorter leases.
- Zoned schools: Riley Elementary School (math 42% / reading 52%, grade D-, #325 of 994 statewide, top 36%, 296 students, 77% FRL); Kesling Intermediate School (math 36% / reading 39%, grade F, #146 of 330 statewide, top 46%, 903 students, 61% FRL); Laporte High School (math 34% / reading 57%, 1,875 students, 54% FRL) — zoned schools average 64% FRL vs 44% district-wide (20 pts higher); higher-poverty schools than district average — tighter screening recommended.
- Market conditions: 263 active listings in the ZIP; 216 units permitted in LaPorte County in 2024 (75 in 5+ unit buildings).
Forward outlook
- Local home prices are declining (-3.0%/yr); year-one equity from $484 of loan paydown is wiped out by about $2k of value loss. Plan a longer hold.
- LaPorte County population projected to shrink 7% by 2050 — rents likely to lag national; underwrite the cash flow, not the appreciation.
- At projected returns (-3.0% appreciation + 3.0% rent growth), your $20k cash investment doubles in ~4 years — after that, you're playing with house money.
Negotiation context
- Only 8 days on market — expect competitive offers; lowballing is unlikely to land.
- 2 sale attempts since 9y ago with the ask held roughly flat each time — persistent listings suggest the price (not the market) is what's stuck; bring a comps-based counter.
Risks & watch-outs
- Watch-outs: property tax is 2.5% of price; built in 1959 — expect roof / HVAC / electrical / plumbing capex.
Questions for the listing agent
- Built in 1959 — when were the roof, HVAC, electrical panel, plumbing, and water heater last replaced?
- Property tax is high relative to price — has the assessment been appealed recently, and will the sale trigger a re-assessment?
- Is there a deadline driving the sale (1031 exchange, divorce, estate, relocation)? That informs how much negotiation room exists.
- What's the average days-on-market for RENTAL listings here right now (not sales)? A rising rental-DOM trend means longer vacancies and softer asking-rent achievability than the comps imply.
- What's the recent tenant-quality profile in this submarket — average credit score on applications, eviction rate, late-payment / NSF rate, and stable-employment percentage? A property-management company in the area should have these aggregated.
- How much new for-sale + rental construction is in the pipeline within 1–3 miles? Heavy new supply typically softens prices + rents 12–24 months out; constrained supply supports both.
Investment metrics
- 1% rule
- 2.09% ✓
- Cap rate
- 16.81%
- Cash-on-cash
- 37.55%
- DSCR
- 2.67
- GRM
- 4.0
CMA / ARV
- ARV (on-the-fly)
- $229,822
- Comps found
- 12
Show comp detail 12 sales within ~0.75 mi
| Address | Dist | Beds/Ba | Sqft | Sold | Price | $/sf | Match |
|---|---|---|---|---|---|---|---|
| 139 Grand Ave | 0.25mi | 3/2.0 | 1,497 (-2%) | 15mo | $300,000 | $200 | 73 |
| 2261 W Joliet Rd | 0.62mi | 3/2.0 | 1,536 (+1%) | 7mo | $170,000 | $111 | 63 |
| 154 Grand Ave | 0.25mi | 3/1.0 | 1,644 (+8%) | 15mo | $170,690 | $104 | 59 |
| 1022 S Marquette St | 0.24mi | 3/1.0 | 1,344 (-12%) | 9mo | $260,000 | $193 | 58 |
| 1409 Andrew Ave | 0.65mi | 2/1.5 (-1) | 1,436 (-6%) | 4mo | $194,000 | $135 | 50 |
| 1808 Andrew Ave | 0.66mi | 3/2.0 | 1,398 (-8%) | 12mo | $279,000 | $200 | 45 |
| 10 Victoria Cir | 0.41mi | 2/2.0 (-1) | 1,648 (+8%) | 21mo | $249,000 | $151 | 45 |
| 18 Victoria Cir | 0.44mi | 2/2.0 (-1) | 1,320 (-13%) | 17mo | $212,000 | $161 | 38 |
| 1103 Andrew Ave | 0.69mi | 3/1.0 | 1,595 (+5%) | 21mo | $195,000 | $122 | 38 |
| 1002 L St | 0.74mi | 2/1.0 (-1) | 1,428 (-6%) | 12mo | $210,000 | $147 | 36 |
| 1527 5th St | 0.70mi | 3/1.0 | 1,736 (+14%) | 7mo | $166,000 | $96 | 34 |
| 1408 K St | 0.73mi | 3/1.5 | 1,392 (-8%) | 22mo | $215,000 | $154 | 31 |
Match score weights: distance 35% · size 25% · config 20% · recency 20%. Top-matched comps best support the ARV.
Projected returns pro-forma
-3.0% appreciation · 3.0% rent growth · sell at horizon
- IRR
- 33.6%
- Equity multiple
- 2.42×
- Total profit
- $27,783
- Equity at exit
- $10,437
- IRR
- 40.5%
- Equity multiple
- 4.81×
- Total profit
- $74,736
- Equity at exit
- $6,052
Cash invested: $19,600 (down + closing). Projections, not guarantees.
Landlord ↔ Tenant lean methodology
- Overall (STATE)
- 90 Strongly Landlord-Friendly
- State Indiana
- 90 Strongly Landlord-Friendly · R+11
- County
- — inherits STATE
- City
- — inherits STATE
ZIP-level market 46350
- Active inventory
- 263
- Price-to-rent
- 4.0×
Monthly cashflow live
- Estimated rent
- $1,464 medium interval (Pro) →
- Mortgage (P&I)
- −$367
- Tax from tax record
- −$147 /mo · $1,760/yr
- Insurance
- −$29
- HOA
- −$0
- Vacancy / Maint / Mgmt
- −$307
- Net cashflow
- $613
Break-even live
Sensitivity live
| Price | -10% $653 | -5% $633 | +0% $613 | +5% $594 | +10% $574 |
|---|---|---|---|---|---|
| Rent | -10% $498 | -5% $556 | +0% $613 | +5% $671 | +10% $729 |
| Rate | -1.0pp $649 | -0.5pp $631 | base $613 | +0.5pp $595 | +1.0pp $577 |
UW: 25.0% down · 7.5% · 30yr · 1.5% tax · 5.0% vac · 8.0% maint · 8.0% mgmt
Financing live
Cash to close
- Down payment
- $17,500
- Closing costs
- $2,100
- Reserves months
- —
- Total cash needed
- —
Loan-product check · same deal, 3 products live
Conventional
25% down · 7.5% · 30yr
- Down + closing
- —
- Monthly P&I
- —
- Monthly cashflow
- —
- DSCR
- —
- Eligible?
- —
Personal DTI + credit; lowest rate.
DSCR
20% down · 8.5% · 30yr
- Down + closing
- —
- Monthly P&I
- —
- Monthly cashflow
- —
- DSCR
- —
- Eligible?
- —
No personal income docs; deal must DSCR.
Hard money
10% down · 12.0% · 12mo
- Down + closing
- —
- Monthly P&I
- —
- Monthly cashflow
- —
- DSCR
- —
- Eligible?
- —
Short-term bridge; refi at stabilization.
Listing history 4 events
-
2026-02-02status Pending
-
2026-01-25$70,000 Active
-
2017-05-31soldstatus $159,900 368-char remark
Show marketing remark (368 chars)
Great one owner home with pride of ownership throughout. Move in condition gorgeous oversized lot close to town. Large rooms including living room 3 bedrooms , dining area, kitchen, family room, 1 3/4 baths and den. Hardwood floors under bedrooms and living room. 20 X 50 garage for extra cars or huge work shop. Storage shed , new electric and much more. Take a look.
-
2017-04-25$159,900 368-char remark
Show marketing remark (368 chars)
Great one owner home with pride of ownership throughout. Move in condition gorgeous oversized lot close to town. Large rooms including living room 3 bedrooms , dining area, kitchen, family room, 1 3/4 baths and den. Hardwood floors under bedrooms and living room. 20 X 50 garage for extra cars or huge work shop. Storage shed , new electric and much more. Take a look.
ⓘ Source: listings_history table (triggers on properties + properties_extension) + one-shot
backfill from property_details.listing_events for pre-trigger history.
Tax reassessment forecast IN · Partial reset (capped growth)
- Current annual tax
- $1,760 · $147/mo
- Projected year-2 tax
- $1,760 · $147/mo
- Expected delta
- $0/yr ($0/mo · 0.0%)
ⓘ Screening estimate from a state-policy table — verify with the county assessor before closing.
Climate risk First Street
- Flood 1/10 Low FEMA zone X (unshaded) · 0% chance over 30 yrs
- Wildfire 1/10 Low
- Heat 2/10 Low 7 d/yr ≥99°F today · 15 d/yr by 30 yrs out
- Wind 2/10 Low
- Air quality 2/10 Low 2 unhealthy d/yr today · 2 by 30 yrs out
Nearby sold comps map
Loading sold comps map…
Walkable amenities ~0.75 mi
Loading nearby amenities…
Taxation est. · year 1
- Rental income
- $17,565
- − Mortgage interest
- −$3,921
- − Property taxes
- −$1,760
- − Insurance
- −$350
- − Repairs & maintenance
- −$1,405
- − Management
- −$1,405
- − Depreciation
- −$2,036
- Taxable income
- $6,687
- Est. tax owed @ 24.0%
- −$1,605
- After-tax cash flow
- $5,756/yr
For passive investors: Depreciation is non-cash, so a rental often shows a tax loss while cash-flowing — sheltering income. Rental losses are passive: they offset passive income freely, and up to $25,000/yr can offset ordinary (W-2) income if you actively participate and your MAGI is under $100k (phasing out to $0 by $150k); unused losses carry forward. On sale, claimed depreciation is recaptured at up to 25%, and gains may owe capital-gains tax (a 1031 exchange can defer both). Figures are a year-1 estimate at your 24.0% rate — not tax advice; consult a CPA.
Schools (NCES district)
- District
- Laporte Community School Corporation
- NCES district ID
- 1805580
- Math proficiency
- 37% ▼ -13.00%
- Reading proficiency
- 44% ▼ -11.00%
- Median HH income
- $46,761
- Composite
- 34.58/100
- National rank
- #5162
- State rank
- #139 of 301 in IN
Livability — La Porte
- Score
- 74/100
- State rank
- #81
- US rank
- #4852
Category grades
Schools grade is shown separately in the Schools card above.
Census & demographics
- County
- La Porte County · 88,580 people
- City population
- 44,763
- Metro
- Michigan City-La Porte, IN
- Population (ZIP)
- 44,763
- Household income
- $74,307
- Rent vs Own
- Severe rent burden
- 835.0
Population outlook (LaPorte County) Hauer SSP2
- Today (2025)
- 109,757 people
- By 2030
- 108,288 · -1.3%
- By 2040
- 105,070 · -4.3%
- By 2050
- 102,330 · -6.8%
- By 2075
- 97,009 · -11.6%
- By 2100
- 86,459 · -21.2%
Race, ethnicity, and origin ACS 2023
- Neighborhood character
- Predominantly White (82%)
- Race & ethnicity
- White 82% Two or more races 8% Hispanic / Latino 8% Black 3%
- Hispanic origin (detail)
- Mexican 6%
- Common ancestry
- Romanian 11% Iranian 3% Italian 2%
- Foreign-born
- 4% · Canada
- Languages at home
- 93% English-only · Spanish 4% Russian/Polish/Slavic 1% German/W. Germanic 1%
Political lean MEDSL · LaPorte
- 2024 margin
- R (+14.1) · D 42.1% · R 56.2% · Other 1.7%
- 2008→2024 swing
- -19.1pp toward R · 2008: 5.0pp · 2024: -14.1pp
- All cycles
- 2024: R+14.1 2020: R+7.2 2016: R+6.4 2012: D+12.6 2008: D+5.0
Not yet ingested
- Civics
- —
Market trends
- HPI YoY
- ▼ -142.94%
- Current HPI
- 209.2564
- Rent YoY
- —
- Metro
- Michigan City-La Porte, IN
- State GDP YoY
- ▲ 2.90%
- F500 in state
- 18
Industry mix (Fortune 500 HQ in IN)
| Industry | F500 HQs | Revenue |
|---|---|---|
| Industrial Machinery | 2 | $37B |
|
||
| Healthcare | 1 | $177B |
|
||
| Pharmaceuticals | 1 | $45B |
|
||
| Metals / Steel | 1 | $18B |
|
||
| Agriculture | 1 | $17B |
|
||
| Packaging | 1 | $12B |
|
||
Price history
-56.2% since first listed4 events — show timeline
- 2026-02-02 Pending — NIRA MLS as Distributed by MLS Grid
- 2026-01-25 Listed $70,000 NIRA MLS as Distributed by MLS Grid
- 2017-05-31 Sold (MLS) $159,900 NIRA MLS as Distributed by MLS Grid
- 2017-04-25 Listed $159,900 NIRA MLS as Distributed by MLS Grid
Property tax history
+13.2%/yrLatest (2024): $1,760 · +7.5% YoY. Source: county tax records.
Cash-flow waterfall
monthlySold comps — $/sqft
last 12 mo · ≤1 miLoading sold comps…