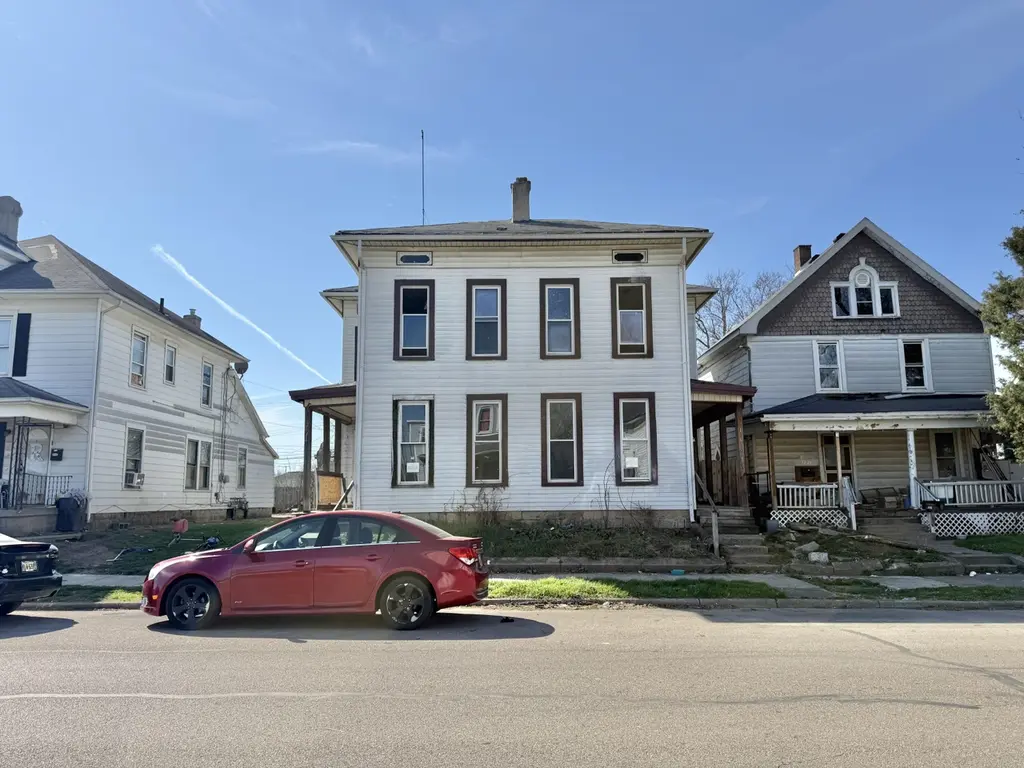
 Duplex
217-219 N Race St · Springfield, OH
Flood risk 1/10 · Minimal
- FEMA flood zone
- X (unshaded)
- Chance of flooding over 30 yrs
- 0.0%
- Est. flood insurance / yr
- $507 – $1,088
Fire risk 1/10 · Minimal
- Est. fire insurance / yr
- $713 – $1,323
Heat risk 3/10 · Minor
- Hot days now (above 100°F)
- 7 days/yr
- Hot days in 30 yrs
- 18 days/yr
Wind risk 2/10 · Minimal
- Chance of severe wind over 30 yrs
- —
Air-quality risk 3/10 · Minor
- Unhealthy air days now
- 2 days/yr
- Unhealthy air days in 30 yrs
- 3 days/yr
Risk factors via First Street. Map © Google.
Why this score? — see what drove the D+ grade
The composite is a weighted blend of 9 inputs, each scored 0–100. Each bar is that input's sub-score; the figure is the points it added to the 100-point composite (weight × sub-score).
- Cash flow +15.0/30.0
- ARV discount +15.0/15.0
- 1% rule +5.0/10.0
- DSCR +5.0/10.0
- Livability +2.8/5.0
- Rent growth +2.5/5.0
- Schools +1.9/10.0
- Condition / age +1.0/5.0
- Appreciation +0.0/10.0
$42,500
🖨 Deal sheet (PDF) 📄 Offer letter ✓ Due diligence
Multi-family units
County records classify this as Multi-Family (2-4 Unit). Listing-text estimate: 2 units. confirmed
Listing remarks MLS
High potential duplex opportunity ready for your next project. Side by side layout with two 2 bedroom 1 bath units offers a strong foundation for value creation. Exterior vinyl siding already in place adds durability and curb appeal. This property is a full renovation and priced to reflect the work needed. Ideal for a fix and flip or long term rental hold with solid income potential once completed. Serious upside for the right buyer willing to take it to the next level. Enter with caution. Property is being sold as is.
Key facts
- Side by side layout
- Full renovation
- Vinyl siding
Tags
Neighborhood map
What this means for you Summary
Snapshot
- This is a 2 × 2-bed/1-bath units multifamily listed at $42k. Condition is rated poor.
Deal economics
- At list price, monthly cash flow is $2k ($18k/yr) — positive. Per door: $752/mo.
- The deal already cash-flows at list — no discount required.
- Meets the 1% rule at list price ($2k rent vs $42k).
- Recommended offer: $41k (3.0% below list) — sets the bar for market timing.
- Cap rate 48.7% vs local median 4.8% in Springfield — top-decile yield for the area; either an underpriced asset or a hidden risk that comps aren't pricing in. Stress-test before assuming the spread holds.
Location & tenants
- Location reads 56/100 on livability (#1,108 in OH) — a working-class tenant base; expect higher turnover. Strengths: cost of living A+, housing A+; Watch: crime F, amenities F, commute F.
- Springfield City School District (urban): math 20% / reading 27% proficiency, ranked #616 of 656 in OH (top 94%) — low school quality limits family demand, transient renter base, plan for 1-2y turnover; 75% free/reduced lunch — lower-income household profile, screen leases tightly.
- Zoned schools: Snyder Park Elementary School (math 27% / reading 32%, grade F, #1,158 of 1,584 statewide, top 75%, 301 students, 0% FRL); Roosevelt Middle School (math 30% / reading 36%, grade F, #553 of 654 statewide, top 85%, 397 students, 0% FRL); Springfield High School (math 17% / reading 31%, grade F, #665 of 781 statewide, top 85%, 1,516 students, 0% FRL) — zoned schools average 0% FRL vs 75% district-wide (75 pts lower); this property's tenant base skews higher-income than the district average.
- Market conditions: 93 active listings in the ZIP; 1 comparable units currently listed for rent nearby; 232 units permitted in Clark County in 2024 (116 in 5+ unit buildings).
- This rent runs 41% of the median local income ($67k/yr) — at the standard rent-burdened threshold; future hikes will face affordability resistance.
Forward outlook
- Local home prices are declining (-3.0%/yr); year-one equity from $294 of loan paydown is wiped out by about $1k of value loss. Plan a longer hold.
- Clark County population projected at -16% by 2050 — secular population decline; favor cash flow + early exit over multi-decade hold.
- At projected returns (-3.0% appreciation + 3.0% rent growth), your $12k cash investment doubles in ~1 year — after that, you're playing with house money.
Negotiation context
- It's been on market 56 days — a 3% lower offer ($41k) is reasonable based on typical stale-listing flexibility.
Risks & watch-outs
- Watch-outs: built in 1886 — expect roof / HVAC / electrical / plumbing capex.
Questions for the listing agent
- It's been on market 56 days. Have you received any prior offers? Is the seller open to a 3% concession, seller financing, or rate buy-down credit?
- Can we see the unit-by-unit rent roll, current vacancy, and any below-market leases? What's the average tenancy length?
- What capital expenditures (roof, boiler, parking lot, exteriors) have been made in the last 5 years, and what's planned in the next 2?
- Have any recent inspections been done? Can we get a copy of the seller's disclosures and any deferred-maintenance estimates?
- Built in 1886 — when were the roof, HVAC, electrical panel, plumbing, and water heater last replaced?
- Is there a deadline driving the sale (1031 exchange, divorce, estate, relocation)? That informs how much negotiation room exists.
- Crime grade is F in this area — have there been break-ins, vandalism, or insurance claims at this property in the last 3 years? What carrier currently insures it and at what premium?
- The area grade is low — what's the realistic commute time and amenity access for the typical tenant pool here? Any planned neighborhood developments (good or bad) we should know about?
- What's the average days-on-market for RENTAL listings here right now (not sales)? A rising rental-DOM trend means longer vacancies and softer asking-rent achievability than the comps imply.
- What's the recent tenant-quality profile in this submarket — average credit score on applications, eviction rate, late-payment / NSF rate, and stable-employment percentage? A property-management company in the area should have these aggregated.
- How much new apartment / multifamily construction is in the pipeline within 1–3 miles? Heavy new supply (>2% of stock underway) typically softens rents 12–24 months out; light construction supports rent growth.
Investment metrics
- 1% rule
- 5.35% ✓
- Cap rate
- 48.75%
- Cash-on-cash
- 151.62%
- DSCR
- 7.75
- GRM
- 1.6
CMA / ARV
- ARV (median comp)
- $82,206
- List price
- $42,500
- Delta
- -48.30%
- Verdict
- UNDERPRICED
- Comps
- 20 within 1.0 mi
Show comp detail 7 sales within ~0.75 mi
| Address | Dist | Beds/Ba | Sqft | Sold | Price | $/sf | Match |
|---|---|---|---|---|---|---|---|
| 217-219 N Race St | 0.00mi | 4/2.0 | 2,655 (0%) | 0mo | $425,000 | $160 | 100 |
| 124-126 N Light St | 0.10mi | 4/2.0 | 2,512 (-5%) | 18mo | $85,000 | $34 | 71 |
| 935 W North St | 0.32mi | 5/2.0 (+1) | 2,716 (+2%) | 7mo | $200,000 | $74 | 70 |
| 453-455 N Yellow Springs St | 0.19mi | 4/— | 2,471 (-7%) | 23mo | $190,000 | $77 | 60 |
| 1103-1105 Broadway St | 0.42mi | 4/2.5 | 2,465 (-7%) | 18mo | $100,000 | $41 | 51 |
| 714 W Jefferson St | 0.47mi | 4/2.0 | 2,288 (-14%) | 12mo | $127,000 | $56 | 45 |
| 712 W Jefferson St | 0.48mi | 4/2.0 | 2,288 (-14%) | 12mo | $127,000 | $56 | 45 |
Match score weights: distance 35% · size 25% · config 20% · recency 20%. Top-matched comps best support the ARV.
Projected returns pro-forma
-3.0% appreciation · 3.0% rent growth · sell at horizon
- IRR
- —
- Equity multiple
- 8.47×
- Total profit
- $88,909
- Equity at exit
- $6,337
- IRR
- —
- Equity multiple
- 17.88×
- Total profit
- $200,868
- Equity at exit
- $3,675
Cash invested: $11,900 (down + closing). Projections, not guarantees.
Landlord ↔ Tenant lean methodology
- Overall (STATE)
- 73 Landlord-Friendly
- State Ohio
- 73 Landlord-Friendly · R+6
- County
- — inherits STATE
- City
- — inherits STATE
ZIP-level market 45504
- Active inventory
- 93
- Price-to-rent
- 3.1×
Monthly cashflow live
- Estimated rent
- $2,275 high interval (Pro) →
- Mortgage (P&I)
- −$223
- Tax est. 1.5%
- −$53 /mo · $638/yr
- Insurance
- −$18
- HOA
- −$0
- Vacancy / Maint / Mgmt
- −$478
- Net cashflow
- $1,504
Break-even live
Sensitivity live
| Price | -10% $1,533 | -5% $1,518 | +0% $1,504 | +5% $1,489 | +10% $1,474 |
|---|---|---|---|---|---|
| Rent | -10% $1,324 | -5% $1,414 | +0% $1,504 | +5% $1,593 | +10% $1,683 |
| Rate | -1.0pp $1,525 | -0.5pp $1,514 | base $1,504 | +0.5pp $1,493 | +1.0pp $1,481 |
2-unit breakdown (identical units grouped — click to expand)
| Units | Beds | Baths | Est. rent |
|---|---|---|---|
| 2× units | 2 | 1 | $2,276 |
| #1 | 2 | 1 | $1,138 |
| #2 | 2 | 1 | $1,138 |
| Total (2 units) | $2,275 | ||
UW: 25.0% down · 7.5% · 30yr · 1.5% tax · 5.0% vac · 8.0% maint · 8.0% mgmt
Financing live
Cash to close
- Down payment
- $10,625
- Closing costs
- $1,275
- Reserves months
- —
- Total cash needed
- —
Loan-product check · same deal, 3 products live
Conventional
25% down · 7.5% · 30yr
- Down + closing
- —
- Monthly P&I
- —
- Monthly cashflow
- —
- DSCR
- —
- Eligible?
- —
Personal DTI + credit; lowest rate.
DSCR
20% down · 8.5% · 30yr
- Down + closing
- —
- Monthly P&I
- —
- Monthly cashflow
- —
- DSCR
- —
- Eligible?
- —
No personal income docs; deal must DSCR.
Hard money
10% down · 12.0% · 12mo
- Down + closing
- —
- Monthly P&I
- —
- Monthly cashflow
- —
- DSCR
- —
- Eligible?
- —
Short-term bridge; refi at stabilization.
Rent comps 1 comps
| Address | Beds | Baths | Sqft | Rent | $/sqft | DOM | Units | Dist |
|---|---|---|---|---|---|---|---|---|
| 534 Homeview Ave Springfield, OH | 3.0 | 1.0 | 2660 | $1,200 | $0.45 | 45d | 1 | 1.27mi |
Listing history 3 events
-
2026-05-19status Pending 533-char remark
Show marketing remark (533 chars)
High potential duplex opportunity ready for your next project. Side by side layout with two 2 bedroom 1 bath units offers a strong foundation for value creation. Exterior vinyl siding already in place adds durability and curb appeal. This property is a full renovation and priced to reflect the work needed. Ideal for a fix and flip or long term rental hold with solid income potential once completed. Serious upside for the right buyer willing to take it to the next level. Enter with caution. Property is being sold as is.
-
2026-05-04price $42,500 533-char remark
Show marketing remark (533 chars)
High potential duplex opportunity ready for your next project. Side by side layout with two 2 bedroom 1 bath units offers a strong foundation for value creation. Exterior vinyl siding already in place adds durability and curb appeal. This property is a full renovation and priced to reflect the work needed. Ideal for a fix and flip or long term rental hold with solid income potential once completed. Serious upside for the right buyer willing to take it to the next level. Enter with caution. Property is being sold as is.
-
2026-03-23$47,000 Active 533-char remark
Show marketing remark (533 chars)
High potential duplex opportunity ready for your next project. Side by side layout with two 2 bedroom 1 bath units offers a strong foundation for value creation. Exterior vinyl siding already in place adds durability and curb appeal. This property is a full renovation and priced to reflect the work needed. Ideal for a fix and flip or long term rental hold with solid income potential once completed. Serious upside for the right buyer willing to take it to the next level. Enter with caution. Property is being sold as is.
ⓘ Source: listings_history table (triggers on properties + properties_extension) + one-shot
backfill from property_details.listing_events for pre-trigger history.
Climate risk First Street
- Flood 1/10 Low FEMA zone X (unshaded) · 0% chance over 30 yrs
- Wildfire 1/10 Low
- Heat 3/10 Moderate 7 d/yr ≥100°F today · 18 d/yr by 30 yrs out
- Wind 2/10 Low
- Air quality 3/10 Moderate 2 unhealthy d/yr today · 3 by 30 yrs out
Nearby sold comps map
Loading sold comps map…
Walkable amenities ~0.75 mi
Loading nearby amenities…
Taxation est. · year 1
- Rental income
- $27,300
- − Mortgage interest
- −$2,381
- − Property taxes
- −$638
- − Insurance
- −$212
- − Repairs & maintenance
- −$2,184
- − Management
- −$2,184
- − Depreciation
- −$1,236
- Taxable income
- $18,465
- Est. tax owed @ 24.0%
- −$4,432
- After-tax cash flow
- $13,611/yr
For passive investors: Depreciation is non-cash, so a rental often shows a tax loss while cash-flowing — sheltering income. Rental losses are passive: they offset passive income freely, and up to $25,000/yr can offset ordinary (W-2) income if you actively participate and your MAGI is under $100k (phasing out to $0 by $150k); unused losses carry forward. On sale, claimed depreciation is recaptured at up to 25%, and gains may owe capital-gains tax (a 1031 exchange can defer both). Figures are a year-1 estimate at your 24.0% rate — not tax advice; consult a CPA.
Condition & rehab AI · 12 photos
This property requires a full gut renovation and is in poor condition. Significant repairs and updates are needed to bring it up to code and increase its value.
Repairs flagged
- Major exterior siding — Severe damage to siding
- Major windows — Severe damage to windows
- Major foundation — Severe damage to foundation
- Major interior walls — Severe damage to drywall
- Major flooring — Severe damage to hardwood floors
- Major HVAC/mechanicals — Severe damage to heating and cooling systems
- Major landscaping — Severe damage to landscaping
Value-add opportunities
- Both exterior siding and windows — Improves curb appeal and structural integrity
- Both interior walls and flooring — Improves living space and structural integrity
- Both HVAC/mechanicals — Improves comfort and energy efficiency
- Both landscaping — Improves curb appeal and property value
Renovation cost estimate screening
| Repair item | Severity | Est. cost |
|---|---|---|
| exterior siding · Severe damage to siding | Major | $15,000–50,000 |
| windows · Severe damage to windows | Major | $15,000–50,000 |
| foundation · Severe damage to foundation | Major | $15,000–50,000 |
| interior walls · Severe damage to drywall | Major | $15,000–50,000 |
| flooring · Severe damage to hardwood floors | Major | $15,000–50,000 |
| HVAC/mechanicals · Severe damage to heating and cooling systems | Major | $15,000–50,000 |
| landscaping · Severe damage to landscaping | Major | $15,000–50,000 |
| Total estimated repair cost · 7 items | $105,000–350,000 |
Value-add ROI direction
- Both exterior siding and windows — Improves curb appeal and structural integrity ↑
- Both interior walls and flooring — Improves living space and structural integrity ↑
- Both HVAC/mechanicals — Improves comfort and energy efficiency ↑
- Both landscaping — Improves curb appeal and property value ↑
ⓘ Cost ranges are severity-bucket heuristics (US national rule-of-thumb). Get contractor quotes + a written scope before underwriting a rehab budget.
Schools (NCES district)
- District
- Springfield City School District
- NCES district ID
- 3904481
- Math proficiency
- 20% ▼ -16.00%
- Reading proficiency
- 27% ▼ -12.00%
- Median HH income
- $32,541
- Composite
- 19.12/100
- National rank
- #8834
- State rank
- #616 of 656 in OH
Livability — Springfield
- Score
- 56/100
- State rank
- #1108
- US rank
- #22551
Category grades
Schools grade is shown separately in the Schools card above.
Census & demographics
- Census place
- Springfield, OH
- County
- Clark · 134,280 people
- City population
- 33,261
- Metro
- Springfield, OH
- Population (ZIP)
- 16,654
- Household income
- $67,334
- Rent vs Own
- Severe rent burden
- 6.4
Population outlook (Clark County) Hauer SSP2
- Today (2025)
- 130,703 people
- By 2030
- 126,952 · -2.9%
- By 2040
- 118,344 · -9.5%
- By 2050
- 109,590 · -16.2%
- By 2075
- 89,464 · -31.6%
- By 2100
- 68,810 · -47.4%
Race, ethnicity, and origin ACS 2023
- Neighborhood character
- Predominantly White (85%)
- Race & ethnicity
- White 85% Two or more races 7% Black 5% Hispanic / Latino 3%
- Common ancestry
- Lithuanian 2% Slovak 2% Italian 1%
- Foreign-born
- 2% · Canada, China
- Languages at home
- 97% English-only · Spanish 2%
Political lean MEDSL · Clark
- 2024 margin
- Strong R (+29.5) · D 34.8% · R 64.3%
- 2008→2024 swing
- -27.0pp toward R · 2008: -2.5pp · 2024: -29.5pp
- All cycles
- 2024: R+29.5 2020: R+23.3 2016: R+19.5 2012: R+1.8 2008: R+2.5
Not yet ingested
- Civics
- —
Market trends
- HPI YoY
- ▼ -138.72%
- Current HPI
- 240.7049
- Rent YoY
- —
- Metro
- —
- State GDP YoY
- ▲ 1.98%
- F500 in state
- 48
Industry mix (Fortune 500 HQ in OH)
| Industry | F500 HQs | Revenue |
|---|---|---|
| Insurance | 3 | $145B |
|
||
| Industrial Machinery | 3 | $49B |
|
||
| Financial Services | 3 | $24B |
|
||
| Consumer Goods | 2 | $93B |
|
||
| Aerospace / Defense | 2 | $47B |
|
||
| Utilities | 2 | $33B |
|
||
Price history
-9.6% since first listed3 events — show timeline
- 2026-05-19 Pending — WRIST
- 2026-05-04 Price Changed $42,500 WRIST
- 2026-03-23 Listed $47,000 WRIST
Cash-flow waterfall
monthlySold comps — $/sqft
last 12 mo · ≤1 miLoading sold comps…