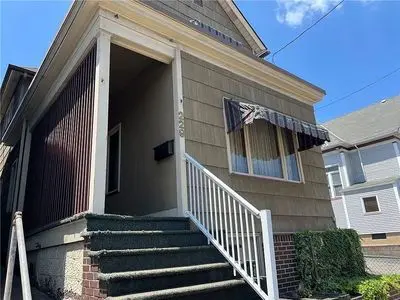
229 Fallowfield Ave · Charleroi, PA
Flood risk 7/10 · Major
- FEMA flood zone
- X (unshaded)
- Chance of flooding over 30 yrs
- 0.75%
- Est. flood insurance / yr
- $473 – $860
Fire risk 1/10 · Minimal
- Est. fire insurance / yr
- $511 – $949
Heat risk 4/10 · Minor
- Hot days now (above 97°F)
- 8 days/yr
- Hot days in 30 yrs
- 21 days/yr
Wind risk 2/10 · Minimal
- Chance of severe wind over 30 yrs
- —
Air-quality risk 2/10 · Minimal
- Unhealthy air days now
- 1 days/yr
- Unhealthy air days in 30 yrs
- 2 days/yr
Risk factors via First Street. Map © Google.
Why this score? — see what drove the B- grade
The composite is a weighted blend of 9 inputs, each scored 0–100. Each bar is that input's sub-score; the figure is the points it added to the 100-point composite (weight × sub-score).
- Cash flow +30.0/30.0
- 1% rule +10.0/10.0
- DSCR +10.0/10.0
- Appreciation +4.1/10.0
- Livability +3.8/5.0
- Schools +3.0/10.0
- Rent growth +2.5/5.0
- Condition / age +2.5/5.0
- ARV discount +0.0/15.0
$69,950
🖨 Deal sheet 📄 Offer letter ✓ Due diligence
Listing remarks
Set in the heart of Charleroi& apos; s historic district, this 1904 two-story offers something you rarely find at this price point: three bedrooms, a full and a half bath, and a 17x41 detached garage and workshop with commercial zoning & acirc; & euro; & rdquo; ready for a trade, a side business, serious storage, or a dream hobby space. The home has strong bones and the kind of original early-1900s character you can& apos; t fake. It& apos; s looking for a buyer who& apos; ll bring fresh paint, updated finishes, and a little cosmetic TLC to unlock its full charm. Step outside and you& apos; re on Fallowfield Avenue & acirc; & euro; & rdquo; Char
Key facts
- Historic district
- Detached garage
- Commercial zoning
Tags
Neighborhood map
What this means for you Summary
Snapshot
- This is a 3-bed/2.0-bath single-family listed at $70k.
Deal economics
- At list price, monthly cash flow is $318 ($4k/yr) — positive.
- The deal already cash-flows at list — no discount required.
- Meets the 1% rule at list price ($1k rent vs $70k).
- Recommended offer: $68k (3.0% below list) — sets the bar for market timing.
Location & tenants
- Location reads 76/100 on livability (#382 in PA, #3,416 nationally) — a middle-class / working-renter tenant base. Strengths: cost of living A+, housing A+, crime A-; Watch: schools D+, employment F.
- Charleroi SD (rural): math 20% / reading 51% proficiency, ranked #421 of 539 in PA (top 78%) — families likely to look elsewhere, expect single-tenant / working-renter base with shorter leases.
- Market conditions: 87 active listings in the ZIP; 2 comparable units currently listed for rent nearby; 489 units permitted in Washington County in 2024 (30 in 5+ unit buildings).
Forward outlook
- Local home prices are declining (-1.8%/yr); year-one equity from $484 of loan paydown is wiped out by about $1k of value loss. Plan a longer hold.
- Washington County population projected to shrink 6% by 2050 — rents likely to lag national; underwrite the cash flow, not the appreciation.
- At projected returns (-1.8% appreciation + 3.0% rent growth), your $20k cash investment doubles in ~6 years — after that, you're playing with house money.
Negotiation context
- It's been on market 37 days — a 3% lower offer ($68k) is reasonable based on typical stale-listing flexibility.
- 3 sale attempts with the ask held roughly flat each time — persistent listings suggest the price (not the market) is what's stuck; bring a comps-based counter.
Risks & watch-outs
- Watch-outs: flood insurance adds $56/mo; built in 1904 — expect roof / HVAC / electrical / plumbing capex.
- Climate carrying-cost: major flood risk — expect insurance premiums to compound above CPI over the hold.
Questions for the listing agent
- It's been on market 37 days. Have you received any prior offers? Is the seller open to a 3% concession, seller financing, or rate buy-down credit?
- Built in 1904 — when were the roof, HVAC, electrical panel, plumbing, and water heater last replaced?
- What's the actual annual flood-insurance premium (NFIP or private), and is the property in a SFHA with mandatory coverage?
- Is there a deadline driving the sale (1031 exchange, divorce, estate, relocation)? That informs how much negotiation room exists.
- Schools are D-rated, which usually means shorter tenancies and higher turnover. Who's the typical renter profile here, and what's been the actual vacancy rate?
- What's the average days-on-market for RENTAL listings here right now (not sales)? A rising rental-DOM trend means longer vacancies and softer asking-rent achievability than the comps imply.
- What's the recent tenant-quality profile in this submarket — average credit score on applications, eviction rate, late-payment / NSF rate, and stable-employment percentage? A property-management company in the area should have these aggregated.
- How much new for-sale + rental construction is in the pipeline within 1–3 miles? Heavy new supply typically softens prices + rents 12–24 months out; constrained supply supports both.
Investment metrics
- 1% rule
- 1.66% ✓
- Cap rate
- 12.71%
- Cash-on-cash
- 22.91%
- DSCR
- 2.02
- GRM
- 5.0
CMA / ARV
- ARV (on-the-fly)
- $54,060
- Comps found
- 12
Show comp detail 12 sales within ~0.75 mi
| Address | Dist | Beds/Ba | Sqft | Sold | Price | $/sf | Match |
|---|---|---|---|---|---|---|---|
| 101 Lincoln Ave | 0.16mi | 4/1.0 (+1) | 1,452 (-9%) | 1mo | $45,000 | $31 | 68 |
| 213 Crest Ave | 0.21mi | 3/1.0 | 1,449 (-9%) | 6mo | $32,000 | $22 | 67 |
| 100 Grandview Way | 0.43mi | 3/1.5 | 1,503 (-6%) | 5mo | $110,000 | $73 | 64 |
| 506 Lincoln Ave | 0.23mi | 3/1.0 | 1,388 (-13%) | 6mo | $35,975 | $26 | 59 |
| 907 Crest Ave | 0.60mi | 3/1.5 | 1,700 (+7%) | 1mo | $53,000 | $31 | 58 |
| 811 Prospect Ave | 0.51mi | 3/1.0 | 1,463 (-8%) | 3mo | $24,000 | $16 | 56 |
| 437 Shady Ave | 0.42mi | 4/1.5 (+1) | 1,698 (+7%) | 8mo | $58,500 | $34 | 55 |
| 167 Maple Ter | 0.62mi | 3/3.0 | 1,497 (-6%) | 6mo | $180,000 | $120 | 52 |
| 413 Shady Ave | 0.37mi | 3/1.0 | 1,372 (-14%) | 8mo | $50,000 | $36 | 49 |
| 26 Petrak St | 0.65mi | 3/2.5 | 1,390 (-13%) | 0mo | $112,500 | $81 | 46 |
| 828 Crest Ave | 0.57mi | 4/2.0 (+1) | 1,762 (+11%) | 6mo | $24,000 | $14 | 45 |
| 310 Fremont Rd | 0.67mi | 4/3.0 (+1) | 1,488 (-6%) | 10mo | $175,000 | $118 | 41 |
Match score weights: distance 35% · size 25% · config 20% · recency 20%. Top-matched comps best support the ARV.
Projected returns pro-forma
-1.83% appreciation · 3.0% rent growth · sell at horizon
- IRR
- 14.8%
- Equity multiple
- 1.64×
- Total profit
- $12,519
- Equity at exit
- $14,143
- IRR
- 21.9%
- Equity multiple
- 3.07×
- Total profit
- $40,506
- Equity at exit
- $12,623
Cash invested: $19,586 (down + closing). Projections, not guarantees.
Landlord ↔ Tenant lean methodology
- Overall (STATE)
- 62 Landlord-Friendly
- State Pennsylvania
- 62 Landlord-Friendly · EVEN
- County
- — inherits STATE
- City
- — inherits STATE
ZIP-level market 15022
- Home prices YoY
- -1.0%
- Active inventory
- 87
- Price-to-rent
- 5.0×
Monthly cashflow live
- Estimated rent
- $1,159 medium interval (Pro) →
- Mortgage (P&I)
- −$367
- Tax from tax record
- −$145 /mo · $1,745/yr
- Insurance
- −$29
- Flood insurance flood zone
- −$56 /mo · $666/yr
- HOA
- −$0
- Vacancy / Maint / Mgmt
- −$243
- Net cashflow
- $318
Break-even live
UW: 25.0% down · 7.5% · 30yr · 1.5% tax · 5.0% vac · 8.0% maint · 8.0% mgmt
Financing live
Cash to close
- Down payment
- $17,488
- Closing costs
- $2,098
- Reserves months
- —
- Total cash needed
- —
Loan-product check · same deal, 3 products live
Conventional
25% down · 7.5% · 30yr
- Down + closing
- —
- Monthly P&I
- —
- Monthly cashflow
- —
- DSCR
- —
- Eligible?
- —
Personal DTI + credit; lowest rate.
DSCR
20% down · 8.5% · 30yr
- Down + closing
- —
- Monthly P&I
- —
- Monthly cashflow
- —
- DSCR
- —
- Eligible?
- —
No personal income docs; deal must DSCR.
Hard money
10% down · 12.0% · 12mo
- Down + closing
- —
- Monthly P&I
- —
- Monthly cashflow
- —
- DSCR
- —
- Eligible?
- —
Short-term bridge; refi at stabilization.
Rent comps 2 comps
| Address | Beds | Baths | Sqft | Rent | $/sqft | DOM | Units | Dist |
|---|---|---|---|---|---|---|---|---|
| 1022 McKean Ave Charleroi, PA | 3.0 | 3.0 | 1344 | $1,450 | $1.08 | 1d | 1 | 0.71mi |
| 1136 Reservoir Ave Monessen, PA | 3.0 | 2.0 | 1550 | $650 | $0.42 | 1d | 1 | 1.43mi |
Listing history 17 events
-
2026-06-18days on market $69,950 Active 37 DOM
-
2026-06-17days on market $69,950 Active 36 DOM
-
2026-06-16days on market $69,950 Active 35 DOM
-
2026-06-15days on market $69,950 Active 34 DOM
-
2026-06-13days on market $69,950 Active 32 DOM
-
2026-06-09days on market $69,950 Active 28 DOM
-
2026-06-08days on market $69,950 Active 27 DOM
-
2026-06-07days on market $69,950 Active 26 DOM
-
2026-06-05days on market $69,950 Active 23 DOM
-
2026-06-03days on market $69,950 Active 22 DOM
-
2026-06-02days on market $69,950 Active 21 DOM
-
2026-06-01days on market $69,950 Active 20 DOM
-
2026-05-31days on market $69,950 Active 19 DOM
-
2026-05-12$69,950 Active 1083-char remark
-
2025-09-25status Active
-
2025-09-14historical Contingent
-
2025-07-09$68,900 Active
ⓘ Source: listings_history table (triggers on properties + properties_extension) + one-shot
backfill from property_details.listing_events for pre-trigger history.
Tax reassessment forecast PA · Partial reset (capped growth)
- Current annual tax
- $1,745 · $145/mo
- Projected year-2 tax
- $1,745 · $145/mo
- Expected delta
- $0/yr ($0/mo · 0.0%)
ⓘ Screening estimate from a state-policy table — verify with the county assessor before closing.
Climate risk First Street
- Flood 7/10 Severe FEMA zone X (unshaded) · 75% chance over 30 yrs
- Wildfire 1/10 Low
- Heat 4/10 Moderate 8 d/yr ≥97°F today · 21 d/yr by 30 yrs out
- Wind 2/10 Low
- Air quality 2/10 Low 1 unhealthy d/yr today · 2 by 30 yrs out
Nearby sold comps map
Loading sold comps map…
Walkable amenities ~0.75 mi
Loading nearby amenities…
Taxation est. · year 1
- Rental income
- $13,904
- − Mortgage interest
- −$3,918
- − Property taxes
- −$1,745
- − Insurance
- −$1,016
- − Repairs & maintenance
- −$1,112
- − Management
- −$1,112
- − Depreciation
- −$2,035
- Taxable income
- $2,964
- Est. tax owed @ 24.0%
- −$711
- After-tax cash flow
- $3,109/yr
For passive investors: Depreciation is non-cash, so a rental often shows a tax loss while cash-flowing — sheltering income. Rental losses are passive: they offset passive income freely, and up to $25,000/yr can offset ordinary (W-2) income if you actively participate and your MAGI is under $100k (phasing out to $0 by $150k); unused losses carry forward. On sale, claimed depreciation is recaptured at up to 25%, and gains may owe capital-gains tax (a 1031 exchange can defer both). Figures are a year-1 estimate at your 24.0% rate — not tax advice; consult a CPA.
Schools (NCES district)
- District
- Charleroi SD
- NCES district ID
- 4205640
- Math proficiency
- 20% ▼ -19.00%
- Reading proficiency
- 51% ▼ -11.00%
- Median HH income
- $40,410
- Composite
- 29.72/100
- National rank
- #6450
- State rank
- #421 of 539 in PA
Livability — Charleroi
- Score
- 76/100
- State rank
- #382
- US rank
- #3416
Category grades
Schools grade is shown separately in the Schools card above.
Census & demographics
- Census place
- Charleroi, PA
- Population (ZIP)
- 10,044
Population outlook (Washington County) Hauer SSP2
- Today (2025)
- 208,060 people
- By 2030
- 207,168 · -0.4%
- By 2040
- 202,738 · -2.6%
- By 2050
- 195,269 · -6.1%
- By 2075
- 175,588 · -15.6%
- By 2100
- 145,827 · -29.9%
Race, ethnicity, and origin ACS 2023
- Neighborhood character
- Predominantly White (87%)
- Race & ethnicity
- White 87% Two or more races 6% Black 6%
- Common ancestry
- Romanian 8% Lithuanian 3% Scotch-Irish 2%
- Foreign-born
- 2% · Canada
- Languages at home
- 98% English-only · Spanish 1%
Political lean MEDSL · Washington
- 2024 margin
- Strong R (+25.5) · D 36.9% · R 62.4%
- 2008→2024 swing
- -20.8pp toward R · 2008: -4.7pp · 2024: -25.5pp
- All cycles
- 2024: R+25.5 2020: R+22.8 2016: R+25.3 2012: R+13.3 2008: R+4.7
Not yet ingested
- Civics
- —
Market trends
- HPI YoY
- ▼ -1.83%
- Current HPI
- 174.218
- Rent YoY
- —
- Metro
- —
- State GDP YoY
- ▲ 1.68%
- F500 in state
- 34
Industry mix (Fortune 500 HQ in PA)
| Industry | F500 HQs | Revenue |
|---|---|---|
| Healthcare | 2 | $309B |
|
||
| Insurance | 2 | $27B |
|
||
| Telecommunications / Media | 1 | $124B |
|
||
| Industrial Distribution | 1 | $22B |
|
||
| Financial Services | 1 | $20B |
|
||
| Chemicals / Materials | 1 | $18B |
|
||
Price history
+1.5% since first listed4 events — show timeline
- 2026-05-12 Listed $69,950 FSBO.com
- 2025-09-25 Relisted — West Penn MLS
- 2025-09-14 Contingent — West Penn MLS
- 2025-07-09 Listed $68,900 West Penn MLS
Property tax history
+6.2%/yrLatest (2026): $1,745 · +1.2% YoY. Source: county tax records.
Cash-flow waterfall
monthlySold comps — $/sqft
last 12 mo · ≤1 miLoading sold comps…