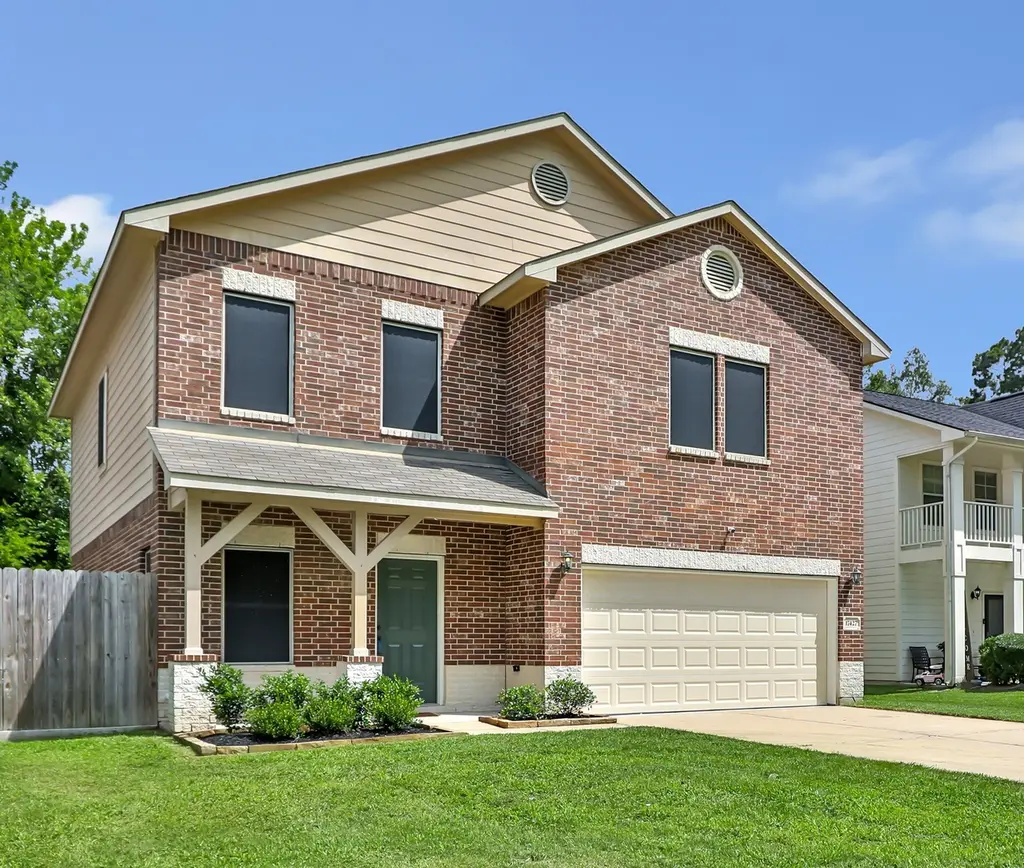
17427 Marlin Spike Way · Crosby, TX
Flood risk 6/10 · Moderate
- FEMA flood zone
- X (unshaded)
- Chance of flooding over 30 yrs
- 0.74%
- Est. flood insurance / yr
- $507 – $1,088
Fire risk 2/10 · Minimal
- Est. fire insurance / yr
- $1,222 – $2,270
Heat risk 9/10 · Severe
- Hot days now (above 110°F)
- 7 days/yr
- Hot days in 30 yrs
- 24 days/yr
Wind risk 9/10 · Severe
- Chance of severe wind over 30 yrs
- 99.0%
Air-quality risk 2/10 · Minimal
- Unhealthy air days now
- 2 days/yr
- Unhealthy air days in 30 yrs
- 2 days/yr
Risk factors via First Street. Map © Google.
Why this score? — see what drove the D+ grade
The composite is a weighted blend of 9 inputs, each scored 0–100. Each bar is that input's sub-score; the figure is the points it added to the 100-point composite (weight × sub-score).
- ARV discount +14.0/15.0
- Cash flow +11.8/30.0
- 1% rule +4.7/10.0
- DSCR +3.5/10.0
- Schools +3.5/10.0
- Livability +3.0/5.0
- Rent growth +2.9/5.0
- Condition / age +2.5/5.0
- Appreciation +0.0/10.0
$295,000
🖨 Deal sheet 📄 Offer letter ✓ Due diligence
Listing remarks MLS
This gorgeous Censeo home features 4/5 bedrooms, 3 baths. Open and spacious living/dining combo. Double French doors lead to patio. Enjoy all the amenities of Newport, including amazing golf course, lake access, pool and splash pad. Vinyl Plank as Floor downstairs carpet in bedrooms. Master Bedroom offers its own en suite with a separate shower and a soaker tub plus Double sinks. Also His and Hers walk in oversized closets. This gorgeous home also has a wooden patio that is perched out the back French doors from the dining room. This home has endless possibilities! Rooms Are Approximate!
Key facts
- Built-in planters
- Full bathroom
- Guest bedroom
Tags
Property features AI
Finance
- Other: Association-maintained pool
- HOA & community: Newport POA with $65 monthly fee; Community amenities include basketball court, boat ramp, clubhouse, fitness center, golf course, picnic area, playground, park, pool, tennis courts, trails, and trash service
Exterior
- Parking: Attached garage; 2-car garage
- Utilities: Public water; Public sewer
- Home design: Residential property; Entry level: First and Second floors
- Construction: Built in 2016; Brick and cement siding construction; Composition roof; Slab foundation
- Exterior features: Near golf course; Located in a subdivision; Pond on the lot; Association pool
Interior
- Kitchen: Dishwasher; Disposal; Microwave
- Bedrooms: Primary bedroom (Second level, 16x14); Bedroom (First level, 10x14); Bedroom (Second level, 10x11); Bedroom (Second level, 10x11); Bedroom (Second level, 10x11)
- Bathrooms: 3 full bathrooms
- Heating & cooling: Central heating (electric); Central air (electric)
- Interior features: Electric dryer hookup; Dishwasher, Disposal, Microwave
- Laundry & utility: Electric dryer hookup
Neighborhood map
What this means for you Summary
Snapshot
- This is a 5-bed/3.0-bath single-family listed at $295k.
Deal economics
- At list price, monthly cash flow is $-83 ($-1k/yr) — negative.
- To cash-flow at today's rent, offer at most $280k (5.0% below list).
- To meet the 1% rule (rent ≥ 1% of price), the offer needs to be $287k (2.8% below list).
- Recommended offer: $280k (5.0% below list) — sets the bar for cash-flow.
- Cap rate 6.0% vs local median 4.8% in Crosby — meaningfully above typical; check what's discounted (condition, days-on-market, listing class) to confirm the premium yield is real.
Location & tenants
- Location reads 59/100 on livability (#1,121 in TX) — a working-class tenant base; expect higher turnover. Strengths: cost of living A+, crime A, housing A; Watch: amenities F, commute F, employment F.
- Crosby ISD (rural): math 39% / reading 40% proficiency, ranked #369 of 826 in TX (top 45%) — families likely to look elsewhere, expect single-tenant / working-renter base with shorter leases.
- Zoned schools: Crosby Middle (math 36% / reading 37%, grade F, #786 of 1,662 statewide, top 48%, 1,549 students, 60% FRL); Highpoint School East (Crosby) (20 students, 80% FRL) — zoned schools average 70% FRL vs 50% district-wide (20 pts higher); higher-poverty schools than district average — tighter screening recommended.
- Market conditions: Rents rising (+1.5%/yr); 1172 active listings in the ZIP; 2 comparable units currently listed for rent nearby; solid renter incomes; 29,883 units permitted in Harris County in 2024 (8,621 in 5+ unit buildings).
- This rent runs 37% of the median local income ($92k/yr) — at the standard rent-burdened threshold; future hikes will face affordability resistance.
Forward outlook
- Local home prices are declining (-3.0%/yr); year-one equity from $2k of loan paydown is wiped out by about $9k of value loss. Plan a longer hold.
- Harris County population projected at +47% by 2050 — long-run rental-demand tailwind backs the buy-and-hold thesis.
Negotiation context
- It's been on market 18 days — a 2% lower offer ($291k) is reasonable based on typical stale-listing flexibility.
- 4 sale attempts since 10y ago with the ask held roughly flat each time — persistent listings suggest the price (not the market) is what's stuck; bring a comps-based counter.
Risks & watch-outs
- Climate carrying-cost: major flood risk; severe wind risk, 99% chance of damaging wind over 30y; extreme-heat days projected 7→24/yr by 2055 (HVAC capex compounding) — expect insurance premiums to compound above CPI over the hold.
Questions for the listing agent
- What do current leases actually rent for vs. the listed asking? Can we see a recent rent roll and the last 12 months of T-12 income?
- What does the HOA fee cover, when was the last increase, and are there any pending special assessments or reserve-fund shortfalls?
- Is there a deadline driving the sale (1031 exchange, divorce, estate, relocation)? That informs how much negotiation room exists.
- Schools are D-rated, which usually means shorter tenancies and higher turnover. Who's the typical renter profile here, and what's been the actual vacancy rate?
- The area grade is low — what's the realistic commute time and amenity access for the typical tenant pool here? Any planned neighborhood developments (good or bad) we should know about?
- What's the average days-on-market for RENTAL listings here right now (not sales)? A rising rental-DOM trend means longer vacancies and softer asking-rent achievability than the comps imply.
- What's the recent tenant-quality profile in this submarket — average credit score on applications, eviction rate, late-payment / NSF rate, and stable-employment percentage? A property-management company in the area should have these aggregated.
- How much new for-sale + rental construction is in the pipeline within 1–3 miles? Heavy new supply typically softens prices + rents 12–24 months out; constrained supply supports both.
Investment metrics
- 1% rule
- 0.97% ✗
- Cap rate
- 5.95%
- Cash-on-cash
- -1.21%
- DSCR
- 0.95
- GRM
- 8.6
CMA / ARV
- ARV (on-the-fly)
- $345,100
- Comps found
- 12
Show comp detail 12 sales within ~0.75 mi
| Address | Dist | Beds/Ba | Sqft | Sold | Price | $/sf | Match |
|---|---|---|---|---|---|---|---|
| 17518 Monsoon Ct | 0.10mi | 4/2.5 (-1) | 2,346 (-1%) | 2mo | $339,800 | $145 | 84 |
| 17707 Gimbals Way | 0.29mi | 4/3.0 (-1) | 2,436 (+2%) | 2mo | $215,000 | $88 | 76 |
| 338 Point Nemo St | 0.42mi | 4/3.0 (-1) | 2,356 (-1%) | 1mo | $313,900 | $133 | 73 |
| 502 Batten Way | 0.34mi | 4/2.5 (-1) | 2,428 (+2%) | 2mo | $399,999 | $165 | 72 |
| 414 Point Nemo St | 0.45mi | 4/2.5 (-1) | 2,466 (+4%) | 0mo | $279,870 | $113 | 66 |
| 406 Point Nemo St | 0.44mi | 4/2.5 (-1) | 2,285 (-4%) | 1mo | $299,980 | $131 | 66 |
| 427 Bayberry Landing Way | 0.52mi | 4/2.0 (-1) | 2,418 (+2%) | 2mo | $299,000 | $124 | 62 |
| 506 Zeus Mountains Dr | 0.57mi | 4/3.5 (-1) | 2,510 (+6%) | 1mo | $379,900 | $151 | 56 |
| 654 Meadowknoll Dr | 0.60mi | 5/3.0 | 2,733 (+15%) | 0mo | $354,990 | $130 | 47 |
| 627 Nestor Dr | 0.60mi | 4/3.0 (-1) | 2,041 (-14%) | 0mo | $324,290 | $159 | 43 |
| 610 Nestor Dr | 0.60mi | 4/3.0 (-1) | 2,041 (-14%) | 1mo | $320,990 | $157 | 43 |
| 603 Meadowknoll Dr | 0.60mi | 4/3.0 (-1) | 2,041 (-14%) | 1mo | $325,990 | $160 | 42 |
Match score weights: distance 35% · size 25% · config 20% · recency 20%. Top-matched comps best support the ARV.
Projected returns pro-forma
-3.0% appreciation · 1.48% rent growth · sell at horizon
- IRR
- -20.2%
- Equity multiple
- 0.31×
- Total profit
- $-57,204
- Equity at exit
- $43,985
- IRR
- -17.4%
- Equity multiple
- 0.12×
- Total profit
- $-72,901
- Equity at exit
- $25,506
Cash invested: $82,600 (down + closing). Projections, not guarantees.
Landlord ↔ Tenant lean methodology
- Overall (STATE)
- 87 Strongly Landlord-Friendly
- State Texas
- 87 Strongly Landlord-Friendly · R+5
- County
- — inherits STATE
- City
- — inherits STATE
ZIP-level market 77532
- Home prices YoY
- -28.6%
- Rents YoY
- 1.5%
- Active inventory
- 1172
- Price-to-rent
- 8.6×
Monthly cashflow live
- Estimated rent
- $2,868 medium interval (Pro) →
- Mortgage (P&I)
- −$1,547
- Tax from tax record
- −$614 /mo · $7,373/yr
- Insurance
- −$123
- HOA
- −$65
- Vacancy / Maint / Mgmt
- −$602
- Net cashflow
- $-83
Break-even live
UW: 25.0% down · 7.5% · 30yr · 1.5% tax · 5.0% vac · 8.0% maint · 8.0% mgmt
Financing live
Cash to close
- Down payment
- $73,750
- Closing costs
- $8,850
- Reserves months
- —
- Total cash needed
- —
Loan-product check · same deal, 3 products live
Conventional
25% down · 7.5% · 30yr
- Down + closing
- —
- Monthly P&I
- —
- Monthly cashflow
- —
- DSCR
- —
- Eligible?
- —
Personal DTI + credit; lowest rate.
DSCR
20% down · 8.5% · 30yr
- Down + closing
- —
- Monthly P&I
- —
- Monthly cashflow
- —
- DSCR
- —
- Eligible?
- —
No personal income docs; deal must DSCR.
Hard money
10% down · 12.0% · 12mo
- Down + closing
- —
- Monthly P&I
- —
- Monthly cashflow
- —
- DSCR
- —
- Eligible?
- —
Short-term bridge; refi at stabilization.
Rent comps 2 comps
| Address | Beds | Baths | Sqft | Rent | $/sqft | DOM | Units | Dist |
|---|---|---|---|---|---|---|---|---|
| 1310 Stem Way Dr Crosby, TX | 4.0 | 2.0 | 2346 | $2,700 | $1.15 | 2d | 1 | 1.18mi |
| 6006 Lovage Ave Crosby, TX | 4.0 | 2.5 | 2261 | $2,055 | $0.91 | 20d | 1 | 1.40mi |
HOA detail
- Monthly dues
- $65 · $780/yr
- Likely covers
- pool
Listing history 13 events
-
2026-06-18days on market $295,000 Active 18 DOM
-
2026-06-17days on market $295,000 Active 17 DOM
-
2026-06-16days on market $295,000 Active 16 DOM
-
2026-06-15days on market $295,000 Active 15 DOM
-
2026-06-13days on market $295,000 Active 13 DOM
-
2026-06-09days on market $295,000 Active 9 DOM
-
2026-06-08days on market $295,000 Active 8 DOM
-
2026-06-07days on market $295,000 Active 7 DOM
-
2026-06-04days on market $295,000 Active 4 DOM
-
2026-06-03days on market $295,000 Active 3 DOM
-
2026-06-02days on market $295,000 Active 2 DOM
-
2026-06-01remarks 699-char remark
-
2026-06-01$295,000 Active 1 DOM
ⓘ Source: listings_history table (triggers on properties + properties_extension) + one-shot
backfill from property_details.listing_events for pre-trigger history.
Tax reassessment forecast TX · Resets to sale price
- Current annual tax
- $7,373 · $614/mo
- Projected year-2 tax
- $7,373 · $614/mo
- Expected delta
- $0/yr ($0/mo · 0.0%)
ⓘ Screening estimate from a state-policy table — verify with the county assessor before closing.
Climate risk First Street
- Flood 6/10 Major FEMA zone X (unshaded) · 74% chance over 30 yrs
- Wildfire 2/10 Low
- Heat 9/10 Extreme 7 d/yr ≥110°F today · 24 d/yr by 30 yrs out
- Wind 9/10 Extreme 99% chance of damaging wind over 30 yrs
- Air quality 2/10 Low 2 unhealthy d/yr today · 2 by 30 yrs out
Nearby sold comps map
Loading sold comps map…
Walkable amenities ~0.75 mi
Loading nearby amenities…
Taxation est. · year 1
- Rental income
- $34,419
- − Mortgage interest
- −$16,525
- − Property taxes
- −$7,373
- − Insurance
- −$1,475
- − Repairs & maintenance
- −$2,753
- − Management
- −$2,753
- − HOA
- −$780
- − Depreciation
- −$8,582
- Taxable loss
- −$5,823
- Est. tax savings @ 24.0%
- +$1,397
- After-tax cash flow
- $396/yr
For passive investors: Depreciation is non-cash, so a rental often shows a tax loss while cash-flowing — sheltering income. Rental losses are passive: they offset passive income freely, and up to $25,000/yr can offset ordinary (W-2) income if you actively participate and your MAGI is under $100k (phasing out to $0 by $150k); unused losses carry forward. On sale, claimed depreciation is recaptured at up to 25%, and gains may owe capital-gains tax (a 1031 exchange can defer both). Figures are a year-1 estimate at your 24.0% rate — not tax advice; consult a CPA.
Schools (NCES district)
- District
- Crosby ISD
- NCES district ID
- 4815750
- Math proficiency
- 39% ▼ -13.00%
- Reading proficiency
- 40% ▼ -5.00%
- Median HH income
- $61,079
- Composite
- 35.14/100
- National rank
- #5012
- State rank
- #369 of 826 in TX
Livability — Crosby
- Score
- 59/100
- State rank
- #1121
- US rank
- #19783
Category grades
Schools grade is shown separately in the Schools card above.
Census & demographics
- County
- Harris County · 4,702,590 people
- City population
- 3,226,434
- Metro
- Houston-The Woodlands-Sugar Land, TX
- Population (ZIP)
- 33,780
- Household income
- $92,201
- Rent vs Own
- Severe rent burden
- 382.0
Population outlook (Harris County) Hauer SSP2
- Today (2025)
- 5,571,493 people
- By 2030
- 6,089,821 · +9.3%
- By 2040
- 7,142,806 · +28.2%
- By 2050
- 8,185,864 · +46.9%
- By 2075
- 10,574,329 · +89.8%
- By 2100
- 12,109,958 · +117.4%
Race, ethnicity, and origin ACS 2023
- Neighborhood character
- Diverse neighborhood (Simpson 0.60)
- Race & ethnicity
- White 54% Hispanic / Latino 31% Two or more races 16% Black 9%
- Hispanic origin (detail)
- Mexican 24%
- Common ancestry
- Lithuanian 4% Romanian 3% Italian 2%
- Foreign-born
- 10% · Canada
- Languages at home
- 78% English-only · Spanish 21%
Political lean MEDSL · Harris
- 2024 margin
- Lean D (+5.5) · D 52.0% · R 46.4% · Other 1.6%
- 2008→2024 swing
- +3.9pp toward D · 2008: 1.6pp · 2024: 5.5pp
- All cycles
- 2024: D+5.5 2020: D+13.3 2016: D+12.4 2012: D+0.1 2008: D+1.6
Not yet ingested
- Civics
- —
Market trends
- HPI YoY
- ▼ -105.63%
- Current HPI
- 264.0126
- Rent YoY
- ▲ 1.48%
- Metro
- Houston-The Woodlands-Sugar Land, TX
- State GDP YoY
- ▲ 3.95%
- F500 in state
- 110
Industry mix (Fortune 500 HQ in TX)
| Industry | F500 HQs | Revenue |
|---|---|---|
| Energy | 16 | $1,198B |
|
||
| Technology | 5 | $198B |
|
||
| Engineering / Construction | 4 | $72B |
|
||
| Energy Services | 3 | $60B |
|
||
| Utilities | 3 | $41B |
|
||
| Healthcare | 2 | $330B |
|
||
Price history
+57.3% since first listed17 events — show timeline
- 2026-05-31 Listed $295,000 HARMLS
- 2021-12-10 Sold (Public Records) — Public Records
- 2021-12-10 Sold (Public Records) — Public Records
- 2021-12-08 Sold (MLS) — HARMLS
- 2021-11-20 Pending — HARMLS
- 2021-11-10 Pending — HARMLS
- 2021-10-29 Listing Removed — HARMLS
- 2021-10-29 Listed $274,900 HARMLS
- 2021-10-20 Price Changed $275,500 HARMLS
- 2021-10-10 Price Changed $289,500 HARMLS
- 2021-10-02 Price Changed $301,500 HARMLS
- 2021-09-15 Listed $304,900 HARMLS
- 2016-09-30 Sold (MLS) — HARMLS
- 2016-06-20 Pending — HARMLS
- 2016-05-03 Price Changed $184,000 HARMLS
- 2016-05-02 Listed $187,500 HARMLS
- 1988-01-02 Sold (Public Records) — Public Records
Property tax history
+1.5%/yrLatest (2025): $7,373 · -11.1% YoY. Source: county tax records.
Cash-flow waterfall
monthlySold comps — $/sqft
last 12 mo · ≤1 miLoading sold comps…