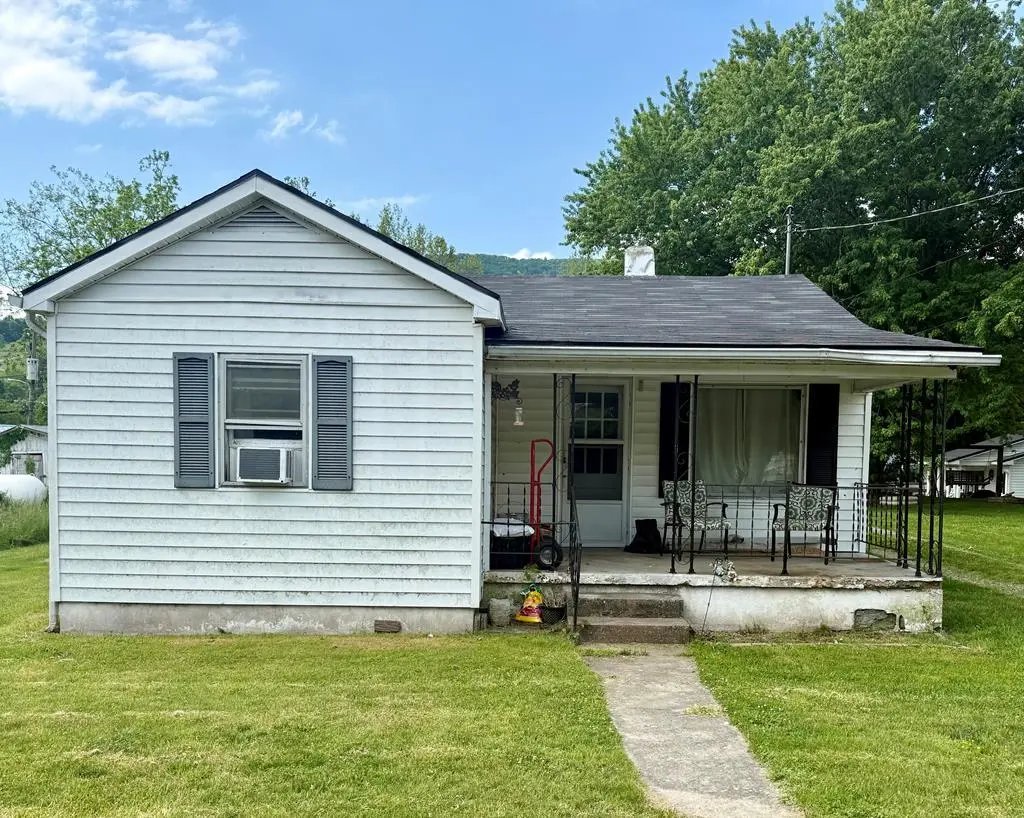
350 Eagles Rd · Rocky Gap, VA
Flood risk 1/10 · Minimal
- FEMA flood zone
- AE
- Chance of flooding over 30 yrs
- 0.0%
- Est. flood insurance / yr
- $2,026 – $9,024
Fire risk 4/10 · Minor
- Est. fire insurance / yr
- $666 – $1,236
Heat risk 3/10 · Minor
- Hot days now (above 92°F)
- 8 days/yr
- Hot days in 30 yrs
- 25 days/yr
Wind risk 2/10 · Minimal
- Chance of severe wind over 30 yrs
- 0.0%
Air-quality risk 1/10 · Minimal
- Unhealthy air days now
- 0 days/yr
- Unhealthy air days in 30 yrs
- 0 days/yr
Risk factors via First Street. Map © Google.
Why this score? — see what drove the B+ grade
The composite is a weighted blend of 9 inputs, each scored 0–100. Each bar is that input's sub-score; the figure is the points it added to the 100-point composite (weight × sub-score).
- Cash flow +30.0/30.0
- DSCR +10.0/10.0
- Appreciation +8.3/10.0
- ARV discount +7.5/15.0
- 1% rule +7.4/10.0
- Schools +6.0/10.0
- Rent growth +2.5/5.0
- Livability +2.5/5.0
- Condition / age +2.5/5.0
$69,500
🖨 Deal sheet (PDF) 📄 Offer letter ✓ Due diligence
Listing remarks MLS
This 2 bed 1 bath home is located right in the middle of Rocky Gap. It is close to the gas station, post office and Bland Intermediate and High School. This house sits on a beautiful . 5+/- acre lot. There is a detached carport with two sheds for storage.
Key facts
- Shaded yard
- New single roof
- 0.25 acre lot
Tags
Property features AI
Exterior
- Utilities: Public water; Septic tank
- Home design: Single-family residence; One story
- Construction: Block and vinyl siding construction; Shingle roof; Crawl space foundation; Built on a 0.25-acre lot
- Exterior features: Level lot; Shed(s)
Interior
- Kitchen: Electric cooktop; Electric oven
- Flooring: Laminate flooring; Wood flooring
- Bathrooms: 1 full bathroom
- Heating & cooling: Oil heating; Ceiling fan(s); Wall/window air conditioning unit(s)
- Interior features: Wood-burning fireplace; Electric cooktop and electric oven
Neighborhood map
What this means for you Summary
Snapshot
- This is a 2-bed/1.0-bath single-family listed at $70k.
Deal economics
- At list price, monthly cash flow is $-193 ($-2k/yr) — negative.
- To cash-flow at today's rent, offer at most $35k (49.1% below list).
- Meets the 1% rule at list price ($861 rent vs $70k).
- Recommended offer: $35k (49.1% below list) — sets the bar for cash-flow.
Location & tenants
- Location reads: area grade B — affects rentability + tenant quality, not the cash-flow math above.
- Bland County Public School District (rural): math 62% / reading 80% proficiency, ranked #23 of 131 in VA (top 18%) — strong family-tenant draw, lease renewals of 3-5y typical.
- Zoned schools: Bland County Elementary (math 57% / reading 72%, grade B, #416 of 1,108 statewide, top 41%, 371 students, 67% FRL); Bland County High (math 62% / reading 87%, grade B+, #107 of 319 statewide, top 37%, 425 students, 68% FRL) — zoned schools average 67% FRL vs 32% district-wide (35 pts higher); higher-poverty schools than district average — tighter screening recommended.
- Market conditions: 10 active listings in the ZIP; 8 units permitted in Bland County in 2024 (0 in 5+ unit buildings).
Forward outlook
- In year one you build about $5k of equity ($481 loan paydown + $5k appreciation (6.5% local appreciation)).
- Bland County population projected at -20% by 2050 — secular population decline; favor cash flow + early exit over multi-decade hold.
- By year 7, paydown + projected appreciation supports a ~$33k cash-out refi (75% LTV) — recoverable capital for the next deal without selling this one.
Negotiation context
- It's been on market 32 days — a 3% lower offer ($67k) is reasonable based on typical stale-listing flexibility.
- 3 sale attempts since 7y ago; this cycle's ask has dropped $10k (13%) from the opening price — seller is motivated, your offer sets the floor, not the list.
- Current owner paid $40k; list at $70k implies a 74% gain — meaningful room to come down on a strong offer.
Risks & watch-outs
- Watch-outs: flood insurance adds $460/mo.
- Climate carrying-cost: in FEMA flood zone AE (mandatory federal flood insurance) — expect insurance premiums to compound above CPI over the hold.
Questions for the listing agent
- What do current leases actually rent for vs. the listed asking? Can we see a recent rent roll and the last 12 months of T-12 income?
- It's been on market 32 days. Have you received any prior offers? Is the seller open to a 49% concession, seller financing, or rate buy-down credit?
- Built in 1960 — when were the roof, HVAC, electrical panel, plumbing, and water heater last replaced?
- What's the actual annual flood-insurance premium (NFIP or private), and is the property in a SFHA with mandatory coverage?
- Is there a deadline driving the sale (1031 exchange, divorce, estate, relocation)? That informs how much negotiation room exists.
- What's the average days-on-market for RENTAL listings here right now (not sales)? A rising rental-DOM trend means longer vacancies and softer asking-rent achievability than the comps imply.
- What's the recent tenant-quality profile in this submarket — average credit score on applications, eviction rate, late-payment / NSF rate, and stable-employment percentage? A property-management company in the area should have these aggregated.
- How much new for-sale + rental construction is in the pipeline within 1–3 miles? Heavy new supply typically softens prices + rents 12–24 months out; constrained supply supports both.
Investment metrics
- 1% rule
- 1.24% ✓
- Cap rate
- 10.91%
- Cash-on-cash
- 16.47%
- DSCR
- 1.73
- GRM
- 6.7
CMA / ARV
No comps found within radius.
Projected returns pro-forma
6.54% appreciation · 3.0% rent growth · sell at horizon
- IRR
- 7.5%
- Equity multiple
- 1.53×
- Total profit
- $10,257
- Equity at exit
- $46,080
- IRR
- 9.4%
- Equity multiple
- 3.05×
- Total profit
- $39,797
- Equity at exit
- $85,709
Cash invested: $19,460 (down + closing). Projections, not guarantees.
Landlord ↔ Tenant lean methodology
- Overall (STATE)
- 55 Moderately Landlord-Leaning
- State Virginia
- 55 Moderately Landlord-Leaning · D+2
- County
- — inherits STATE
- City
- — inherits STATE
ZIP-level market 24366
- Home prices YoY
- 3.5%
- Active inventory
- 10
- Price-to-rent
- 6.7×
Monthly cashflow live
- Estimated rent
- $861 medium interval (Pro) →
- Mortgage (P&I)
- −$364
- Tax from tax record
- −$20 /mo · $235/yr
- Insurance
- −$29
- Flood insurance flood zone
- −$460 /mo · $5,525/yr
- HOA
- −$0
- Vacancy / Maint / Mgmt
- −$181
- Net cashflow
- $-193
Break-even live
Sensitivity live
| Price | -10% $-154 | -5% $-174 | +0% $-193 | +5% $-213 | +10% $-233 |
|---|---|---|---|---|---|
| Rent | -10% $-261 | -5% $-227 | +0% $-193 | +5% $-159 | +10% $-125 |
| Rate | -1.0pp $-158 | -0.5pp $-176 | base $-193 | +0.5pp $-211 | +1.0pp $-230 |
UW: 25.0% down · 7.5% · 30yr · 1.5% tax · 5.0% vac · 8.0% maint · 8.0% mgmt
Financing live
Cash to close
- Down payment
- $17,375
- Closing costs
- $2,085
- Reserves months
- —
- Total cash needed
- —
Loan-product check · same deal, 3 products live
Conventional
25% down · 7.5% · 30yr
- Down + closing
- —
- Monthly P&I
- —
- Monthly cashflow
- —
- DSCR
- —
- Eligible?
- —
Personal DTI + credit; lowest rate.
DSCR
20% down · 8.5% · 30yr
- Down + closing
- —
- Monthly P&I
- —
- Monthly cashflow
- —
- DSCR
- —
- Eligible?
- —
No personal income docs; deal must DSCR.
Hard money
10% down · 12.0% · 12mo
- Down + closing
- —
- Monthly P&I
- —
- Monthly cashflow
- —
- DSCR
- —
- Eligible?
- —
Short-term bridge; refi at stabilization.
Listing history 24 events
-
2026-06-21days on market $69,500 Active 32 DOM
-
2026-06-19days on market $69,500 Active 30 DOM
-
2026-06-18price $69,500 Active 29 DOM
-
2026-06-18days on market $80,000 Active 29 DOM
-
2026-06-17days on market $80,000 Active 28 DOM
-
2026-06-16days on market $80,000 Active 27 DOM
-
2026-06-15days on market $80,000 Active 26 DOM
-
2026-06-14days on market $80,000 Active 24 DOM
-
2026-06-12days on market $80,000 Active 23 DOM
-
2026-06-09days on market $80,000 Active 20 DOM
-
2026-06-08days on market $80,000 Active 19 DOM
-
2026-06-07days on market $80,000 Active 18 DOM
-
2026-06-05days on market $80,000 Active 15 DOM
-
2026-06-03days on market $80,000 Active 14 DOM
-
2026-06-02days on market $80,000 Active 13 DOM
-
2026-06-01days on market $80,000 Active 12 DOM
-
2026-05-31days on market $80,000 Active 11 DOM
-
2026-05-30days on market $80,000 Active 10 DOM
-
2026-05-20$80,000 Active
-
2022-03-21soldstatus $40,000
-
2022-03-18soldstatus $40,000 255-char remark
Show marketing remark (255 chars)
This 2 bed 1 bath home is located right in the middle of Rocky Gap. It is close to the gas station, post office and Bland Intermediate and High School. This house sits on a beautiful . 5+/- acre lot. There is a detached carport with two sheds for storage.
-
2019-11-19$49,500 255-char remark
Show marketing remark (255 chars)
This 2 bed 1 bath home is located right in the middle of Rocky Gap. It is close to the gas station, post office and Bland Intermediate and High School. This house sits on a beautiful . 5+/- acre lot. There is a detached carport with two sheds for storage.
-
2019-11-18$49,500 255-char remark
Show marketing remark (255 chars)
This 2 bed 1 bath home is located right in the middle of Rocky Gap. It is close to the gas station, post office and Bland Intermediate and High School. This house sits on a beautiful . 5+/- acre lot. There is a detached carport with two sheds for storage.
ⓘ Source: listings_history table (triggers on properties + properties_extension) + one-shot
backfill from property_details.listing_events for pre-trigger history.
Tax reassessment forecast VA · Resets to sale price
- Current annual tax
- $235 · $20/mo
- Projected year-2 tax
- $570 · $47/mo
- Expected delta
- +$335/yr (+$28/mo · 142.9%)
ⓘ Screening estimate from a state-policy table — verify with the county assessor before closing.
Climate risk First Street
- Flood 1/10 Low FEMA zone AE · 0% chance over 30 yrs
- Wildfire 4/10 Moderate
- Heat 3/10 Moderate 8 d/yr ≥92°F today · 25 d/yr by 30 yrs out
- Wind 2/10 Low 0% chance of damaging wind over 30 yrs
- Air quality 1/10 Low 0 unhealthy d/yr today · 0 by 30 yrs out
Nearby sold comps map
Loading sold comps map…
Walkable amenities ~0.75 mi
Loading nearby amenities…
Taxation est. · year 1
- Rental income
- $10,331
- − Mortgage interest
- −$3,893
- − Property taxes
- −$235
- − Insurance
- −$5,872
- − Repairs & maintenance
- −$826
- − Management
- −$826
- − Depreciation
- −$2,022
- Taxable loss
- −$3,344
- Est. tax savings @ 24.0%
- +$803
- After-tax cash flow
- $-1,517/yr
For passive investors: Depreciation is non-cash, so a rental often shows a tax loss while cash-flowing — sheltering income. Rental losses are passive: they offset passive income freely, and up to $25,000/yr can offset ordinary (W-2) income if you actively participate and your MAGI is under $100k (phasing out to $0 by $150k); unused losses carry forward. On sale, claimed depreciation is recaptured at up to 25%, and gains may owe capital-gains tax (a 1031 exchange can defer both). Figures are a year-1 estimate at your 24.0% rate — not tax advice; consult a CPA.
Schools (NCES district)
- District
- Bland County Public School District
- NCES district ID
- 5100390
- Math proficiency
- 62% ▼ -25.00%
- Reading proficiency
- 80% ▬ 0.00%
- Median HH income
- $44,048
- Composite
- 59.56/100
- National rank
- #917
- State rank
- #23 of 131 in VA
Livability — Rocky Gap
No livability data for this city. (Only ~50 U.S. cities are tracked.)
Census & demographics
- Census place
- Rocky Gap, VA
- Population (ZIP)
- 333
Population outlook (Bland County) Hauer SSP2
- Today (2025)
- 6,172 people
- By 2030
- 5,928 · -4.0%
- By 2040
- 5,402 · -12.5%
- By 2050
- 4,926 · -20.2%
- By 2075
- 4,051 · -34.4%
- By 2100
- 3,028 · -50.9%
Race, ethnicity, and origin ACS 2023
- Neighborhood character
- Predominantly White (92%)
- Race & ethnicity
- White 92% Black 8%
- Common ancestry
- Serbian 1%
Political lean MEDSL · Bland
- 2024 margin
- Solid R (+69.7) · D 14.8% · R 84.5%
- 2008→2024 swing
- -30.3pp toward R · 2008: -39.4pp · 2024: -69.7pp
- All cycles
- 2024: R+69.7 2020: R+68.2 2016: R+67.8 2012: R+48.0 2008: R+39.4
Not yet ingested
- Civics
- —
Market trends
- HPI YoY
- ▲ 6.54%
- Current HPI
- 194.6264
- Rent YoY
- —
- Metro
- —
- State GDP YoY
- ▲ 2.40%
- F500 in state
- 50
Industry mix (Fortune 500 HQ in VA)
| Industry | F500 HQs | Revenue |
|---|---|---|
| Aerospace / Defense | 4 | $236B |
|
||
| Technology / Defense | 3 | $32B |
|
||
| Financial Services | 2 | $176B |
|
||
| Utilities | 2 | $27B |
|
||
| Insurance | 2 | $25B |
|
||
| Technology | 2 | $15B |
|
||
Price history
+61.6% since first listed6 events — show timeline
- 2026-05-20 Listed $80,000 SWVAR
- 2022-03-21 Sold (Public Records) $40,000 Public Records
- 2022-03-18 Sold (MLS) $40,000 SWVAR
- 2022-03-18 Sold (MLS) $40,000 NRVMLS
- 2019-11-19 Listed $49,500 NRVMLS
- 2019-11-18 Listed $49,500 SWVAR
Property tax history
+14.3%/yrLatest (2025): $235 · +0.0% YoY. Source: county tax records.
Cash-flow waterfall
monthlySold comps — $/sqft
last 12 mo · ≤1 miLoading sold comps…