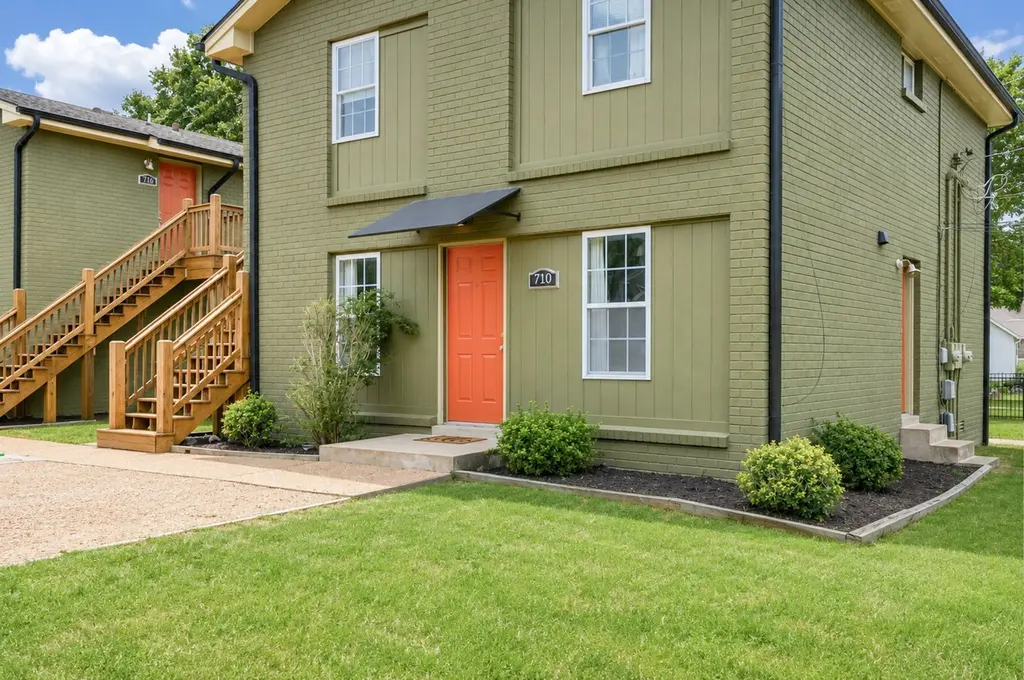
710 Douglas Ave · Nashville-Davidson metropolitan government (balance), TN
Flood risk 7/10 · Major
- FEMA flood zone
- X (unshaded)
- Chance of flooding over 30 yrs
- 0.99%
- Est. flood insurance / yr
- $507 – $1,088
Fire risk 1/10 · Minimal
- Est. fire insurance / yr
- $949 – $1,763
Heat risk 6/10 · Moderate
- Hot days now (above 106°F)
- 7 days/yr
- Hot days in 30 yrs
- 20 days/yr
Wind risk 4/10 · Minor
- Chance of severe wind over 30 yrs
- 9.0%
Air-quality risk 2/10 · Minimal
- Unhealthy air days now
- 1 days/yr
- Unhealthy air days in 30 yrs
- 2 days/yr
Risk factors via First Street. Map © Google.
Why this score? — see what drove the D grade
The composite is a weighted blend of 9 inputs, each scored 0–100. Each bar is that input's sub-score; the figure is the points it added to the 100-point composite (weight × sub-score).
- Cash flow +15.7/30.0
- ARV discount +7.5/15.0
- 1% rule +5.8/10.0
- DSCR +4.8/10.0
- Rent growth +2.8/5.0
- Livability +2.5/5.0
- Condition / age +2.5/5.0
- Schools +1.4/10.0
- Appreciation +0.0/10.0
$279,999
🖨 Deal sheet 📄 Offer letter ✓ Due diligence
Listing remarks MLS
Recently updated quadplex in red hot Cleveland Park! This turnkey property offers FURNISHED units with the revenue-maximizing layout of 2 bedrooms and 1 bathroom. Enjoy the unbeatable location just minutes from Oracle's $4.5 billion campus and the new $2.1 billion Titans stadium, which will drive neighborhood growth for years to come. Recently updated, vacant, and furnished, this property offers a versatile investment in one of Nashville's fastest-growing neighborhoods.
Key facts
- Built 1968
- Listed 7 days
Property features AI
Finance
- Other: Living area reported as 740 square feet; Existing (previously built) condition
- HOA & community: Condominium common interest
Exterior
- Parking: No covered spaces reported; No total parking spaces reported
- Utilities: Public water; Public sewer; Water available
- Home design: Attached flat condominium; One level
- Construction: Brick construction
- Exterior features: Lot approximately 0.24 acres; Lot dimensions about 70 x 112
Interior
- Kitchen: Electric oven and range; Refrigerator
- Bedrooms: 2 bedrooms (both on the main level)
- Flooring: Carpet; Wood; Tile
- Bathrooms: 1 full bathroom
- Heating & cooling: Central heating; Central air conditioning
- Interior features: Electric oven and electric range; Refrigerator; Washer; Crawl space basement
- Laundry & utility: Washer hookup; Electric dryer hookup
Neighborhood map
What this means for you Summary
Snapshot
- This is a 4-bed/2.0-bath townhouse listed at $280k.
Deal economics
- At list price, monthly cash flow is $57 ($683/yr) — positive.
- The deal already cash-flows at list — no discount required.
- Meets the 1% rule at list price ($3k rent vs $280k).
- Cap rate 6.8% vs local median 2.9% in Nashville-Davidson metropolitan government (balance) — top-decile yield for the area; either an underpriced asset or a hidden risk that comps aren't pricing in. Stress-test before assuming the spread holds.
Location & tenants
- Location reads: area grade D — affects rentability + tenant quality, not the cash-flow math above.
- Davidson County (urban): math 12% / reading 19% proficiency, ranked #126 of 139 in TN (top 91%) — low school quality limits family demand, transient renter base, plan for 1-2y turnover; 66% free/reduced lunch — lower-income household profile, screen leases tightly.
- Zoned schools: Shwab Elementary (math 12% / reading 12%, grade F, #786 of 952 statewide, top 84%, 337 students, 0% FRL); Maplewood High (math 2% / reading 12%, grade F, #294 of 332 statewide, top 91%, 691 students, 0% FRL) — zoned schools average 0% FRL vs 66% district-wide (66 pts lower); this property's tenant base skews higher-income than the district average.
- Market conditions: Rents rising (+1.3%/yr); 535 active listings in the ZIP; 40 comparable units currently listed for rent nearby; rentals at typical pace (median 16d on market — plan ~3-4 weeks tenant-placement turnaround); 6,873 units permitted in Davidson County in 2024 (4,138 in 5+ unit buildings).
- At $3,035/mo this rent would consume 59% of the median local household income ($62k/yr) (locally 1969% of renters already pay >50% of income on rent) — very limited rent-growth headroom before tenants either downsize or default.
Forward outlook
- Local home prices are declining (-3.0%/yr); year-one equity from $2k of loan paydown is wiped out by about $8k of value loss. Plan a longer hold.
- Davidson County population projected at +42% by 2050 — long-run rental-demand tailwind backs the buy-and-hold thesis.
Negotiation context
- Only 8 days on market — expect competitive offers; lowballing is unlikely to land.
Risks & watch-outs
- Watch-outs: property tax is 3.0% of price; flood insurance adds $66/mo.
- Climate carrying-cost: major flood risk; extreme-heat days projected 7→20/yr by 2055 (HVAC capex compounding) — expect insurance premiums to compound above CPI over the hold.
Questions for the listing agent
- Built in 1968 — when were the roof, HVAC, electrical panel, plumbing, and water heater last replaced?
- Property tax is high relative to price — has the assessment been appealed recently, and will the sale trigger a re-assessment?
- What's the actual annual flood-insurance premium (NFIP or private), and is the property in a SFHA with mandatory coverage?
- Is there a deadline driving the sale (1031 exchange, divorce, estate, relocation)? That informs how much negotiation room exists.
- The area grade is low — what's the realistic commute time and amenity access for the typical tenant pool here? Any planned neighborhood developments (good or bad) we should know about?
- What's the average days-on-market for RENTAL listings here right now (not sales)? A rising rental-DOM trend means longer vacancies and softer asking-rent achievability than the comps imply.
- What's the recent tenant-quality profile in this submarket — average credit score on applications, eviction rate, late-payment / NSF rate, and stable-employment percentage? A property-management company in the area should have these aggregated.
- How much new for-sale + rental construction is in the pipeline within 1–3 miles? Heavy new supply typically softens prices + rents 12–24 months out; constrained supply supports both.
Investment metrics
- 1% rule
- 1.08% ✓
- Cap rate
- 6.82%
- Cash-on-cash
- 1.89%
- DSCR
- 1.08
- GRM
- 7.7
CMA / ARV
- ARV (on-the-fly)
- $566,100
- Comps found
- 12
Show comp detail 12 sales within ~0.75 mi
| Address | Dist | Beds/Ba | Sqft | Sold | Price | $/sf | Match |
|---|---|---|---|---|---|---|---|
| 1308 Montgomery Ave #7 | 0.11mi | 4/4.0 | 1,703 (+0%) | 10mo | $499,000 | $293 | 78 |
| 1308 Montgomery Ave #6 | 0.11mi | 4/4.0 | 1,731 (+2%) | 8mo | $650,000 | $376 | 77 |
| 602 Douglas Ave | 0.14mi | 3/2.5 (-1) | 1,803 (+6%) | 18mo | $550,000 | $305 | 62 |
| 412 Douglas Ave | 0.24mi | 4/3.5 | 1,806 (+6%) | 15mo | $581,500 | $322 | 60 |
| 408 Douglas Ave | 0.25mi | 3/3.5 (-1) | 1,600 (-6%) | 12mo | $595,000 | $372 | 58 |
| 406 Douglas Ave Unit B | 0.26mi | 3/2.5 (-1) | 1,541 (-9%) | 13mo | $495,000 | $321 | 54 |
| 1414B Stainback Ave | 0.47mi | 3/2.5 (-1) | 1,660 (-2%) | 16mo | $470,000 | $283 | 54 |
| 864 Seymour Ave | 0.55mi | 3/2.5 (-1) | 1,566 (-8%) | 3mo | $550,000 | $351 | 52 |
| 862 Seymour Ave | 0.54mi | 3/2.5 (-1) | 1,566 (-8%) | 5mo | $550,000 | $351 | 50 |
| 856 Seymour Ave | 0.53mi | 3/2.5 (-1) | 1,566 (-8%) | 8mo | $550,000 | $351 | 49 |
| 844 Cherokee Ave #10 | 0.59mi | 3/3.5 (-1) | 1,820 (+7%) | 3mo | $395,000 | $217 | 47 |
| 1519 Meridian St #1 | 0.70mi | 4/4.0 | 1,789 (+5%) | 18mo | $595,000 | $333 | 36 |
Match score weights: distance 35% · size 25% · config 20% · recency 20%. Top-matched comps best support the ARV.
Projected returns pro-forma
-3.0% appreciation · 1.33% rent growth · sell at horizon
- IRR
- -17.1%
- Equity multiple
- 0.41×
- Total profit
- $-46,468
- Equity at exit
- $41,749
- IRR
- -13.0%
- Equity multiple
- 0.30×
- Total profit
- $-54,503
- Equity at exit
- $24,209
Cash invested: $78,400 (down + closing). Projections, not guarantees.
Landlord ↔ Tenant lean methodology
- Overall (STATE)
- 87 Strongly Landlord-Friendly
- State Tennessee
- 87 Strongly Landlord-Friendly · R+13
- County
- — inherits STATE
- City
- — inherits STATE
ZIP-level market 37207
- Home prices YoY
- -27.8%
- Rents YoY
- 1.3%
- Active inventory
- 535
- Price-to-rent
- 7.7×
Monthly cashflow live
- Estimated rent
- $3,035 high interval (Pro) →
- Mortgage (P&I)
- −$1,468
- Tax from tax record
- −$689 /mo · $8,273/yr
- Insurance
- −$117
- Flood insurance flood zone
- −$66 /mo · $798/yr
- HOA
- −$0
- Vacancy / Maint / Mgmt
- −$637
- Net cashflow
- $57
Break-even live
UW: 25.0% down · 7.5% · 30yr · 1.5% tax · 5.0% vac · 8.0% maint · 8.0% mgmt
Financing live
Cash to close
- Down payment
- $70,000
- Closing costs
- $8,400
- Reserves months
- —
- Total cash needed
- —
Loan-product check · same deal, 3 products live
Conventional
25% down · 7.5% · 30yr
- Down + closing
- —
- Monthly P&I
- —
- Monthly cashflow
- —
- DSCR
- —
- Eligible?
- —
Personal DTI + credit; lowest rate.
DSCR
20% down · 8.5% · 30yr
- Down + closing
- —
- Monthly P&I
- —
- Monthly cashflow
- —
- DSCR
- —
- Eligible?
- —
No personal income docs; deal must DSCR.
Hard money
10% down · 12.0% · 12mo
- Down + closing
- —
- Monthly P&I
- —
- Monthly cashflow
- —
- DSCR
- —
- Eligible?
- —
Short-term bridge; refi at stabilization.
Rent comps 40 comps
| Address | Beds | Baths | Sqft | Rent | $/sqft | DOM | Units | Dist |
|---|---|---|---|---|---|---|---|---|
| 1302A Montgomery Ave Nashville, TN | 3.0 | 3.5 | 1937 | $2,773 | $1.43 | 14d | 1 | 0.10mi |
| 738 Douglas Ave Unit 1051756P Nashville, TN | 4.0 | 3.0 | 1969 | $7,391 | $3.75 | 16d | 1 | 0.14mi |
| 862 W Sharpe Ave #4 Nashville, TN | 3.0 | 3.5 | 1646 | $2,895 | $1.76 | 23d | 1 | 0.24mi |
| 1305 Lischey Ave Nashville, TN | 3.0 | 3.0 | 2199 | $3,500 | $1.59 | 17d | 1 | 0.27mi |
| 1018 N 6th St Nashville, TN | 3.0 | 2.0 | 1476 | $2,995 | $2.03 | 14d | 1 | 0.37mi |
| 1018 N 6th St Nashville, TN | 3.0 | 2.0 | 1476 | $2,995 | $2.03 | 14d | 1 | 0.37mi |
| 1201 Stainback Ave Nashville, TN | 3.0 | 3.0 | 2062 | $3,400 | $1.65 | 23d | 1 | 0.39mi |
| 2424 Inga St Nashville, TN | 3.0 | 2.0 | 1440 | $2,495 | $1.73 | 16d | 1 | 0.46mi |
| 310 Evanston Ave Nashville, TN | 3.0 | 2.5 | 1770 | $2,850 | $1.61 | 14d | 1 | 0.52mi |
| 1205 Meridian St Nashville, TN | 3.0 | 2.0 | 1152 | $2,100 | $1.82 | 7d | 1 | 0.52mi |
| 942 Strouse Ave Unit B Nashville, TN | 3.0 | 2.5 | 1800 | $2,800 | $1.56 | 11d | 1 | 0.52mi |
| 927 Chickasaw Ave Nashville, TN | 3.0 | 2.0 | 1223 | $2,600 | $2.13 | 17d | 1 | 0.54mi |
| 303 Gatewood Ave Nashville, TN | 3.0 | 2.0 | 2160 | $2,999 | $1.39 | 23d | 1 | 0.59mi |
| 402 Cleveland St Unit 1312354P Nashville, TN | 4.0 | 4.5 | 2174 | $7,677 | $3.53 | 7d | 1 | 0.63mi |
| 504 Edwin St #18 Nashville, TN | 4.0 | 3.5 | 2002 | $3,495 | $1.75 | 23d | 1 | 0.65mi |
| 504 Edwin St #18 Nashville, TN | 4.0 | 3.5 | 2002 | $3,495 | $1.75 | 3d | 1 | 0.65mi |
| 1806 Lischey Ave #1 Nashville, TN | 3.0 | 3.0 | 1800 | $4,800 | $2.67 | 23d | 1 | 0.66mi |
| 1806 Lischey Ave #3 Nashville, TN | 3.0 | 3.0 | 1800 | $2,895 | $1.61 | 23d | 1 | 0.66mi |
| 3060 Edwin Cir Nashville, TN | 3.0 | 3.0 | 2070 | $2,995 | $1.45 | 4d | 1 | 0.67mi |
| 3060 Edwin Cir Nashville, TN | 3.0 | 3.0 | 2070 | $3,200 | $1.55 | 17d | 1 | 0.67mi |
| 121 Lucile St Nashville, TN | 4.0 | 4.5 | 2203 | $3,573 | $1.62 | 23d | 1 | 0.68mi |
| 901 Cherokee Ave Nashville, TN | 3.0 | 1.0–2.0 | 1457 | $3,563 | $2.45 | 2d | 12 | 0.69mi |
| 1004 Cahal Ave Nashville, TN | 3.0 | 2.0 | 1829 | $2,700 | $1.48 | 12d | 1 | 0.70mi |
| 900 Meridian St #1 Nashville, TN | 3.0 | 3.5 | 2150 | $2,995 | $1.39 | 19d | 1 | 0.73mi |
| 1005 W Eastland Ave Nashville, TN | 4.0 | 2.5 | 2200 | $3,850 | $1.75 | 7d | 1 | 0.73mi |
| 1221 Joseph Ave Nashville, TN | 3.0 | 2.5 | 1600 | $2,800 | $1.75 | 21d | 1 | 0.73mi |
| 1036 Seymour Ave Unit B Nashville, TN | 4.0 | 2.0 | 2000 | $2,695 | $1.35 | 4d | 1 | 0.75mi |
| 1036 Seymour Ave Unit A Nashville, TN | 3.0 | 2.0 | 1719 | $2,545 | $1.48 | 4d | 1 | 0.75mi |
| 947 Cahal Ave Nashville, TN | 3.0 | 2.0 | 2123 | $3,500 | $1.65 | 23d | 1 | 0.77mi |
| 1112 Joseph Ave Unit A Nashville, TN | 3.0 | 2.0 | 1224 | $2,800 | $2.29 | 4d | 1 | 0.80mi |
| 1111 McKennie Ave Unit A Nashville, TN | 3.0 | 2.5 | 2101 | $3,200 | $1.52 | 23d | 1 | 0.82mi |
| 1002 Fairwin Ave Nashville, TN | 3.0 | 2.0 | 1437 | $3,300 | $2.30 | 23d | 1 | 0.82mi |
| 1002 Fairwin Ave Unit 1 Nashville, TN | 4.0 | 2.0 | 1442 | $3,300 | $2.29 | 23d | 1 | 0.82mi |
| 1101 Petway Ave Nashville, TN | 3.0 | 2.5 | 1528 | $2,900 | $1.90 | 17d | 1 | 0.83mi |
| 915 Delmas Ave Unit B Nashville, TN | 3.0 | 2.5 | 1888 | $3,023 | $1.60 | 7d | 1 | 0.83mi |
| 115 Elmhurst Ave Nashville, TN | 4.0 | 3.0 | 2016 | $3,995 | $1.98 | 14d | 1 | 0.88mi |
| 115 Elmhurst Ave Nashville, TN | 4.0 | 3.0 | 2016 | $3,995 | $1.98 | 23d | 1 | 0.88mi |
| 2810 Gear St Nashville, TN | 3.0 | 5.5 | 2200 | $3,250 | $1.48 | 17d | 1 | 0.89mi |
| 917B Spain Ave Nashville, TN | 3.0 | 3.0 | 1428 | $2,450 | $1.72 | 4d | 1 | 0.90mi |
| 921 Spain Ave Nashville, TN | 4.0 | 3.0 | 1850 | $3,250 | $1.76 | 13d | 1 | 0.91mi |
Listing history 8 events
-
2026-06-18days on market $279,999 Active 8 DOM
-
2026-06-17days on market $279,999 Active 7 DOM
-
2026-06-16days on market $279,999 Active 6 DOM
-
2026-06-15days on market $279,999 Active 5 DOM
-
2026-06-13days on market $279,999 Active 3 DOM
-
2026-06-13statusdays on market $279,999 Active 2 DOM
-
2026-06-10remarks 495-char remark
-
2026-06-10$279,999 Coming Soon 1 DOM
ⓘ Source: listings_history table (triggers on properties + properties_extension) + one-shot
backfill from property_details.listing_events for pre-trigger history.
Tax reassessment forecast TN · Resets to sale price
- Current annual tax
- $8,273 · $689/mo
- Projected year-2 tax
- $8,273 · $689/mo
- Expected delta
- $0/yr ($0/mo · 0.0%)
ⓘ Screening estimate from a state-policy table — verify with the county assessor before closing.
Climate risk First Street
- Flood 7/10 Severe FEMA zone X (unshaded) · 99% chance over 30 yrs
- Wildfire 1/10 Low
- Heat 6/10 Major 7 d/yr ≥106°F today · 20 d/yr by 30 yrs out
- Wind 4/10 Moderate 9% chance of damaging wind over 30 yrs
- Air quality 2/10 Low 1 unhealthy d/yr today · 2 by 30 yrs out
Nearby sold comps map
Loading sold comps map…
Walkable amenities ~0.75 mi
Loading nearby amenities…
Taxation est. · year 1
- Rental income
- $36,423
- − Mortgage interest
- −$15,684
- − Property taxes
- −$8,273
- − Insurance
- −$2,197
- − Repairs & maintenance
- −$2,914
- − Management
- −$2,914
- − Depreciation
- −$8,145
- Taxable loss
- −$3,705
- Est. tax savings @ 24.0%
- +$889
- After-tax cash flow
- $1,572/yr
For passive investors: Depreciation is non-cash, so a rental often shows a tax loss while cash-flowing — sheltering income. Rental losses are passive: they offset passive income freely, and up to $25,000/yr can offset ordinary (W-2) income if you actively participate and your MAGI is under $100k (phasing out to $0 by $150k); unused losses carry forward. On sale, claimed depreciation is recaptured at up to 25%, and gains may owe capital-gains tax (a 1031 exchange can defer both). Figures are a year-1 estimate at your 24.0% rate — not tax advice; consult a CPA.
Schools (NCES district)
- District
- Davidson County
- NCES district ID
- 4703180
- Math proficiency
- 12% ▼ -17.00%
- Reading proficiency
- 19% ▼ -7.00%
- Median HH income
- $48,667
- Composite
- 14.03/100
- National rank
- #9472
- State rank
- #126 of 139 in TN
Livability — Nashville-Davidson metropolitan government (balance)
No livability data for this city. (Only ~50 U.S. cities are tracked.)
Census & demographics
- Census place
- Nashville-Davidson metropolitan government (balance), TN
- County
- Davidson County · 680,067 people
- City population
- 677,595
- Metro
- Nashville-Davidson--Murfreesboro--Franklin, TN
- Population (ZIP)
- 41,366
- Household income
- $61,744
- Rent vs Own
- Severe rent burden
- 1969.0
Population outlook (Davidson County) Hauer SSP2
- Today (2025)
- 808,568 people
- By 2030
- 874,489 · +8.2%
- By 2040
- 1,009,046 · +24.8%
- By 2050
- 1,147,294 · +41.9%
- By 2075
- 1,475,439 · +82.5%
- By 2100
- 1,714,101 · +112.0%
Race, ethnicity, and origin ACS 2023
- Neighborhood character
- Diverse neighborhood (Simpson 0.60)
- Race & ethnicity
- Black 57% White 24% Hispanic / Latino 13% Two or more races 8%
- Hispanic origin (detail)
- Mexican 6%
- Common ancestry
- Slovak 2% Serbian 1% Romanian 1%
- Foreign-born
- 10% · Canada, Jamaica
- Languages at home
- 88% English-only · Spanish 10%
Political lean MEDSL · Davidson
- 2024 margin
- Strong D (+27.4) · D 62.7% · R 35.3% · Other 2.0%
- 2008→2024 swing
- +6.5pp toward D · 2008: 21.0pp · 2024: 27.4pp
- All cycles
- 2024: D+27.4 2020: D+32.1 2016: D+26.0 2012: D+18.7 2008: D+21.0
Not yet ingested
- Civics
- —
Market trends
- HPI YoY
- ▼ -135.21%
- Current HPI
- 351.9628
- Rent YoY
- ▲ 1.33%
- Metro
- Nashville-Davidson--Murfreesboro--Franklin, TN
- State GDP YoY
- ▲ 2.78%
- F500 in state
- 22
Industry mix (Fortune 500 HQ in TN)
| Industry | F500 HQs | Revenue |
|---|---|---|
| Healthcare | 3 | $91B |
|
||
| Retail | 3 | $72B |
|
||
| Transportation / Logistics | 1 | $88B |
|
||
| Paper / Packaging | 1 | $19B |
|
||
| Insurance | 1 | $13B |
|
||
| Energy | 1 | $12B |
|
||
Price history
+273.3% since first listed8 events — show timeline
- 2026-06-09 Coming Soon $279,999 REALTRACS as Distributed by MLS Grid
- 2026-06-09 Coming Soon $1,065,000 REALTRACS as Distributed by MLS Grid
- 2025-09-18 Sold (Public Records) $700,922 Public Records
- 2010-03-02 Sold (Public Records) $900,000 Public Records
- 1995-05-17 Sold (Public Records) $69,000 Public Records
- 1995-05-10 Sold (Public Records) $55,000 Public Records
- 1984-05-01 Sold (Public Records) $124,000 Public Records
- 1984-05-01 Sold (Public Records) $75,000 Public Records
Property tax history
+9.1%/yrLatest (2025): $8,273 · +19.7% YoY. Source: county tax records.
Cash-flow waterfall
monthlySold comps — $/sqft
last 12 mo · ≤1 miLoading sold comps…