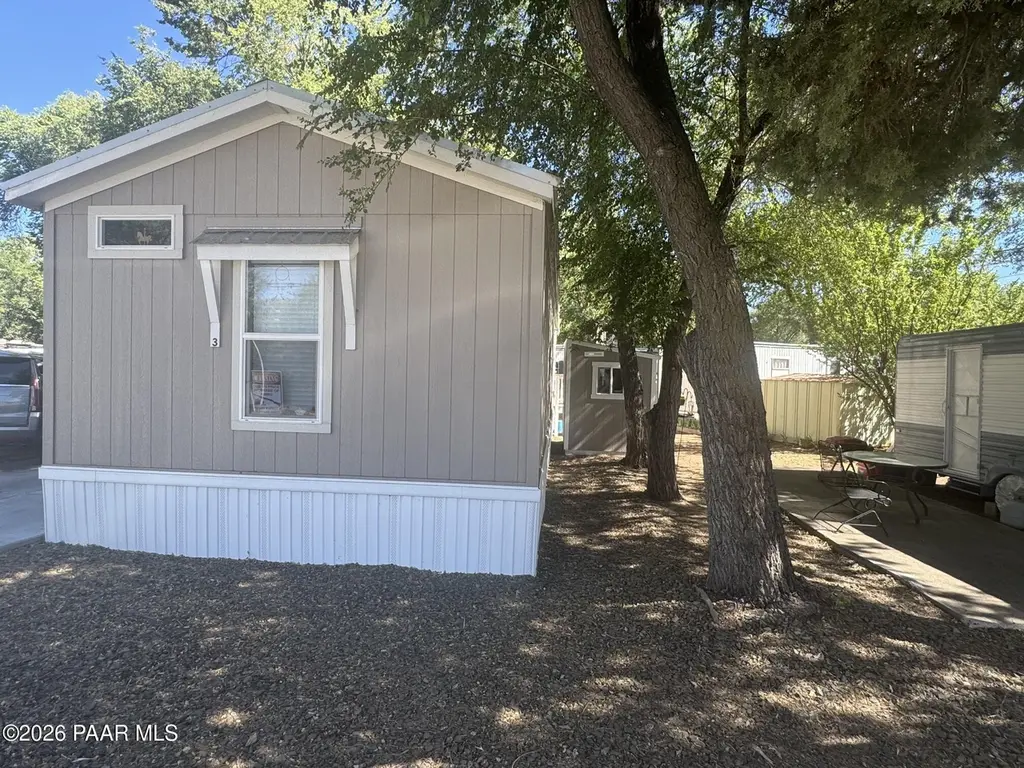
1305 Adams Ave #3 · Prescott, AZ
Flood risk 1/10 · Minimal
- FEMA flood zone
- X (unshaded)
- Chance of flooding over 30 yrs
- 0.0%
- Est. flood insurance / yr
- $507 – $1,088
Fire risk 6/10 · Moderate
- Est. fire insurance / yr
- $610 – $1,132
Heat risk 3/10 · Minor
- Hot days now (above 91°F)
- 7 days/yr
- Hot days in 30 yrs
- 18 days/yr
Wind risk 1/10 · Minimal
- Chance of severe wind over 30 yrs
- —
Air-quality risk 1/10 · Minimal
- Unhealthy air days now
- 0 days/yr
- Unhealthy air days in 30 yrs
- 0 days/yr
Risk factors via First Street. Map © Google.
Why this score? — see what drove the C grade
The composite is a weighted blend of 9 inputs, each scored 0–100. Each bar is that input's sub-score; the figure is the points it added to the 100-point composite (weight × sub-score).
- Cash flow +29.1/30.0
- DSCR +10.0/10.0
- 1% rule +8.1/10.0
- Livability +3.7/5.0
- Schools +3.3/10.0
- Rent growth +2.8/5.0
- Condition / age +2.5/5.0
- ARV discount +0.0/15.0
- Appreciation +0.0/10.0
$122,900
🖨 Deal sheet 📄 Offer letter ✓ Due diligence
Listing remarks MLS
Looking for that new 2023 Home in Prescott that is affordable? This 16 X 56, 890 Sq. Ft islocated in Shady Acres in Prescott! Land is leased $525 Month. Stainless steel appliances andready to move in and start enjoying.Close to Medical, Hospital, Shopping, Downtown Prescott, Parks, local lakes and trails. Buyer Must be approved through park management.
Key facts
- Close to parks
- Close to medical
- Huge kitchen island
Tags
Property features AI
Finance
- Other: Zoning: PAD
- HOA & community: Not a senior community; Land lease (lot is leased)
Exterior
- Parking: Driveway parking
- Utilities: Public water; City sewer; Electricity available; Natural gas available; Natural gas water heater
- Home design: Manufactured single-wide home; One story
- Construction: Frame construction; Composition roof; Piers foundation; Double-pane windows; Built area approximately 896
- Exterior features: Concrete driveway; Shed(s); Level lot; Private maintained road frontage
Interior
- Kitchen: Dishwasher; Gas range; Refrigerator
- Flooring: Carpet; Laminate
- Bathrooms: 1 full bathroom; 1 three-quarter bathroom (2 total bathrooms)
- Heating & cooling: Forced gas heating; Central air; Ceiling fans; Other cooling
- Interior features: Eat-in kitchen with kitchen island and laminate counters; Kitchen/dining combo and living/dining combo; Washer/dryer connection; Storage room
- Laundry & utility: Washer; Dryer; Washer and dryer connection
Neighborhood map
What this means for you Summary
Snapshot
- This is a 2-bed/2.0-bath manufactured listed at $123k.
Deal economics
- At list price, monthly cash flow is $425 ($5k/yr) — positive.
- The deal already cash-flows at list — no discount required.
- Meets the 1% rule at list price ($2k rent vs $123k).
- Cap rate 10.4% vs local median 2.4% in Prescott — top-decile yield for the area; either an underpriced asset or a hidden risk that comps aren't pricing in. Stress-test before assuming the spread holds.
Location & tenants
- Location reads 73/100 on livability (#22 in AZ) — a middle-class / working-renter tenant base. Strengths: health & safety A+, amenities A, schools A-; Watch: cost of living D, commute F.
- Prescott Unified District (4466) (urban): math 34% / reading 44% proficiency, ranked #70 of 249 in AZ (top 28%) — families likely to look elsewhere, expect single-tenant / working-renter base with shorter leases.
- Market conditions: Rents rising (+1.0%/yr); 707 active listings in the ZIP; 12 comparable units currently listed for rent nearby; rentals lingering (median 44d on market — plan ~5-8 weeks vacancy on turnover, expect pricing pressure); 67% of comp listings sitting > 30 days — soft ceiling on asking rent; solid renter incomes; 2,062 units permitted in Yavapai County in 2024 (98 in 5+ unit buildings).
Forward outlook
- Local home prices are declining (-3.0%/yr); year-one equity from $850 of loan paydown is wiped out by about $4k of value loss. Plan a longer hold.
- Yavapai County population projected at +10% by 2050 — modest demand growth; plan on rents tracking national, not racing it.
- At projected returns (-3.0% appreciation + 1.0% rent growth), your $34k cash investment doubles in ~10 years — after that, you're playing with house money.
Negotiation context
- Only 8 days on market — expect competitive offers; lowballing is unlikely to land.
- 3 sale attempts since 3y ago with the ask held roughly flat each time — persistent listings suggest the price (not the market) is what's stuck; bring a comps-based counter.
Risks & watch-outs
- Climate carrying-cost: major wildfire risk — expect insurance premiums to compound above CPI over the hold.
Questions for the listing agent
- Is there a deadline driving the sale (1031 exchange, divorce, estate, relocation)? That informs how much negotiation room exists.
- Schools are A-rated — typically a magnet for longer-tenancy family renters. What's the average tenant stay here, and is there a school-zone premium baked into asking?
- What's the average days-on-market for RENTAL listings here right now (not sales)? A rising rental-DOM trend means longer vacancies and softer asking-rent achievability than the comps imply.
- What's the recent tenant-quality profile in this submarket — average credit score on applications, eviction rate, late-payment / NSF rate, and stable-employment percentage? A property-management company in the area should have these aggregated.
- How much new for-sale + rental construction is in the pipeline within 1–3 miles? Heavy new supply typically softens prices + rents 12–24 months out; constrained supply supports both.
Investment metrics
- 1% rule
- 1.31% ✓
- Cap rate
- 10.44%
- Cash-on-cash
- 14.81%
- DSCR
- 1.66
- GRM
- 6.4
CMA / ARV
- ARV (on-the-fly)
- $84,224
- Comps found
- 4
Show comp detail 4 sales within ~0.75 mi
| Address | Dist | Beds/Ba | Sqft | Sold | Price | $/sf | Match |
|---|---|---|---|---|---|---|---|
| 1305 W Adams Ave #78 | 0.00mi | 2/2.0 | 896 (0%) | 17mo | $83,900 | $94 | 86 |
| 1305 Adams Ave #54 | 0.00mi | 2/2.0 | 896 (0%) | 20mo | $134,000 | $150 | 84 |
| 960 Peace Lane -- #55 | 0.52mi | 2/1.0 | 880 (-2%) | 8mo | $40,000 | $45 | 62 |
| 960 Peace Ln #62 | 0.52mi | 2/1.0 | 950 (+6%) | 7mo | $54,900 | $58 | 56 |
Match score weights: distance 35% · size 25% · config 20% · recency 20%. Top-matched comps best support the ARV.
Projected returns pro-forma
-3.0% appreciation · 1.01% rent growth · sell at horizon
- IRR
- 3.1%
- Equity multiple
- 1.12×
- Total profit
- $3,996
- Equity at exit
- $18,325
- IRR
- 10.6%
- Equity multiple
- 1.75×
- Total profit
- $25,929
- Equity at exit
- $10,626
Cash invested: $34,412 (down + closing). Projections, not guarantees.
Landlord ↔ Tenant lean methodology
- Overall (STATE)
- 87 Strongly Landlord-Friendly
- State Arizona
- 87 Strongly Landlord-Friendly · R+3
- County
- — inherits STATE
- City
- — inherits STATE
ZIP-level market 86305
- Home prices YoY
- -18.7%
- Rents YoY
- 1.0%
- Active inventory
- 707
- Price-to-rent
- 6.4×
Monthly cashflow live
- Estimated rent
- $1,613 high interval (Pro) →
- Mortgage (P&I)
- −$645
- Tax est. 1.5%
- −$154 /mo · $1,844/yr
- Insurance
- −$51
- HOA
- −$0
- Vacancy / Maint / Mgmt
- −$339
- Net cashflow
- $425
Break-even live
UW: 25.0% down · 7.5% · 30yr · 1.5% tax · 5.0% vac · 8.0% maint · 8.0% mgmt
Financing live
Cash to close
- Down payment
- $30,725
- Closing costs
- $3,687
- Reserves months
- —
- Total cash needed
- —
Loan-product check · same deal, 3 products live
Conventional
25% down · 7.5% · 30yr
- Down + closing
- —
- Monthly P&I
- —
- Monthly cashflow
- —
- DSCR
- —
- Eligible?
- —
Personal DTI + credit; lowest rate.
DSCR
20% down · 8.5% · 30yr
- Down + closing
- —
- Monthly P&I
- —
- Monthly cashflow
- —
- DSCR
- —
- Eligible?
- —
No personal income docs; deal must DSCR.
Hard money
10% down · 12.0% · 12mo
- Down + closing
- —
- Monthly P&I
- —
- Monthly cashflow
- —
- DSCR
- —
- Eligible?
- —
Short-term bridge; refi at stabilization.
Rent comps 12 comps
| Address | Beds | Baths | Sqft | Rent | $/sqft | DOM | Units | Dist |
|---|---|---|---|---|---|---|---|---|
| 1717 Cottonwood Ave Prescott, AZ | 1.0 | 1.0 | 600 | $1,300 | $2.17 | 13d | 1 | 0.41mi |
| 1668 W Iron Springs Rd Prescott, AZ | 1.0–2.0 | 1.0–2.0 | 719 | $1,700 | $2.36 | 13d | 4 | 0.45mi |
| 780 Gail Gardner Way Unit 5 Prescott, AZ | 2.0 | 1.0 | 887 | $1,550 | $1.75 | 44d | 1 | 0.76mi |
| 720 N Walnut St Unit 15 Prescott, AZ | 2.0 | 2.0 | 1082 | $2,150 | $1.99 | 44d | 1 | 1.05mi |
| 635 Dameron Dr Apt 1 Prescott, AZ | 2.0 | 1.0 | 850 | $1,150 | $1.35 | 13d | 1 | 1.32mi |
| 301 W Merritt St Unit 303-A Prescott, AZ | 2.0 | 1.0 | 650 | $1,250 | $1.92 | 21d | 1 | 1.36mi |
| 628 1st St Apt 2C Prescott, AZ | 1.0 | 1.0 | 840 | $1,100 | $1.31 | 44d | 1 | 1.44mi |
| 603 Campbell St Apt 01 Prescott, AZ | 2.0 | 1.0 | 720 | $1,000 | $1.39 | 44d | 1 | 1.46mi |
| 601 Campbell St Apt 3 Prescott, AZ | 2.0 | 1.0 | 720 | $1,000 | $1.39 | 44d | 1 | 1.46mi |
| 538 Lincoln Ave Unit 1A'VACATION Prescott, AZ | 3.0 | 2.0 | 1000 | $2,000 | $2.00 | 44d | 1 | 1.47mi |
| 538 Lincoln Ave Unit 2C'VACATION Prescott, AZ | 2.0 | 1.0 | 850 | $1,750 | $2.06 | 44d | 1 | 1.47mi |
| 538 Lincoln Ave Unit 2A'VACATION Prescott, AZ | 2.0 | 1.0 | 850 | $1,850 | $2.18 | 44d | 1 | 1.47mi |
Listing history 7 events
-
2026-06-18days on market $122,900 Active 8 DOM
-
2026-06-17days on market $122,900 Active 7 DOM
-
2026-06-16days on market $122,900 Active 6 DOM
-
2026-06-15days on market $122,900 Active 5 DOM
-
2026-06-14days on market $122,900 Active 3 DOM
-
2026-06-13remarks 511-char remark
-
2026-06-13$122,900 Active 2 DOM
ⓘ Source: listings_history table (triggers on properties + properties_extension) + one-shot
backfill from property_details.listing_events for pre-trigger history.
Climate risk First Street
- Flood 1/10 Low FEMA zone X (unshaded) · 0% chance over 30 yrs
- Wildfire 6/10 Major
- Heat 3/10 Moderate 7 d/yr ≥91°F today · 18 d/yr by 30 yrs out
- Wind 1/10 Low
- Air quality 1/10 Low 0 unhealthy d/yr today · 0 by 30 yrs out
Nearby sold comps map
Loading sold comps map…
Walkable amenities ~0.75 mi
Loading nearby amenities…
Taxation est. · year 1
- Rental income
- $19,353
- − Mortgage interest
- −$6,884
- − Property taxes
- −$1,844
- − Insurance
- −$614
- − Repairs & maintenance
- −$1,548
- − Management
- −$1,548
- − Depreciation
- −$3,575
- Taxable income
- $3,339
- Est. tax owed @ 24.0%
- −$801
- After-tax cash flow
- $4,296/yr
For passive investors: Depreciation is non-cash, so a rental often shows a tax loss while cash-flowing — sheltering income. Rental losses are passive: they offset passive income freely, and up to $25,000/yr can offset ordinary (W-2) income if you actively participate and your MAGI is under $100k (phasing out to $0 by $150k); unused losses carry forward. On sale, claimed depreciation is recaptured at up to 25%, and gains may owe capital-gains tax (a 1031 exchange can defer both). Figures are a year-1 estimate at your 24.0% rate — not tax advice; consult a CPA.
Schools (NCES district)
- District
- Prescott Unified District (4466)
- NCES district ID
- 0406730
- Math proficiency
- 34% ▼ -16.00%
- Reading proficiency
- 44% ▼ -13.00%
- Median HH income
- $48,354
- Composite
- 33.47/100
- National rank
- #5450
- State rank
- #70 of 249 in AZ
Livability — Prescott
- Score
- 73/100
- State rank
- #22
- US rank
- #5579
Category grades
Schools grade is shown separately in the Schools card above.
Census & demographics
- Census place
- Prescott, AZ
- County
- Yavapai County · 190,406 people
- City population
- 66,312
- Metro
- Prescott Valley-Prescott, AZ
- Population (ZIP)
- 19,790
- Household income
- $80,436
- Rent vs Own
- Severe rent burden
- 380.0
Population outlook (Yavapai County) Hauer SSP2
- Today (2025)
- 241,389 people
- By 2030
- 249,523 · +3.4%
- By 2040
- 259,966 · +7.7%
- By 2050
- 264,736 · +9.7%
- By 2075
- 269,334 · +11.6%
- By 2100
- 256,505 · +6.3%
Race, ethnicity, and origin ACS 2023
- Neighborhood character
- Predominantly White (86%)
- Race & ethnicity
- White 86% Hispanic / Latino 8% Two or more races 6% Asian 1%
- Hispanic origin (detail)
- Mexican 5% Puerto Rican 2%
- Common ancestry
- Slovak 4% Italian 3% Lithuanian 3%
- Foreign-born
- 4% · Canada
- Languages at home
- 95% English-only · Spanish 3%
Political lean MEDSL · Yavapai
- 2024 margin
- Solid R (+33.9) · D 32.6% · R 66.5%
- 2008→2024 swing
- -9.5pp toward R · 2008: -24.4pp · 2024: -33.9pp
- All cycles
- 2024: R+33.9 2020: R+29.3 2016: R+31.4 2012: R+30.7 2008: R+24.4
Not yet ingested
- Civics
- —
Market trends
- HPI YoY
- ▼ -80.31%
- Current HPI
- 348.5199
- Rent YoY
- ▲ 1.01%
- Metro
- Prescott Valley-Prescott, AZ
- State GDP YoY
- ▲ 4.54%
- F500 in state
- 20
Industry mix (Fortune 500 HQ in AZ)
| Industry | F500 HQs | Revenue |
|---|---|---|
| Technology | 2 | $13B |
|
||
| Mining / Metals | 1 | $23B |
|
||
| Environmental Services | 1 | $16B |
|
||
| Metals / Steel | 1 | $14B |
|
||
| Technology Distribution | 1 | $9B |
|
||
| Homebuilding | 1 | $8B |
|
||
Price history
+0.8% since first listed7 events — show timeline
- 2026-06-10 Listed $122,900 PAARMLS as Distributed by MLS Grid
- 2023-10-31 Sold (MLS) $119,000 PAARMLS as Distributed by MLS Grid
- 2023-10-19 Contingent — PAARMLS as Distributed by MLS Grid
- 2023-08-24 Price Changed $119,900 PAARMLS as Distributed by MLS Grid
- 2023-07-20 Listed $121,500 PAARMLS as Distributed by MLS Grid
- 2023-07-19 Listing Removed — PAARMLS as Distributed by MLS Grid
- 2023-04-20 Listed $121,900 PAARMLS as Distributed by MLS Grid
Cash-flow waterfall
monthlySold comps — $/sqft
last 12 mo · ≤1 miLoading sold comps…