165 Roberts Rd · Tupelo, MS
Flood risk 1/10 · Minimal
- FEMA flood zone
- X (unshaded)
- Chance of flooding over 30 yrs
- 0.0%
- Est. flood insurance / yr
- $507 – $1,088
Fire risk 4/10 · Minor
- Est. fire insurance / yr
- $1,241 – $2,305
Heat risk 6/10 · Moderate
- Hot days now (above 110°F)
- 7 days/yr
- Hot days in 30 yrs
- 21 days/yr
Wind risk 6/10 · Moderate
- Chance of severe wind over 30 yrs
- 27.0%
Air-quality risk 2/10 · Minimal
- Unhealthy air days now
- 0 days/yr
- Unhealthy air days in 30 yrs
- 1 days/yr
Risk factors via First Street. Map © Google.
Why this score? — see what drove the D- grade
The composite is a weighted blend of 9 inputs, each scored 0–100. Each bar is that input's sub-score; the figure is the points it added to the 100-point composite (weight × sub-score).
- Cash flow +7.8/30.0
- ARV discount +7.5/15.0
- Rent growth +4.3/5.0
- Condition / age +4.0/5.0
- Schools +3.8/10.0
- Livability +3.6/5.0
- 1% rule +2.1/10.0
- DSCR +1.9/10.0
- Appreciation +0.0/10.0
$149,900
🖨 Deal sheet (PDF) 📄 Offer letter ✓ Due diligence
Listing remarks MLS
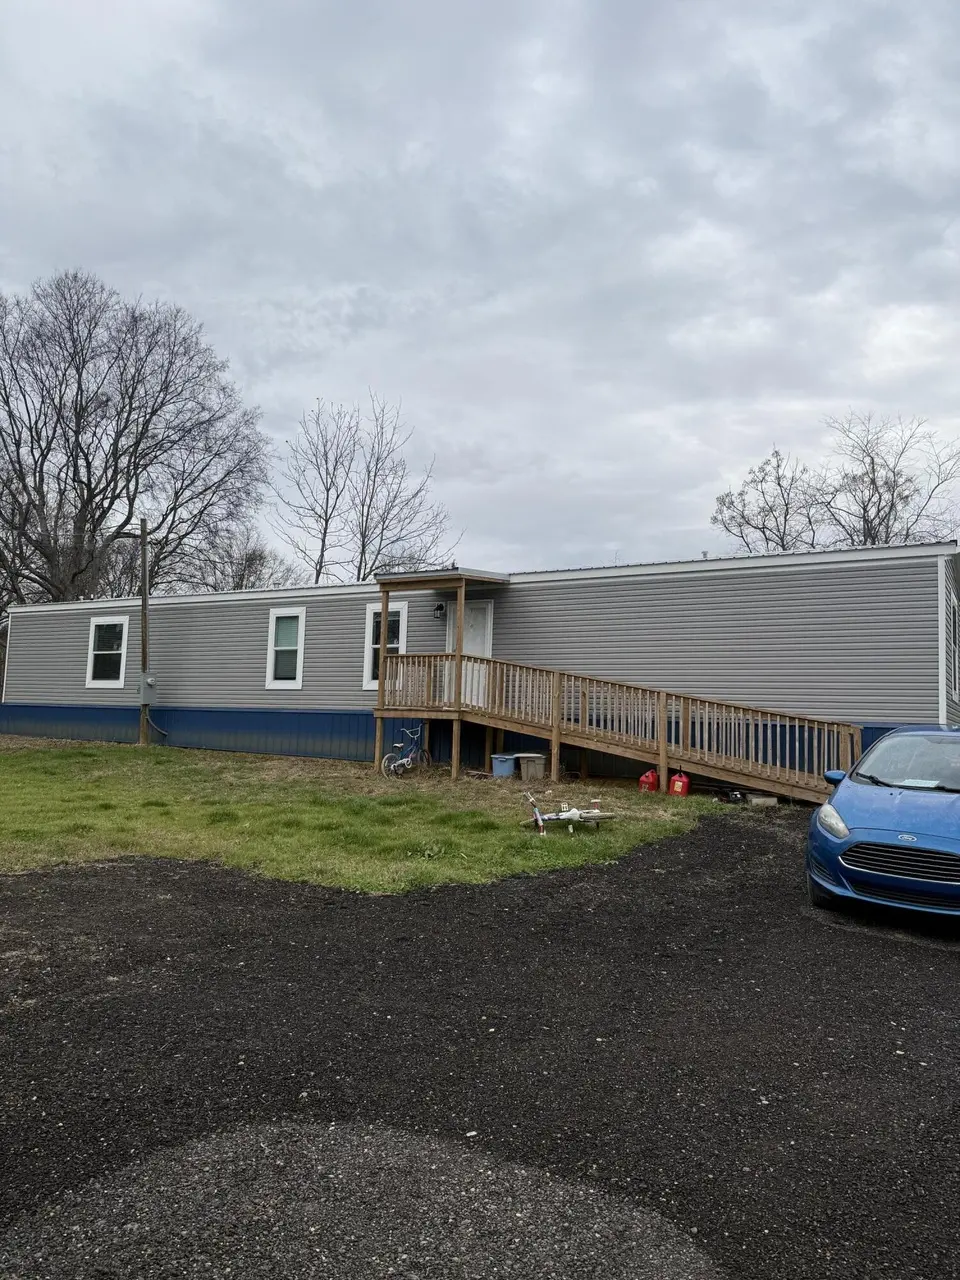
Looking for comfortable living at an unbeatable price? This, like new, single wide is the perfect place to call home. Split floor plan , kitchen is open to the living area. Beautiful front and back wheel chair accessible, porches! Located in a quiet and friendly community with easy access to shopping and dining. Call now before it's gone!
Key facts
- Split floor plan
- 1 acre lot
- Built 2025
Tags
Neighborhood map
What this means for you Summary
Snapshot
- This is a 3-bed/2.0-bath manufactured listed at $150k. Condition is rated good.
Deal economics
- At list price, monthly cash flow is $-164 ($-2k/yr) — negative.
- To cash-flow at today's rent, offer at most $121k (19.3% below list).
- To meet the 1% rule (rent ≥ 1% of price), the offer needs to be $107k (28.6% below list).
- Recommended offer: $107k (28.6% below list) — sets the bar for 1% rule.
Location & tenants
- Location reads 72/100 on livability (#26 in MS) — a middle-class / working-renter tenant base. Strengths: cost of living A+, housing A+, health & safety A-; Watch: amenities D+, employment D+, crime F.
- Pontotoc City Schools (town): math 48% / reading 42% proficiency, ranked #26 of 130 in MS (top 20%) — families likely to look elsewhere, expect single-tenant / working-renter base with shorter leases.
- Zoned schools: Pontotoc Elementary School (613 students, 100% FRL); Pontotoc Junior High School (math 59% / reading 37%, grade C-, #34 of 179 statewide, top 20%, 375 students, 99% FRL); Pontotoc High School (math 27% / reading 42%, grade F, #68 of 197 statewide, top 39%, 659 students, 100% FRL) — zoned schools average 99% FRL vs 58% district-wide (41 pts higher); higher-poverty schools than district average — tighter screening recommended.
- Market conditions: Rents rising fast (+7.3%/yr); 237 active listings in the ZIP; 86 units permitted in Pontotoc County in 2024 (60 in 5+ unit buildings).
Forward outlook
- Local home prices are declining (-3.0%/yr); year-one equity from $1k of loan paydown is wiped out by about $4k of value loss. Plan a longer hold.
- Pontotoc County population projected at +7% by 2050 — modest demand growth; plan on rents tracking national, not racing it.
Negotiation context
- It's been on market 168 days — a 12% lower offer ($132k) is reasonable based on typical stale-listing flexibility.
Risks & watch-outs
- Climate carrying-cost: major wind risk, 27% chance of damaging wind over 30y; extreme-heat days projected 7→21/yr by 2055 (HVAC capex compounding) — expect insurance premiums to compound above CPI over the hold.
Questions for the listing agent
- What do current leases actually rent for vs. the listed asking? Can we see a recent rent roll and the last 12 months of T-12 income?
- It's been on market 168 days. Have you received any prior offers? Is the seller open to a 29% concession, seller financing, or rate buy-down credit?
- Why hasn't it sold? Are there any deal-killer items the seller is aware of (foundation, flood, title, zoning, code violations)?
- Is there a deadline driving the sale (1031 exchange, divorce, estate, relocation)? That informs how much negotiation room exists.
- Crime grade is F in this area — have there been break-ins, vandalism, or insurance claims at this property in the last 3 years? What carrier currently insures it and at what premium?
- The area grade is low — what's the realistic commute time and amenity access for the typical tenant pool here? Any planned neighborhood developments (good or bad) we should know about?
- What's the average days-on-market for RENTAL listings here right now (not sales)? A rising rental-DOM trend means longer vacancies and softer asking-rent achievability than the comps imply.
- What's the recent tenant-quality profile in this submarket — average credit score on applications, eviction rate, late-payment / NSF rate, and stable-employment percentage? A property-management company in the area should have these aggregated.
- How much new for-sale + rental construction is in the pipeline within 1–3 miles? Heavy new supply typically softens prices + rents 12–24 months out; constrained supply supports both.
Investment metrics
- 1% rule
- 0.71% ✗
- Cap rate
- 4.98%
- Cash-on-cash
- -4.68%
- DSCR
- 0.79
- GRM
- 11.7
CMA / ARV
No comps found within radius.
Projected returns pro-forma
-3.0% appreciation · 7.3% rent growth · sell at horizon
- IRR
- -19.7%
- Equity multiple
- 0.29×
- Total profit
- $-29,875
- Equity at exit
- $22,351
- IRR
- -5.5%
- Equity multiple
- 0.58×
- Total profit
- $-17,755
- Equity at exit
- $12,961
Cash invested: $41,972 (down + closing). Projections, not guarantees.
Landlord ↔ Tenant lean methodology
- Overall (STATE)
- 90 Strongly Landlord-Friendly
- State Mississippi
- 90 Strongly Landlord-Friendly · R+11
- County
- — inherits STATE
- City
- — inherits STATE
ZIP-level market 38801
- Home prices YoY
- -20.7%
- Rents YoY
- 7.3%
- Active inventory
- 237
- Price-to-rent
- 11.7×
Monthly cashflow live
- Estimated rent
- $1,071 medium interval (Pro) →
- Mortgage (P&I)
- −$786
- Tax from tax record
- −$161 /mo · $1,931/yr
- Insurance
- −$62
- HOA
- −$0
- Lot rent leased land?
- −$0
- Vacancy / Maint / Mgmt
- −$225
- Net cashflow
- $-164
Break-even live
Sensitivity live
| Price | -10% $-79 | -5% $-121 | +0% $-164 | +5% $-206 | +10% $-248 |
|---|---|---|---|---|---|
| Rent | -10% $-248 | -5% $-206 | +0% $-164 | +5% $-121 | +10% $-79 |
| Rate | -1.0pp $-88 | -0.5pp $-125 | base $-164 | +0.5pp $-202 | +1.0pp $-242 |
UW: 25.0% down · 7.5% · 30yr · 1.5% tax · 5.0% vac · 8.0% maint · 8.0% mgmt
Financing live
Cash to close
- Down payment
- $37,475
- Closing costs
- $4,497
- Reserves months
- —
- Total cash needed
- —
Loan-product check · same deal, 3 products live
Conventional
25% down · 7.5% · 30yr
- Down + closing
- —
- Monthly P&I
- —
- Monthly cashflow
- —
- DSCR
- —
- Eligible?
- —
Personal DTI + credit; lowest rate.
DSCR
20% down · 8.5% · 30yr
- Down + closing
- —
- Monthly P&I
- —
- Monthly cashflow
- —
- DSCR
- —
- Eligible?
- —
No personal income docs; deal must DSCR.
Hard money
10% down · 12.0% · 12mo
- Down + closing
- —
- Monthly P&I
- —
- Monthly cashflow
- —
- DSCR
- —
- Eligible?
- —
Short-term bridge; refi at stabilization.
Listing history 20 events
-
2026-06-22days on market $149,900 Active 168 DOM
-
2026-06-19days on market $149,900 Active 165 DOM
-
2026-06-18days on market $149,900 Active 164 DOM
-
2026-06-17days on market $149,900 Active 163 DOM
-
2026-06-16days on market $149,900 Active 162 DOM
-
2026-06-15days on market $149,900 Active 161 DOM
-
2026-06-14days on market $149,900 Active 159 DOM
-
2026-06-12days on market $149,900 Active 158 DOM
-
2026-06-09days on market $149,900 Active 155 DOM
-
2026-06-08days on market $149,900 Active 154 DOM
-
2026-06-07days on market $149,900 Active 153 DOM
-
2026-06-05days on market $149,900 Active 150 DOM
-
2026-06-03days on market $149,900 Active 149 DOM
-
2026-06-02days on market $149,900 Active 148 DOM
-
2026-06-01days on market $149,900 Active 147 DOM
-
2026-05-31days on market $149,900 Active 146 DOM
-
2026-05-30days on market $149,900 Active 145 DOM
-
2026-04-23price $149,900 341-char remark
Show marketing remark (341 chars)
Looking for comfortable living at an unbeatable price? This, like new, single wide is the perfect place to call home. Split floor plan , kitchen is open to the living area. Beautiful front and back wheel chair accessible, porches! Located in a quiet and friendly community with easy access to shopping and dining. Call now before it's gone!
-
2026-02-25price $155,000 341-char remark
Show marketing remark (341 chars)
Looking for comfortable living at an unbeatable price? This, like new, single wide is the perfect place to call home. Split floor plan , kitchen is open to the living area. Beautiful front and back wheel chair accessible, porches! Located in a quiet and friendly community with easy access to shopping and dining. Call now before it's gone!
-
2026-01-05$179,900 Active 341-char remark
Show marketing remark (341 chars)
Looking for comfortable living at an unbeatable price? This, like new, single wide is the perfect place to call home. Split floor plan , kitchen is open to the living area. Beautiful front and back wheel chair accessible, porches! Located in a quiet and friendly community with easy access to shopping and dining. Call now before it's gone!
ⓘ Source: listings_history table (triggers on properties + properties_extension) + one-shot
backfill from property_details.listing_events for pre-trigger history.
Tax reassessment forecast MS · Resets to sale price
- Current annual tax
- $1,931 · $161/mo
- Projected year-2 tax
- $1,931 · $161/mo
- Expected delta
- $0/yr ($0/mo · 0.0%)
ⓘ Screening estimate from a state-policy table — verify with the county assessor before closing.
Climate risk First Street
- Flood 1/10 Low FEMA zone X (unshaded) · 0% chance over 30 yrs
- Wildfire 4/10 Moderate
- Heat 6/10 Major 7 d/yr ≥110°F today · 21 d/yr by 30 yrs out
- Wind 6/10 Major 27% chance of damaging wind over 30 yrs
- Air quality 2/10 Low 0 unhealthy d/yr today · 1 by 30 yrs out
Nearby sold comps map
Loading sold comps map…
Walkable amenities ~0.75 mi
Loading nearby amenities…
Taxation est. · year 1
- Rental income
- $12,849
- − Mortgage interest
- −$8,397
- − Property taxes
- −$1,931
- − Insurance
- −$750
- − Repairs & maintenance
- −$1,028
- − Management
- −$1,028
- − Depreciation
- −$4,361
- Taxable loss
- −$4,645
- Est. tax savings @ 24.0%
- +$1,115
- After-tax cash flow
- $-848/yr
For passive investors: Depreciation is non-cash, so a rental often shows a tax loss while cash-flowing — sheltering income. Rental losses are passive: they offset passive income freely, and up to $25,000/yr can offset ordinary (W-2) income if you actively participate and your MAGI is under $100k (phasing out to $0 by $150k); unused losses carry forward. On sale, claimed depreciation is recaptured at up to 25%, and gains may owe capital-gains tax (a 1031 exchange can defer both). Figures are a year-1 estimate at your 24.0% rate — not tax advice; consult a CPA.
Condition & rehab AI · 1 photo
This single-wide manufactured home is in excellent condition with no visible repairs needed. It offers a good investment opportunity with potential for minor cosmetic updates to enhance its resale and rental value.
Value-add opportunities
- Both Painting exterior and interior — Enhances curb appeal and interior aesthetics
- Both Landscaping and curb appeal improvements — Enhances curb appeal and makes the home more inviting
- Both New flooring in bathrooms and kitchen — Improves functionality and aesthetics
- Both New paint in interior walls — Enhances interior aesthetics and makes the home more inviting
Renovation cost estimate screening
Value-add ROI direction
- Both Painting exterior and interior — Enhances curb appeal and interior aesthetics ↑
- Both Landscaping and curb appeal improvements — Enhances curb appeal and makes the home more inviting ↑
- Both New flooring in bathrooms and kitchen — Improves functionality and aesthetics ↑
- Both New paint in interior walls — Enhances interior aesthetics and makes the home more inviting ↑
ⓘ Cost ranges are severity-bucket heuristics (US national rule-of-thumb). Get contractor quotes + a written scope before underwriting a rehab budget.
Schools (NCES district)
- District
- Pontotoc City Schools
- NCES district ID
- 2803690
- Math proficiency
- 48% ▼ -11.00%
- Reading proficiency
- 42% ▼ -9.00%
- Median HH income
- $41,297
- Composite
- 37.84/100
- National rank
- #4329
- State rank
- #26 of 130 in MS
Livability — Tupelo
- Score
- 72/100
- State rank
- #26
- US rank
- #6369
Category grades
Schools grade is shown separately in the Schools card above.
Census & demographics
- County
- Lee County · 52,445 people
- City population
- 46,551
- Metro
- Tupelo, MS
- Population (ZIP)
- 29,858
- Household income
- $62,946
- Rent vs Own
- Severe rent burden
- 890.0
Population outlook (Pontotoc County) Hauer SSP2
- Today (2025)
- 32,690 people
- By 2030
- 33,445 · +2.3%
- By 2040
- 34,588 · +5.8%
- By 2050
- 35,066 · +7.3%
- By 2075
- 35,241 · +7.8%
- By 2100
- 32,290 · -1.2%
Race, ethnicity, and origin ACS 2023
- Neighborhood character
- Diverse neighborhood (Simpson 0.59)
- Race & ethnicity
- Black 45% White 44% Hispanic / Latino 6% Two or more races 4% Asian 1%
- Hispanic origin (detail)
- Mexican 5%
- Common ancestry
- Slovak 1% Italian 1% Serbian 1%
- Foreign-born
- 4% · Canada
- Languages at home
- 93% English-only · Spanish 5%
Political lean MEDSL · Pontotoc
- 2024 margin
- Solid R (+67.7) · D 15.7% · R 83.5%
- 2008→2024 swing
- -15.3pp toward R · 2008: -52.4pp · 2024: -67.7pp
- All cycles
- 2024: R+67.7 2020: R+62.2 2016: R+62.0 2012: R+53.6 2008: R+52.4
Not yet ingested
- Civics
- —
Market trends
- HPI YoY
- ▼ -45.12%
- Current HPI
- 173.1355
- Rent YoY
- ▲ 7.30%
- Metro
- Tupelo, MS
- State GDP YoY
- —
- F500 in state
- 0
Price history
-16.7% since first listed3 events — show timeline
- 2026-04-23 Price Changed $149,900 NEMSBD
- 2026-02-25 Price Changed $155,000 NEMSBD
- 2026-01-05 Listed $179,900 NEMSBD
Cash-flow waterfall
monthlySold comps — $/sqft
last 12 mo · ≤1 miLoading sold comps…