 11-Plex
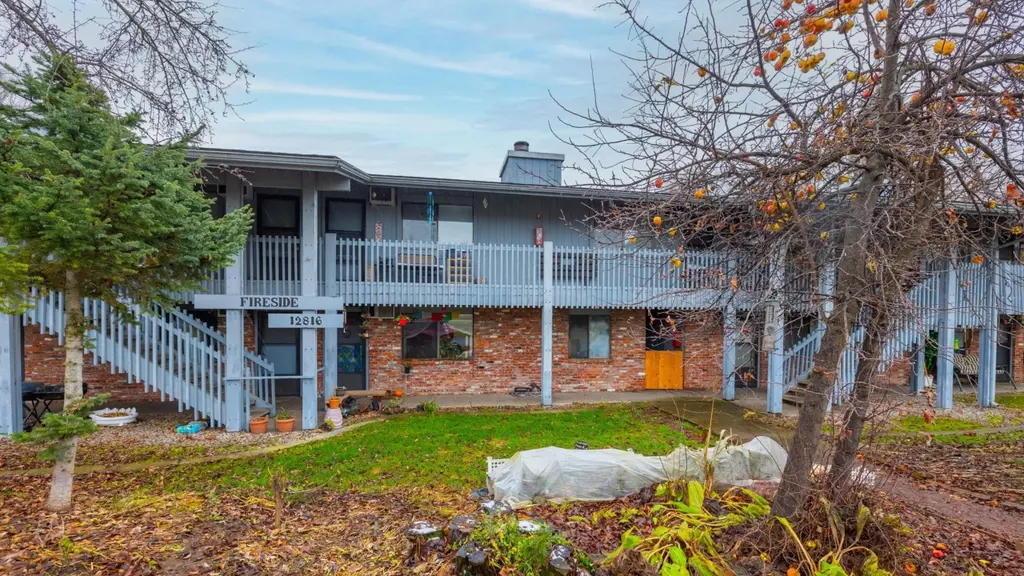
12816 E Main Ave · Spokane Valley, WA
Flood risk 1/10 · Minimal
- FEMA flood zone
- X (unshaded)
- Chance of flooding over 30 yrs
- 0.0%
- Est. flood insurance / yr
- $507 – $1,088
Fire risk 1/10 · Minimal
- Est. fire insurance / yr
- $604 – $1,122
Heat risk 3/10 · Minor
- Hot days now (above 94°F)
- 7 days/yr
- Hot days in 30 yrs
- 15 days/yr
Wind risk 1/10 · Minimal
- Chance of severe wind over 30 yrs
- —
Air-quality risk 9/10 · Severe
- Unhealthy air days now
- 14 days/yr
- Unhealthy air days in 30 yrs
- 15 days/yr
Risk factors via First Street. Map © Google.
Why this score? — see what drove the B grade
The composite is a weighted blend of 9 inputs, each scored 0–100. Each bar is that input's sub-score; the figure is the points it added to the 100-point composite (weight × sub-score).
- Cash flow +30.0/30.0
- DSCR +10.0/10.0
- 1% rule +8.4/10.0
- ARV discount +7.5/15.0
- Schools +5.4/10.0
- Livability +4.2/5.0
- Rent growth +3.2/5.0
- Condition / age +2.5/5.0
- Appreciation +0.0/10.0
$975,000
🖨 Deal sheet (PDF) 📄 Offer letter ✓ Due diligence
Multi-family units
County records classify this as Multi-Family (5+ Unit). Listing-text estimate: 11 units. confirmed
5+ unit building — per-unit beds/baths from public records are typically unavailable; the breakdown below (if shown) is an estimate from the listing text.
Listing remarks
Excellent Spokane Valley Cash-Flow Opportunity This 11-unit apartment building offers immediate income and strong long-term value for the hands-on investor. Built in 1972, the property features eleven 1-bedroom units with excellent occupancy history and consistent rental demand in one of Spokane Valley’s most stable rental pockets. 11 Units – All 1BD (approximately 500-600 SF) 100% Occupied at time of listing Strong in-place cash flow with proven tenant base Value-add upside through updating units and increasing rents. Excellent location with easy access to I-90, shopping, services, and employment centers This is a true turnkey multifamily asset, ideal for the investor seeking
Key facts
- Easy access to i-90
- 0.58 acre lot
- 4 parking spots
Tags
Property features AI
Finance
- Financial info: Classified as rental income property; Annual tax amount reported (see listing)
Exterior
- Parking: Carport parking; Off-site parking available; Four carport spaces
- Home design: Residential income property; Two-story building
- Construction: Brick veneer exterior; Composition roof
- Exterior features: Lot includes city street and private road frontage; Lot size approximately 0.67 acres
Interior
- Bedrooms: Eleven 1-bedroom units
- Bathrooms: Each unit has 1 bathroom
- Heating & cooling: Electric heating; Baseboard heating
- Interior features: Laundry room available; Storage space included
- Laundry & utility: On-site laundry
Neighborhood map
What this means for you Summary
Snapshot
- This is a 11 × 1-bed/1-bath units multifamily listed at $975k.
Deal economics
- At list price, monthly cash flow is $4k ($48k/yr) — positive. Per door: $361/mo.
- The deal already cash-flows at list — no discount required.
- Meets the 1% rule at list price ($13k rent vs $975k).
- Cap rate 11.2% vs local median 3.0% in Spokane Valley — top-decile yield for the area; either an underpriced asset or a hidden risk that comps aren't pricing in. Stress-test before assuming the spread holds.
Location & tenants
- Location reads 85/100 on livability (#31 in WA, #512 nationally) — a professional / high-income tenant draw. Strengths: amenities A+, commute A+, housing A+; Watch: crime D+.
- Central Valley School District (urban): math 55% / reading 66% proficiency, ranked #55 of 291 in WA (top 19%) — acceptable for families but not a draw, mixed tenant base, ~2y average lease.
- Market conditions: Rents rising (+2.9%/yr); 129 active listings in the ZIP; 3,608 units permitted in Spokane County in 2024 (1,792 in 5+ unit buildings).
- At $13,063/mo this rent would consume 211% of the median local household income ($74k/yr) (locally 1478% of renters already pay >50% of income on rent) — very limited rent-growth headroom before tenants either downsize or default.
Forward outlook
- Local home prices are declining (-3.0%/yr); year-one equity from $7k of loan paydown is wiped out by about $29k of value loss. Plan a longer hold.
- Spokane County population projected at +13% by 2050 — modest demand growth; plan on rents tracking national, not racing it.
- At projected returns (-3.0% appreciation + 2.9% rent growth), your $273k cash investment doubles in ~7 years — after that, you're playing with house money.
Negotiation context
- Only 9 days on market — expect competitive offers; lowballing is unlikely to land.
- 3 sale attempts since 3y ago with the ask held roughly flat each time — persistent listings suggest the price (not the market) is what's stuck; bring a comps-based counter.
- Current owner paid $485k; list at $975k implies a 101% gain — meaningful room to come down on a strong offer.
Questions for the listing agent
- Can we see the unit-by-unit rent roll, current vacancy, and any below-market leases? What's the average tenancy length?
- What capital expenditures (roof, boiler, parking lot, exteriors) have been made in the last 5 years, and what's planned in the next 2?
- Built in 1972 — when were the roof, HVAC, electrical panel, plumbing, and water heater last replaced?
- Is there a deadline driving the sale (1031 exchange, divorce, estate, relocation)? That informs how much negotiation room exists.
- Schools are B-rated — typically a magnet for longer-tenancy family renters. What's the average tenant stay here, and is there a school-zone premium baked into asking?
- Crime grade is D in this area — have there been break-ins, vandalism, or insurance claims at this property in the last 3 years? What carrier currently insures it and at what premium?
- What's the average days-on-market for RENTAL listings here right now (not sales)? A rising rental-DOM trend means longer vacancies and softer asking-rent achievability than the comps imply.
- What's the recent tenant-quality profile in this submarket — average credit score on applications, eviction rate, late-payment / NSF rate, and stable-employment percentage? A property-management company in the area should have these aggregated.
- How much new apartment / multifamily construction is in the pipeline within 1–3 miles? Heavy new supply (>2% of stock underway) typically softens rents 12–24 months out; light construction supports rent growth.
Investment metrics
- 1% rule
- 1.34% ✓
- Cap rate
- 11.18%
- Cash-on-cash
- 17.47%
- DSCR
- 1.78
- GRM
- 6.2
CMA / ARV
No comps found within radius.
Projected returns pro-forma
-3.0% appreciation · 2.88% rent growth · sell at horizon
- IRR
- 8.7%
- Equity multiple
- 1.34×
- Total profit
- $93,536
- Equity at exit
- $145,376
- IRR
- 17.8%
- Equity multiple
- 2.47×
- Total profit
- $400,789
- Equity at exit
- $84,300
Cash invested: $273,000 (down + closing). Projections, not guarantees.
Landlord ↔ Tenant lean methodology
- Overall (STATE)
- 28 Tenant-Leaning
- State Washington
- 28 Tenant-Leaning · D+8
- County
- — inherits STATE
- City
- — inherits STATE
ZIP-level market 99216
- Rents YoY
- 2.9%
- Active inventory
- 129
- Price-to-rent
- 68.4×
Monthly cashflow live
- Estimated rent
- $13,063 high interval (Pro) →
- Mortgage (P&I)
- −$5,113
- Tax from tax record
- −$826 /mo · $9,910/yr
- Insurance
- −$406
- HOA
- −$0
- Vacancy / Maint / Mgmt
- −$2,743
- Net cashflow
- $3,975
Break-even live
Sensitivity live
| Price | -10% $4,527 | -5% $4,251 | +0% $3,975 | +5% $3,699 | +10% $3,423 |
|---|---|---|---|---|---|
| Rent | -10% $2,943 | -5% $3,459 | +0% $3,975 | +5% $4,491 | +10% $5,007 |
| Rate | -1.0pp $4,466 | -0.5pp $4,223 | base $3,975 | +0.5pp $3,722 | +1.0pp $3,465 |
11-unit breakdown (identical units grouped — click to expand)
| Units | Beds | Baths | Est. rent |
|---|---|---|---|
| 11× units | 1 | 1 | $13,068 |
| #1 | 1 | 1 | $1,188 |
| #2 | 1 | 1 | $1,188 |
| #3 | 1 | 1 | $1,188 |
| #4 | 1 | 1 | $1,188 |
| #5 | 1 | 1 | $1,188 |
| #6 | 1 | 1 | $1,188 |
| #7 | 1 | 1 | $1,188 |
| #8 | 1 | 1 | $1,188 |
| #9 | 1 | 1 | $1,188 |
| #10 | 1 | 1 | $1,188 |
| #11 | 1 | 1 | $1,188 |
| Total (11 units) | $13,063 | ||
UW: 25.0% down · 7.5% · 30yr · 1.5% tax · 5.0% vac · 8.0% maint · 8.0% mgmt
Financing live
Cash to close
- Down payment
- $243,750
- Closing costs
- $29,250
- Reserves months
- —
- Total cash needed
- —
Loan-product check · same deal, 3 products live
Conventional
25% down · 7.5% · 30yr
- Down + closing
- —
- Monthly P&I
- —
- Monthly cashflow
- —
- DSCR
- —
- Eligible?
- —
Personal DTI + credit; lowest rate.
DSCR
20% down · 8.5% · 30yr
- Down + closing
- —
- Monthly P&I
- —
- Monthly cashflow
- —
- DSCR
- —
- Eligible?
- —
No personal income docs; deal must DSCR.
Hard money
10% down · 12.0% · 12mo
- Down + closing
- —
- Monthly P&I
- —
- Monthly cashflow
- —
- DSCR
- —
- Eligible?
- —
Short-term bridge; refi at stabilization.
Listing history 13 events
-
2026-06-05statusdays on market $975,000 Pending 9 DOM
-
2026-06-03days on market $975,000 Active 8 DOM
-
2026-06-02days on market $975,000 Active 7 DOM
-
2026-06-01days on market $975,000 Active 6 DOM
-
2026-05-31days on market $975,000 Active 5 DOM
-
2026-05-31days on market $975,000 Active 4 DOM
-
2026-05-26$975,000 Active
-
2024-02-01historical $895
-
2024-01-27$895
-
2023-11-20historical $895
-
2023-11-11$895
-
2013-09-03soldstatus $485,000
-
1980-10-15soldstatus $191,800
ⓘ Source: listings_history table (triggers on properties + properties_extension) + one-shot
backfill from property_details.listing_events for pre-trigger history.
Tax reassessment forecast WA · Resets to sale price
- Current annual tax
- $9,910 · $826/mo
- Projected year-2 tax
- $9,910 · $826/mo
- Expected delta
- $0/yr ($0/mo · 0.0%)
ⓘ Screening estimate from a state-policy table — verify with the county assessor before closing.
Climate risk First Street
- Flood 1/10 Low FEMA zone X (unshaded) · 0% chance over 30 yrs
- Wildfire 1/10 Low
- Heat 3/10 Moderate 7 d/yr ≥94°F today · 15 d/yr by 30 yrs out
- Wind 1/10 Low
- Air quality 9/10 Extreme 14 unhealthy d/yr today · 15 by 30 yrs out
Nearby sold comps map
Loading sold comps map…
Walkable amenities ~0.75 mi
Loading nearby amenities…
Taxation est. · year 1
- Rental income
- $156,756
- − Mortgage interest
- −$54,615
- − Property taxes
- −$9,910
- − Insurance
- −$4,875
- − Repairs & maintenance
- −$12,540
- − Management
- −$12,540
- − Depreciation
- −$28,364
- Taxable income
- $33,911
- Est. tax owed @ 24.0%
- −$8,139
- After-tax cash flow
- $39,557/yr
For passive investors: Depreciation is non-cash, so a rental often shows a tax loss while cash-flowing — sheltering income. Rental losses are passive: they offset passive income freely, and up to $25,000/yr can offset ordinary (W-2) income if you actively participate and your MAGI is under $100k (phasing out to $0 by $150k); unused losses carry forward. On sale, claimed depreciation is recaptured at up to 25%, and gains may owe capital-gains tax (a 1031 exchange can defer both). Figures are a year-1 estimate at your 24.0% rate — not tax advice; consult a CPA.
Schools (NCES district)
- District
- Central Valley School District
- NCES district ID
- 5301110
- Math proficiency
- 55% ▬ 0.00%
- Reading proficiency
- 66% ▬ 0.00%
- Median HH income
- $55,824
- Composite
- 53.62/100
- National rank
- #3107
- State rank
- #55 of 291 in WA
Livability — Spokane Valley
- Score
- 85/100
- State rank
- #31
- US rank
- #512
Category grades
Schools grade is shown separately in the Schools card above.
Census & demographics
- Census place
- Spokane Valley, WA
- County
- Spokane County · 496,401 people
- City population
- 129,511
- Metro
- Spokane-Spokane Valley, WA
- Population (ZIP)
- 28,578
- Household income
- $74,278
- Rent vs Own
- Severe rent burden
- 1478.0
Population outlook (Spokane County) Hauer SSP2
- Today (2025)
- 531,314 people
- By 2030
- 549,278 · +3.4%
- By 2040
- 577,822 · +8.8%
- By 2050
- 598,188 · +12.6%
- By 2075
- 630,744 · +18.7%
- By 2100
- 622,360 · +17.1%
Race, ethnicity, and origin ACS 2023
- Neighborhood character
- Predominantly White (83%)
- Race & ethnicity
- White 83% Hispanic / Latino 8% Two or more races 7% Black 1% Native American 1%
- Hispanic origin (detail)
- Mexican 7%
- Common ancestry
- Portuguese 5% Lithuanian 3% Italian 3%
- Foreign-born
- 5% · Canada
- Languages at home
- 91% English-only · Spanish 4% Russian/Polish/Slavic 2%
Political lean MEDSL · Spokane
- 2024 margin
- Toss-up / Even · D 46.0% · R 51.0% · Other 3.0%
- 2008→2024 swing
- -3.8pp toward R · 2008: -1.1pp · 2024: -5.0pp
- All cycles
- 2024: R+5.0 2020: R+4.3 2016: R+8.3 2012: R+6.3 2008: R+1.1
Not yet ingested
- Civics
- —
Market trends
- HPI YoY
- ▼ -367.38%
- Current HPI
- 359.7671
- Rent YoY
- ▲ 2.88%
- Metro
- Spokane-Spokane Valley, WA
- State GDP YoY
- ▲ 4.65%
- F500 in state
- 22
Industry mix (Fortune 500 HQ in WA)
| Industry | F500 HQs | Revenue |
|---|---|---|
| Retail | 2 | $269B |
|
||
| Technology / Retail | 1 | $638B |
|
||
| Technology | 1 | $245B |
|
||
| Telecommunications | 1 | $38B |
|
||
| Food / Beverage | 1 | $36B |
|
||
| Automotive / Trucks | 1 | $34B |
|
||
Price history
+408.3% since first listed7 events — show timeline
- 2026-05-26 Listed $975,000 SPOKANEMLS as Distributed by MLS Grid
- 2024-02-01 Rental Removed $895 APPFOLIO
- 2024-01-27 Listed for Rent $895 APPFOLIO
- 2023-11-20 Rental Removed $895 APPFOLIO
- 2023-11-11 Listed for Rent $895 APPFOLIO
- 2013-09-03 Sold (Public Records) $485,000 Public Records
- 1980-10-15 Sold (Public Records) $191,800 Public Records
Property tax history
+5.2%/yrLatest (2026): $9,910 · -7.5% YoY. Source: county tax records.
Cash-flow waterfall
monthlySold comps — $/sqft
last 12 mo · ≤1 miLoading sold comps…