5377 Princeton Kenly Rd · Princeton, NC
Flood risk 1/10 · Minimal
- FEMA flood zone
- X (unshaded)
- Chance of flooding over 30 yrs
- 0.0%
- Est. flood insurance / yr
- $507 – $1,088
Fire risk 4/10 · Minor
- Est. fire insurance / yr
- $906 – $1,684
Heat risk 7/10 · Major
- Hot days now (above 106°F)
- 7 days/yr
- Hot days in 30 yrs
- 18 days/yr
Wind risk 7/10 · Major
- Chance of severe wind over 30 yrs
- 78.0%
Air-quality risk 2/10 · Minimal
- Unhealthy air days now
- 1 days/yr
- Unhealthy air days in 30 yrs
- 2 days/yr
Risk factors via First Street. Map © Google.
Why this score? — see what drove the D grade
The composite is a weighted blend of 9 inputs, each scored 0–100. Each bar is that input's sub-score; the figure is the points it added to the 100-point composite (weight × sub-score).
- Appreciation +10.0/10.0
- Cash flow +8.3/30.0
- ARV discount +7.5/15.0
- Livability +3.6/5.0
- Schools +3.5/10.0
- 1% rule +2.6/10.0
- Rent growth +2.5/5.0
- Condition / age +2.5/5.0
- DSCR +2.3/10.0
$279,900
🖨 Deal sheet 📄 Offer letter ✓ Due diligence
Listing remarks
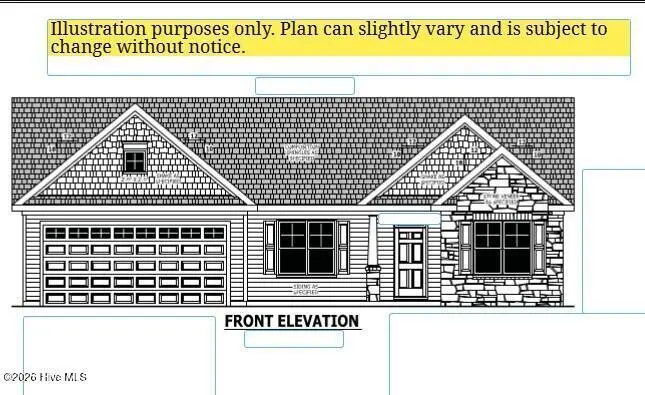
The Chastin Plan~ 3 Bedroom, 2 Bath, Double Garage, NEW Construction, PreSale
Key facts
- 0.97 acre lot
- 2 garage spots
- Built 2026
Property features AI
Exterior
- Parking: Attached 2-car garage; Concrete driveway/parking
- Utilities: Sewer available; Water available
- Home design: Single-family residence; One story (entry level: 1); Residential property
- Construction: Vinyl siding and frame construction; Slab foundation; Built as new construction
- Exterior features: Patio/porch details: see remarks; No fencing; Shingle roof; Has a view; New construction
Interior
- Bedrooms: 6 total rooms (bedroom count not specified)
- Bathrooms: 2 full bathrooms
- Heating & cooling: Central air conditioning; Forced air heating; Electric heating; Fireplace(s)
- Interior features: See remarks
Neighborhood map
What this means for you Summary
Snapshot
- This is a 3-bed/2.0-bath other listed at $280k.
Deal economics
- At list price, monthly cash flow is $-256 ($-3k/yr) — negative.
- To cash-flow at today's rent, offer at most $243k (13.2% below list).
- To meet the 1% rule (rent ≥ 1% of price), the offer needs to be $212k (24.1% below list).
- Recommended offer: $212k (24.1% below list) — sets the bar for 1% rule.
- Cap rate 5.2% vs local median 3.3% in Princeton — top-decile yield for the area; either an underpriced asset or a hidden risk that comps aren't pricing in. Stress-test before assuming the spread holds.
Location & tenants
- Location reads 72/100 on livability (#82 in NC) — a middle-class / working-renter tenant base. Strengths: cost of living A+, health & safety A+, crime A; Watch: amenities F, commute F, employment F.
- Johnston County Public Schools (rural): math 39% / reading 42% proficiency, ranked #105 of 178 in NC (top 59%) — families likely to look elsewhere, expect single-tenant / working-renter base with shorter leases.
- Zoned schools: Micro Elementary (math 42% / reading 42%, grade F, #633 of 1,410 statewide, top 48%, 407 students, 75% FRL); North Johnston Middle (math 26% / reading 36%, grade F, #326 of 475 statewide, top 69%, 600 students, 72% FRL); North Johnston High (math 27% / reading 37%, grade F, #445 of 535 statewide, top 84%, 787 students, 62% FRL) — zoned schools average 69% FRL vs 41% district-wide (29 pts higher); higher-poverty schools than district average — tighter screening recommended.
- Market conditions: 89 active listings in the ZIP; 1 comparable units currently listed for rent nearby; 2,783 units permitted in Johnston County in 2024 (6 in 5+ unit buildings).
Forward outlook
- In year one you build about $30k of equity ($2k loan paydown + $28k appreciation (10.0% local appreciation)).
- Johnston County population projected at +37% by 2050 — long-run rental-demand tailwind backs the buy-and-hold thesis.
- By year 2, paydown + projected appreciation supports a ~$48k cash-out refi (75% LTV) — recoverable capital for the next deal without selling this one.
Negotiation context
- Only 1 days on market — expect competitive offers; lowballing is unlikely to land.
- 14 sale attempts since 20y ago with the ask held roughly flat each time — persistent listings suggest the price (not the market) is what's stuck; bring a comps-based counter.
- Current owner paid $65k; list at $280k implies a 331% gain — meaningful room to come down on a strong offer.
Risks & watch-outs
- Climate carrying-cost: major wind risk, 78% chance of damaging wind over 30y; extreme-heat days projected 7→18/yr by 2055 (HVAC capex compounding) — expect insurance premiums to compound above CPI over the hold.
Questions for the listing agent
- What do current leases actually rent for vs. the listed asking? Can we see a recent rent roll and the last 12 months of T-12 income?
- Is there a deadline driving the sale (1031 exchange, divorce, estate, relocation)? That informs how much negotiation room exists.
- Schools are D-rated, which usually means shorter tenancies and higher turnover. Who's the typical renter profile here, and what's been the actual vacancy rate?
- The area grade is low — what's the realistic commute time and amenity access for the typical tenant pool here? Any planned neighborhood developments (good or bad) we should know about?
- What's the average days-on-market for RENTAL listings here right now (not sales)? A rising rental-DOM trend means longer vacancies and softer asking-rent achievability than the comps imply.
- What's the recent tenant-quality profile in this submarket — average credit score on applications, eviction rate, late-payment / NSF rate, and stable-employment percentage? A property-management company in the area should have these aggregated.
- How much new for-sale + rental construction is in the pipeline within 1–3 miles? Heavy new supply typically softens prices + rents 12–24 months out; constrained supply supports both.
Investment metrics
- 1% rule
- 0.76% ✗
- Cap rate
- 5.20%
- Cash-on-cash
- -3.91%
- DSCR
- 0.83
- GRM
- 11.0
CMA / ARV
No comps found within radius.
Projected returns pro-forma
10.0% appreciation · 3.0% rent growth · sell at horizon
- IRR
- 21.5%
- Equity multiple
- 2.74×
- Total profit
- $136,195
- Equity at exit
- $252,156
- IRR
- 19.4%
- Equity multiple
- 6.28×
- Total profit
- $413,937
- Equity at exit
- $543,784
Cash invested: $78,372 (down + closing). Projections, not guarantees.
Landlord ↔ Tenant lean methodology
- Overall (STATE)
- 85 Strongly Landlord-Friendly
- State North Carolina
- 85 Strongly Landlord-Friendly · R+3
- County
- — inherits STATE
- City
- — inherits STATE
ZIP-level market 27542
- Home prices YoY
- 16.6%
- Active inventory
- 89
- Price-to-rent
- 11.0×
Monthly cashflow live
- Estimated rent
- $2,125 medium interval (Pro) →
- Mortgage (P&I)
- −$1,468
- Tax est. 1.5%
- −$350 /mo · $4,198/yr
- Insurance
- −$117
- HOA
- −$0
- Vacancy / Maint / Mgmt
- −$446
- Net cashflow
- $-256
Break-even live
UW: 25.0% down · 7.5% · 30yr · 1.5% tax · 5.0% vac · 8.0% maint · 8.0% mgmt
Financing live
Cash to close
- Down payment
- $69,975
- Closing costs
- $8,397
- Reserves months
- —
- Total cash needed
- —
Loan-product check · same deal, 3 products live
Conventional
25% down · 7.5% · 30yr
- Down + closing
- —
- Monthly P&I
- —
- Monthly cashflow
- —
- DSCR
- —
- Eligible?
- —
Personal DTI + credit; lowest rate.
DSCR
20% down · 8.5% · 30yr
- Down + closing
- —
- Monthly P&I
- —
- Monthly cashflow
- —
- DSCR
- —
- Eligible?
- —
No personal income docs; deal must DSCR.
Hard money
10% down · 12.0% · 12mo
- Down + closing
- —
- Monthly P&I
- —
- Monthly cashflow
- —
- DSCR
- —
- Eligible?
- —
Short-term bridge; refi at stabilization.
Rent comps 1 comps
| Address | Beds | Baths | Sqft | Rent | $/sqft | DOM | Units | Dist |
|---|---|---|---|---|---|---|---|---|
| 224 Williamson Place Dr Princeton, NC | 3.0 | 2.5 | 1573 | $2,125 | $1.35 | 2d | 1 | 0.99mi |
Listing history 34 events
-
2026-05-18status Pending
-
2026-05-18$279,900 Active
-
2021-06-09soldstatus $65,000
-
2019-11-26historical
-
2019-11-08historical
-
2019-09-18historical Contingent
-
2019-07-10status Active
-
2019-07-10$209,900
-
2019-05-23$209,900
-
2019-05-23historical
-
2015-09-22historical
-
2015-09-11$205,000 Active
-
2014-06-27soldstatus $155,000 Closed
-
2014-04-27historical Contingent
-
2013-11-28price $159,900
-
2013-10-09$164,900 Active
-
2013-06-28soldstatus $12,000 Closed
-
2013-06-28soldstatus $12,000
-
2013-06-28soldstatus $60,000
-
2013-05-17historical Contingent
-
2013-04-02$19,900 Active
-
2013-04-02$19,900
-
2010-10-02historical
-
2010-03-11$19,900
-
2010-03-06historical
-
2009-06-12historical
-
2009-06-10$22,900
-
2008-12-19$22,900
-
2007-10-21historical
-
2007-04-26$22,900
-
2007-04-12historical
-
2006-09-15historical
-
2006-08-16$22,900
-
2006-04-19$22,900
ⓘ Source: listings_history table (triggers on properties + properties_extension) + one-shot
backfill from property_details.listing_events for pre-trigger history.
Climate risk First Street
- Flood 1/10 Low FEMA zone X (unshaded) · 0% chance over 30 yrs
- Wildfire 4/10 Moderate
- Heat 7/10 Severe 7 d/yr ≥106°F today · 18 d/yr by 30 yrs out
- Wind 7/10 Severe 78% chance of damaging wind over 30 yrs
- Air quality 2/10 Low 1 unhealthy d/yr today · 2 by 30 yrs out
Nearby sold comps map
Loading sold comps map…
Walkable amenities ~0.75 mi
Loading nearby amenities…
Taxation est. · year 1
- Rental income
- $25,500
- − Mortgage interest
- −$15,679
- − Property taxes
- −$4,198
- − Insurance
- −$1,400
- − Repairs & maintenance
- −$2,040
- − Management
- −$2,040
- − Depreciation
- −$8,143
- Taxable loss
- −$7,999
- Est. tax savings @ 24.0%
- +$1,920
- After-tax cash flow
- $-1,147/yr
For passive investors: Depreciation is non-cash, so a rental often shows a tax loss while cash-flowing — sheltering income. Rental losses are passive: they offset passive income freely, and up to $25,000/yr can offset ordinary (W-2) income if you actively participate and your MAGI is under $100k (phasing out to $0 by $150k); unused losses carry forward. On sale, claimed depreciation is recaptured at up to 25%, and gains may owe capital-gains tax (a 1031 exchange can defer both). Figures are a year-1 estimate at your 24.0% rate — not tax advice; consult a CPA.
Schools (NCES district)
- District
- Johnston County Public Schools
- NCES district ID
- 3702370
- Math proficiency
- 39% ▲ 4.00%
- Reading proficiency
- 42% ▲ 2.00%
- Median HH income
- $50,912
- Composite
- 34.99/100
- National rank
- #5052
- State rank
- #105 of 178 in NC
Livability — Princeton
- Score
- 72/100
- State rank
- #82
- US rank
- #5811
Category grades
Schools grade is shown separately in the Schools card above.
Census & demographics
- Population (ZIP)
- 9,441
Population outlook (Johnston County) Hauer SSP2
- Today (2025)
- 222,440 people
- By 2030
- 240,227 · +8.0%
- By 2040
- 274,616 · +23.5%
- By 2050
- 304,915 · +37.1%
- By 2075
- 369,507 · +66.1%
- By 2100
- 406,280 · +82.6%
Race, ethnicity, and origin ACS 2023
- Neighborhood character
- Predominantly White (74%)
- Race & ethnicity
- White 74% Black 13% Hispanic / Latino 9% Two or more races 9%
- Hispanic origin (detail)
- Mexican 8%
- Common ancestry
- Scotch-Irish 3% Serbian 1% Scottish 1%
- Foreign-born
- 4% · Canada
- Languages at home
- 91% English-only · Spanish 9%
Political lean MEDSL · Johnston
- 2024 margin
- Strong R (+21.5) · D 38.7% · R 60.2% · Other 1.1%
- 2008→2024 swing
- +2.2pp toward D · 2008: -23.7pp · 2024: -21.5pp
- All cycles
- 2024: R+21.5 2020: R+24.3 2016: R+30.7 2012: R+27.8 2008: R+23.7
Not yet ingested
- Civics
- —
Market trends
- HPI YoY
- ▲ 40.03%
- Current HPI
- 280.6408
- Rent YoY
- —
- Metro
- —
- State GDP YoY
- ▲ 3.28%
- F500 in state
- 26
Industry mix (Fortune 500 HQ in NC)
| Industry | F500 HQs | Revenue |
|---|---|---|
| Financial Services | 2 | $213B |
|
||
| Retail | 2 | $95B |
|
||
| Industrial Conglomerate | 1 | $38B |
|
||
| Metals / Steel | 1 | $35B |
|
||
| Utilities | 1 | $30B |
|
||
| Industrial Machinery | 1 | $19B |
|
||
Price history
+1122.3% since first listed34 events — show timeline
- 2026-05-18 Pending — Hive MLS
- 2026-05-18 Listed $279,900 Hive MLS
- 2021-06-09 Sold (Public Records) $65,000 Public Records
- 2019-11-26 Listing Removed — Hive MLS
- 2019-11-08 Listing Removed — TMLS
- 2019-09-18 Contingent — TMLS
- 2019-07-10 Relisted — TMLS
- 2019-07-10 Listed $209,900 Hive MLS
- 2019-05-23 Listing Removed — TMLS
- 2019-05-23 Listed $209,900 TMLS
- 2015-09-22 Listing Removed — TMLS
- 2015-09-11 Listed $205,000 TMLS
- 2014-06-27 Sold (MLS) $155,000 TMLS
- 2014-04-27 Contingent — TMLS
- 2013-11-28 Price Changed $159,900 TMLS
- 2013-10-09 Listed $164,900 TMLS
- 2013-06-28 Sold (Public Records) $60,000 Public Records
- 2013-06-28 Sold (MLS) $12,000 AMLSNC
- 2013-06-28 Sold (MLS) $12,000 TMLS
- 2013-05-17 Contingent — TMLS
- 2013-04-02 Listed $19,900 TMLS
- 2013-04-02 Listed $19,900 AMLSNC
- 2010-10-02 Listing Removed — TMLS
- 2010-03-11 Listed $19,900 TMLS
- 2010-03-06 Listing Removed — TMLS
- 2009-06-12 Listing Removed — TMLS
- 2009-06-10 Listed $22,900 TMLS
- 2008-12-19 Listed $22,900 TMLS
- 2007-10-21 Listing Removed — TMLS
- 2007-04-26 Listed $22,900 TMLS
- 2007-04-12 Listing Removed — TMLS
- 2006-09-15 Listing Removed — TMLS
- 2006-08-16 Listed $22,900 TMLS
- 2006-04-19 Listed $22,900 TMLS
Property tax history
-9.8%/yrLatest (2025): $356 · +46.3% YoY. Source: county tax records.
Cash-flow waterfall
monthlySold comps — $/sqft
last 12 mo · ≤1 miLoading sold comps…