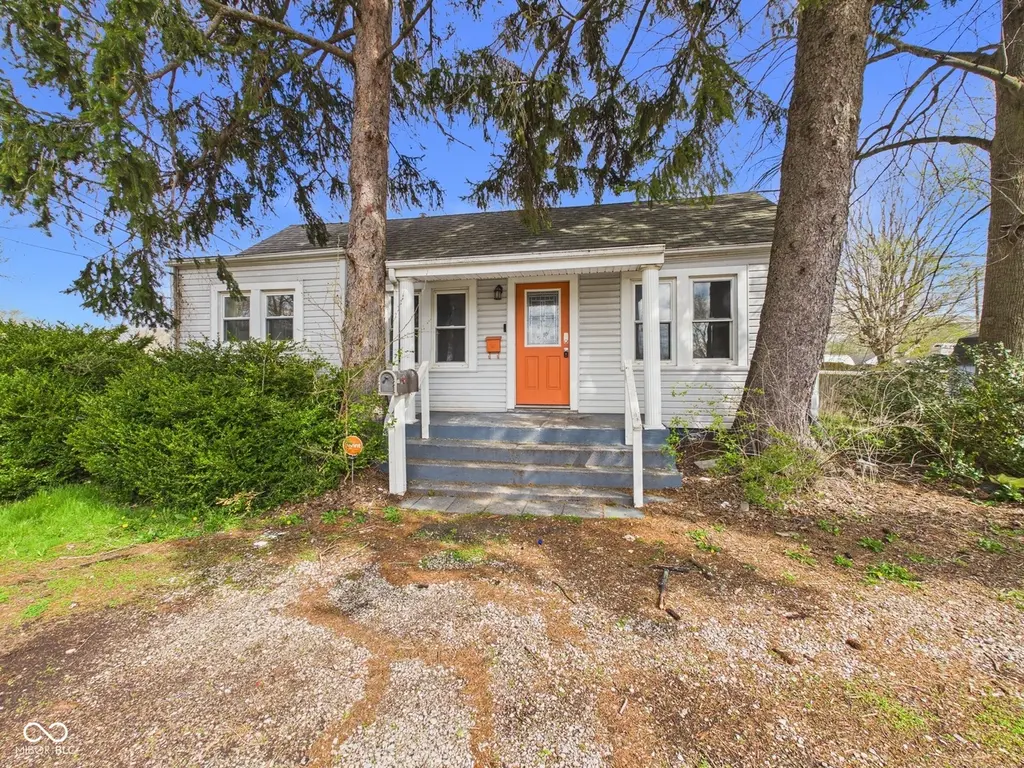
3318 E 14th St · Muncie, IN
Flood risk 1/10 · Minimal
- FEMA flood zone
- X (unshaded)
- Chance of flooding over 30 yrs
- 0.0%
- Est. flood insurance / yr
- $473 – $860
Fire risk 1/10 · Minimal
- Est. fire insurance / yr
- $717 – $1,331
Heat risk 3/10 · Minor
- Hot days now (above 101°F)
- 7 days/yr
- Hot days in 30 yrs
- 18 days/yr
Wind risk 2/10 · Minimal
- Chance of severe wind over 30 yrs
- 1.0%
Air-quality risk 2/10 · Minimal
- Unhealthy air days now
- 1 days/yr
- Unhealthy air days in 30 yrs
- 2 days/yr
Risk factors via First Street. Map © Google.
Why this score? — see what drove the C grade
The composite is a weighted blend of 9 inputs, each scored 0–100. Each bar is that input's sub-score; the figure is the points it added to the 100-point composite (weight × sub-score).
- Cash flow +24.0/30.0
- ARV discount +8.0/15.0
- DSCR +7.7/10.0
- 1% rule +6.0/10.0
- Rent growth +4.0/5.0
- Livability +4.0/5.0
- Condition / age +2.5/5.0
- Schools +1.7/10.0
- Appreciation +0.0/10.0
$75,000
🖨 Deal sheet 📄 Offer letter ✓ Due diligence
Listing remarks MLS
Charming and cozy 1-bedroom, 1-bath home located in the heart of Muncie! This inviting property offers the perfect blend of comfort and simplicity, making it ideal for first-time buyers, downsizers, or investors. Step inside to find a warm and welcoming living space filled with natural light, complemented by an efficient layout that maximizes every square foot. The kitchen provides ample cabinet space and functionality, while the bedroom offers a peaceful retreat at the end of the day. Outside, enjoy a manageable yard-perfect for relaxing, gardening, or entertaining without the upkeep of a larger property. Conveniently located near local shops, dining, and amenities, this home offers both comfort and accessibility at an affordable price. Don't miss your chance to own this cozy gem in Muncie!
Key facts
- Manageable yard
- Ample cabinet space
- 6,864 sq ft lot
Tags
Neighborhood map
What this means for you Summary
Snapshot
- This is a 2-bed/1.0-bath single-family listed at $75k.
Deal economics
- At list price, monthly cash flow is $147 ($2k/yr) — positive.
- The deal already cash-flows at list — no discount required.
- Meets the 1% rule at list price ($828 rent vs $75k).
- Recommended offer: $70k (6.0% below list) — sets the bar for market timing.
- Cap rate 8.6% vs local median 6.0% in Muncie — top-decile yield for the area; either an underpriced asset or a hidden risk that comps aren't pricing in. Stress-test before assuming the spread holds.
Location & tenants
- Location reads 80/100 on livability (#18 in IN, #1,654 nationally) — a professional / high-income tenant draw. Strengths: amenities A+, commute A+, cost of living A+; Watch: schools D+, crime F, employment F.
- Muncie Community Schools (urban): math 18% / reading 25% proficiency, ranked #275 of 301 in IN (top 91%) — low school quality limits family demand, transient renter base, plan for 1-2y turnover; 68% free/reduced lunch — lower-income household profile, screen leases tightly.
- Market conditions: Rents rising fast (+6.1%/yr); 148 active listings in the ZIP; 4 comparable units currently listed for rent nearby; rentals lingering (median 44d on market — plan ~5-8 weeks vacancy on turnover, expect pricing pressure); 100% of comp listings sitting > 30 days — soft ceiling on asking rent; 171 units permitted in Delaware County in 2024 (57 in 5+ unit buildings).
Forward outlook
- Local home prices are declining (-3.0%/yr); year-one equity from $519 of loan paydown is wiped out by about $2k of value loss. Plan a longer hold.
- Delaware County population projected at -11% by 2050 — secular population decline; favor cash flow + early exit over multi-decade hold.
- At projected returns (-3.0% appreciation + 6.1% rent growth), your $21k cash investment doubles in ~9 years — after that, you're playing with house money.
Negotiation context
- It's been on market 72 days — a 6% lower offer ($70k) is reasonable based on typical stale-listing flexibility.
- 8 sale attempts since 4y ago; this cycle's ask has dropped $5k (6%) from the opening price — seller is motivated, your offer sets the floor, not the list.
Risks & watch-outs
- Watch-outs: built in 1940 — expect roof / HVAC / electrical / plumbing capex.
Questions for the listing agent
- It's been on market 72 days. Have you received any prior offers? Is the seller open to a 6% concession, seller financing, or rate buy-down credit?
- Built in 1940 — when were the roof, HVAC, electrical panel, plumbing, and water heater last replaced?
- Why hasn't it sold? Are there any deal-killer items the seller is aware of (foundation, flood, title, zoning, code violations)?
- Is there a deadline driving the sale (1031 exchange, divorce, estate, relocation)? That informs how much negotiation room exists.
- Schools are D-rated, which usually means shorter tenancies and higher turnover. Who's the typical renter profile here, and what's been the actual vacancy rate?
- Crime grade is F in this area — have there been break-ins, vandalism, or insurance claims at this property in the last 3 years? What carrier currently insures it and at what premium?
- What's the average days-on-market for RENTAL listings here right now (not sales)? A rising rental-DOM trend means longer vacancies and softer asking-rent achievability than the comps imply.
- What's the recent tenant-quality profile in this submarket — average credit score on applications, eviction rate, late-payment / NSF rate, and stable-employment percentage? A property-management company in the area should have these aggregated.
- How much new for-sale + rental construction is in the pipeline within 1–3 miles? Heavy new supply typically softens prices + rents 12–24 months out; constrained supply supports both.
Investment metrics
- 1% rule
- 1.10% ✓
- Cap rate
- 8.64%
- Cash-on-cash
- 8.38%
- DSCR
- 1.37
- GRM
- 7.5
CMA / ARV
- ARV (median comp)
- $75,827
- List price
- $75,000
- Delta
- -1.09%
- Verdict
- FAIR
- Comps
- 20 within 1.0 mi
Show comp detail 2 sales within ~0.75 mi
| Address | Dist | Beds/Ba | Sqft | Sold | Price | $/sf | Match |
|---|---|---|---|---|---|---|---|
| 2102 S Manhattan Ave | 0.30mi | 1/1.0 (-1) | 528 (-10%) | 14mo | $68,316 | $129 | 53 |
| 2003 S Manhattan Ave | 0.32mi | 2/1.0 | 660 (+12%) | 24mo | $19,000 | $29 | 44 |
Match score weights: distance 35% · size 25% · config 20% · recency 20%. Top-matched comps best support the ARV.
Projected returns pro-forma
-3.0% appreciation · 6.11% rent growth · sell at horizon
- IRR
- -0.2%
- Equity multiple
- 0.99×
- Total profit
- $-139
- Equity at exit
- $11,183
- IRR
- 12.4%
- Equity multiple
- 2.12×
- Total profit
- $23,614
- Equity at exit
- $6,485
Cash invested: $21,000 (down + closing). Projections, not guarantees.
Landlord ↔ Tenant lean methodology
- Overall (STATE)
- 90 Strongly Landlord-Friendly
- State Indiana
- 90 Strongly Landlord-Friendly · R+11
- County
- — inherits STATE
- City
- — inherits STATE
ZIP-level market 47302
- Home prices YoY
- -12.6%
- Rents YoY
- 6.1%
- Active inventory
- 148
- Price-to-rent
- 7.5×
Monthly cashflow live
- Estimated rent
- $828 medium interval (Pro) →
- Mortgage (P&I)
- −$393
- Tax from tax record
- −$83 /mo · $998/yr
- Insurance
- −$31
- HOA
- −$0
- Vacancy / Maint / Mgmt
- −$174
- Net cashflow
- $147
Break-even live
UW: 25.0% down · 7.5% · 30yr · 1.5% tax · 5.0% vac · 8.0% maint · 8.0% mgmt
Financing live
Cash to close
- Down payment
- $18,750
- Closing costs
- $2,250
- Reserves months
- —
- Total cash needed
- —
Loan-product check · same deal, 3 products live
Conventional
25% down · 7.5% · 30yr
- Down + closing
- —
- Monthly P&I
- —
- Monthly cashflow
- —
- DSCR
- —
- Eligible?
- —
Personal DTI + credit; lowest rate.
DSCR
20% down · 8.5% · 30yr
- Down + closing
- —
- Monthly P&I
- —
- Monthly cashflow
- —
- DSCR
- —
- Eligible?
- —
No personal income docs; deal must DSCR.
Hard money
10% down · 12.0% · 12mo
- Down + closing
- —
- Monthly P&I
- —
- Monthly cashflow
- —
- DSCR
- —
- Eligible?
- —
Short-term bridge; refi at stabilization.
Rent comps 4 comps
| Address | Beds | Baths | Sqft | Rent | $/sqft | DOM | Units | Dist |
|---|---|---|---|---|---|---|---|---|
| 2011 E 18th St Muncie, IN | 2.0 | 1.0 | 470 | $725 | $1.54 | 43d | 1 | 0.93mi |
| 1901 E 26th St Unit 5 Muncie, IN | 2.0 | 1.0 | 600 | $865 | $1.44 | 43d | 1 | 1.32mi |
| 1311 E 11th St Unit 2 Muncie, IN | 1.0 | 1.0 | 672 | $715 | $1.06 | 43d | 1 | 1.33mi |
| 1521 E Kirby Ave Muncie, IN | 2.0–4.0 | 1.0–2.0 | 972 | $800 | $0.82 | 43d | 2 | 1.44mi |
Listing history 35 events
-
2026-06-19days on market $75,000 Active 72 DOM
-
2026-06-18days on market $75,000 Active 71 DOM
-
2026-06-17days on market $75,000 Active 70 DOM
-
2026-06-16days on market $75,000 Active 69 DOM
-
2026-06-15days on market $75,000 Active 68 DOM
-
2026-06-14days on market $75,000 Active 66 DOM
-
2026-06-13days on market $75,000 Active 65 DOM
-
2026-06-10days on market $75,000 Active 63 DOM
-
2026-06-09days on market $75,000 Active 62 DOM
-
2026-06-08days on market $75,000 Active 61 DOM
-
2026-06-07days on market $75,000 Active 60 DOM
-
2026-06-05days on market $75,000 Active 57 DOM
-
2026-06-03days on market $75,000 Active 56 DOM
-
2026-06-02days on market $75,000 Active 55 DOM
-
2026-06-01days on market $75,000 Active 54 DOM
-
2026-05-31days on market $75,000 Active 53 DOM
-
2026-05-30days on market $75,000 Active 52 DOM
-
2026-04-08$80,000 Active 808-char remark
Show marketing remark (808 chars)
Charming and cozy 1-bedroom, 1-bath home located in the heart of Muncie! This inviting property offers the perfect blend of comfort and simplicity, making it ideal for first-time buyers, downsizers, or investors. Step inside to find a warm and welcoming living space filled with natural light, complemented by an efficient layout that maximizes every square foot. The kitchen provides ample cabinet space and functionality, while the bedroom offers a peaceful retreat at the end of the day. Outside, enjoy a manageable yard-perfect for relaxing, gardening, or entertaining without the upkeep of a larger property. Conveniently located near local shops, dining, and amenities, this home offers both comfort and accessibility at an affordable price. Don't miss your chance to own this cozy gem in Muncie!
-
2025-10-23soldstatus $128,500 Closed 255-char remark
Show marketing remark (255 chars)
Rented for $825 a month, deposit $1,275 , lease ends 6-30-26. Tenants pay all utilities. Lovely 2 bedroom, 1 bath property. It features a laundry area, covered front porch, corner lot, and a basement. Possible package deal with 2812 S Jefferson St Muncie.
-
2025-10-23soldstatus $128,500 Closed
Show marketing remark (255 chars)
Rented for $825 a month, deposit $1,275 , lease ends 6-30-26. Tenants pay all utilities. Lovely 2 bedroom, 1 bath property. It features a laundry area, covered front porch, corner lot, and a basement. Possible package deal with 2812 S Jefferson St Muncie.
-
2025-10-13status Pending 255-char remark
Show marketing remark (255 chars)
Rented for $825 a month, deposit $1,275 , lease ends 6-30-26. Tenants pay all utilities. Lovely 2 bedroom, 1 bath property. It features a laundry area, covered front porch, corner lot, and a basement. Possible package deal with 2812 S Jefferson St Muncie.
-
2025-10-13status Pending
Show marketing remark (255 chars)
Rented for $825 a month, deposit $1,275 , lease ends 6-30-26. Tenants pay all utilities. Lovely 2 bedroom, 1 bath property. It features a laundry area, covered front porch, corner lot, and a basement. Possible package deal with 2812 S Jefferson St Muncie.
-
2025-09-25$69,900 Active 255-char remark
Show marketing remark (255 chars)
Rented for $825 a month, deposit $1,275 , lease ends 6-30-26. Tenants pay all utilities. Lovely 2 bedroom, 1 bath property. It features a laundry area, covered front porch, corner lot, and a basement. Possible package deal with 2812 S Jefferson St Muncie.
-
2025-09-24$69,900 Active
-
2024-01-26soldstatus $50,000 Closed
-
2024-01-16status Pending
-
2023-12-12status Active
-
2023-12-06status Pending
-
2023-11-27status Active
-
2023-11-27$59,999 Active
-
2023-10-16historical
-
2023-03-21status Active
-
2023-03-13status Pending
-
2022-11-28price $65,999
-
2022-10-20$71,000 Active
ⓘ Source: listings_history table (triggers on properties + properties_extension) + one-shot
backfill from property_details.listing_events for pre-trigger history.
Tax reassessment forecast IN · Partial reset (capped growth)
- Current annual tax
- $998 · $83/mo
- Projected year-2 tax
- $998 · $83/mo
- Expected delta
- $0/yr ($0/mo · 0.0%)
ⓘ Screening estimate from a state-policy table — verify with the county assessor before closing.
Climate risk First Street
- Flood 1/10 Low FEMA zone X (unshaded) · 0% chance over 30 yrs
- Wildfire 1/10 Low
- Heat 3/10 Moderate 7 d/yr ≥101°F today · 18 d/yr by 30 yrs out
- Wind 2/10 Low 100% chance of damaging wind over 30 yrs
- Air quality 2/10 Low 1 unhealthy d/yr today · 2 by 30 yrs out
Nearby sold comps map
Loading sold comps map…
Walkable amenities ~0.75 mi
Loading nearby amenities…
Taxation est. · year 1
- Rental income
- $9,939
- − Mortgage interest
- −$4,201
- − Property taxes
- −$998
- − Insurance
- −$375
- − Repairs & maintenance
- −$795
- − Management
- −$795
- − Depreciation
- −$2,182
- Taxable income
- $593
- Est. tax owed @ 24.0%
- −$142
- After-tax cash flow
- $1,617/yr
For passive investors: Depreciation is non-cash, so a rental often shows a tax loss while cash-flowing — sheltering income. Rental losses are passive: they offset passive income freely, and up to $25,000/yr can offset ordinary (W-2) income if you actively participate and your MAGI is under $100k (phasing out to $0 by $150k); unused losses carry forward. On sale, claimed depreciation is recaptured at up to 25%, and gains may owe capital-gains tax (a 1031 exchange can defer both). Figures are a year-1 estimate at your 24.0% rate — not tax advice; consult a CPA.
Schools (NCES district)
- District
- Muncie Community Schools
- NCES district ID
- 1807320
- Math proficiency
- 18% ▼ -9.00%
- Reading proficiency
- 25% ▼ -4.00%
- Median HH income
- $30,052
- Composite
- 17.22/100
- National rank
- #9099
- State rank
- #275 of 301 in IN
Livability — Muncie
- Score
- 80/100
- State rank
- #18
- US rank
- #1654
Category grades
Schools grade is shown separately in the Schools card above.
Census & demographics
- Census place
- Muncie, IN
- County
- Delaware County · 84,658 people
- City population
- 84,658
- Metro
- Muncie, IN
- Population (ZIP)
- 25,473
- Household income
- $47,837
- Rent vs Own
- Severe rent burden
- 1150.0
Population outlook (Delaware County) Hauer SSP2
- Today (2025)
- 113,036 people
- By 2030
- 111,313 · -1.5%
- By 2040
- 106,432 · -5.8%
- By 2050
- 100,747 · -10.9%
- By 2075
- 91,000 · -19.5%
- By 2100
- 80,687 · -28.6%
Race, ethnicity, and origin ACS 2023
- Neighborhood character
- Predominantly White (84%)
- Race & ethnicity
- White 84% Two or more races 6% Black 6% Hispanic / Latino 4%
- Common ancestry
- Italian 2% Slovak 1% Romanian 1%
- Foreign-born
- 1% · Canada
- Languages at home
- 98% English-only · Spanish 1% German/W. Germanic 1%
Political lean MEDSL · Delaware
- 2024 margin
- R (+15.8) · D 41.2% · R 57.0% · Other 1.8%
- 2008→2024 swing
- -30.8pp toward R · 2008: 15.0pp · 2024: -15.8pp
- All cycles
- 2024: R+15.8 2020: R+13.2 2016: R+13.7 2012: D+3.1 2008: D+15.0
Not yet ingested
- Civics
- —
Market trends
- HPI YoY
- ▼ -30.32%
- Current HPI
- 210.431
- Rent YoY
- ▲ 6.11%
- Metro
- Muncie, IN
- State GDP YoY
- ▲ 2.90%
- F500 in state
- 18
Industry mix (Fortune 500 HQ in IN)
| Industry | F500 HQs | Revenue |
|---|---|---|
| Industrial Machinery | 2 | $37B |
|
||
| Healthcare | 1 | $177B |
|
||
| Pharmaceuticals | 1 | $45B |
|
||
| Metals / Steel | 1 | $18B |
|
||
| Agriculture | 1 | $17B |
|
||
| Packaging | 1 | $12B |
|
||
Price history
+12.7% since first listed18 events — show timeline
- 2026-04-08 Listed $80,000 MIBOR as Distributed by MLS Grid
- 2025-10-23 Sold (MLS) $128,500 MIBOR as Distributed by MLS Grid
- 2025-10-23 Sold (MLS) $128,500 IRMLS
- 2025-10-13 Pending — IRMLS
- 2025-10-13 Pending — MIBOR as Distributed by MLS Grid
- 2025-09-25 Listed $69,900 IRMLS
- 2025-09-24 Listed $69,900 MIBOR as Distributed by MLS Grid
- 2024-01-26 Sold (MLS) $50,000 MIBOR as Distributed by MLS Grid
- 2024-01-16 Pending — MIBOR as Distributed by MLS Grid
- 2023-12-12 Relisted — MIBOR as Distributed by MLS Grid
- 2023-12-06 Pending — MIBOR as Distributed by MLS Grid
- 2023-11-27 Relisted — MIBOR as Distributed by MLS Grid
- 2023-11-27 Listed $59,999 MIBOR as Distributed by MLS Grid
- 2023-10-16 Listing Removed — MIBOR as Distributed by MLS Grid
- 2023-03-21 Relisted — MIBOR as Distributed by MLS Grid
- 2023-03-13 Pending — MIBOR as Distributed by MLS Grid
- 2022-11-28 Price Changed $65,999 MIBOR as Distributed by MLS Grid
- 2022-10-20 Listed $71,000 MIBOR as Distributed by MLS Grid
Property tax history
+33.9%/yrLatest (2024): $998 · +10.9% YoY. Source: county tax records.
Cash-flow waterfall
monthlySold comps — $/sqft
last 12 mo · ≤1 miLoading sold comps…