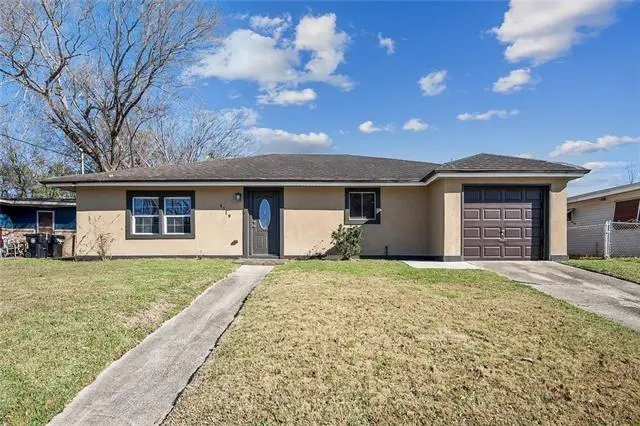
4719 Warren Dr · New Orleans, LA
Flood risk 8/10 · Major
- FEMA flood zone
- X
- Chance of flooding over 30 yrs
- 0.6%
- Est. flood insurance / yr
- $507 – $1,088
Fire risk 1/10 · Minimal
- Est. fire insurance / yr
- $1,269 – $2,357
Heat risk 10/10 · Severe
- Hot days now (above 108°F)
- 7 days/yr
- Hot days in 30 yrs
- 22 days/yr
Wind risk 10/10 · Severe
- Chance of severe wind over 30 yrs
- 99.0%
Air-quality risk 3/10 · Minor
- Unhealthy air days now
- 3 days/yr
- Unhealthy air days in 30 yrs
- 3 days/yr
Risk factors via First Street. Map © Google.
Why this score? — see what drove the D+ grade
The composite is a weighted blend of 9 inputs, each scored 0–100. Each bar is that input's sub-score; the figure is the points it added to the 100-point composite (weight × sub-score).
- Cash flow +16.8/30.0
- ARV discount +9.2/15.0
- DSCR +5.2/10.0
- 1% rule +4.0/10.0
- Livability +4.0/5.0
- Rent growth +2.5/5.0
- Condition / age +2.5/5.0
- Schools +1.6/10.0
- Appreciation +0.0/10.0
$185,000
🖨 Deal sheet (PDF) 📄 Offer letter ✓ Due diligence
Listing remarks MLS
Seller offering $3,000 in closing cost assistance with an acceptable offer. Must see, attractive home with great curb appeal in the convenient Read West neighborhood, just blocks from Joe Brown Park! Just under 1,600 sq ft, this home features a spacious open floor plan perfect for everyday living and entertaining, with a bright living, kitchen, and dining area. Offering 3 bedrooms, 2 full bathrooms, and a functional garage, this solid home includes updated electrical and plumbing, HVAC and roof only a few years old, tiled floors, large baseboards, beautiful trim throughout the main living areas, ceiling fans, and recessed lighting. Located in an established, sought-after area with great scenery, this beautifully elevated block has never flooded and is in Flood Zone X. Enjoy being just a bike ride away from the library, Lincoln Beach, and the anticipated Bayou Phoenix Family Entertainment Water Park & Lodging.
Key facts
- Open floor plan
- Updated electrical
- Tiled floors
Tags
Neighborhood map
What this means for you Summary
Snapshot
- This is a 3-bed/2.0-bath single-family listed at $185k.
Deal economics
- At list price, monthly cash flow is $53 ($635/yr) — positive.
- The deal already cash-flows at list — no discount required.
- To meet the 1% rule (rent ≥ 1% of price), the offer needs to be $166k (10.4% below list).
- Recommended offer: $166k (10.4% below list) — sets the bar for 1% rule.
- Cap rate 7.1% vs local median 4.4% in New Orleans — top-decile yield for the area; either an underpriced asset or a hidden risk that comps aren't pricing in. Stress-test before assuming the spread holds.
Location & tenants
- Location reads 81/100 on livability (#3 in LA, #1,383 nationally) — a professional / high-income tenant draw. Strengths: amenities A+, commute A+, health & safety A+; Watch: crime C-, employment D.
- Orleans Parish (urban): math 11% / reading 27% proficiency, ranked #69 of 98 in LA (top 70%) — low school quality limits family demand, transient renter base, plan for 1-2y turnover; 68% free/reduced lunch — lower-income household profile, screen leases tightly.
- Zoned schools: Benjamin Franklin Elem. Math And Science (math 12% / reading 23%, grade F, #479 of 646 statewide, top 75%, 747 students, 98% FRL, charter) — zoned schools average 98% FRL vs 68% district-wide (30 pts higher); higher-poverty schools than district average — tighter screening recommended.
- Market conditions: 130 active listings in the ZIP; 11 comparable units currently listed for rent nearby; rentals at typical pace (median 26d on market — plan ~3-4 weeks tenant-placement turnaround); lower-income renter base — watch delinquency; 710 units permitted in Orleans Parish in 2024 (244 in 5+ unit buildings).
- At $1,658/mo this rent would consume 49% of the median local household income ($41k/yr) (locally 2030% of renters already pay >50% of income on rent) — very limited rent-growth headroom before tenants either downsize or default.
Forward outlook
- Local home prices are declining (-3.0%/yr); year-one equity from $1k of loan paydown is wiped out by about $6k of value loss. Plan a longer hold.
- Orleans County population projected at +61% by 2050 — long-run rental-demand tailwind backs the buy-and-hold thesis.
Negotiation context
- It's been on market 109 days — a 9% lower offer ($168k) is reasonable based on typical stale-listing flexibility.
- 18 sale attempts since 25y ago with the ask held roughly flat each time — persistent listings suggest the price (not the market) is what's stuck; bring a comps-based counter.
- Current owner paid $22k; list at $185k implies a 722% gain — meaningful room to come down on a strong offer.
Risks & watch-outs
- Watch-outs: flood insurance adds $66/mo; built in 1956 — expect roof / HVAC / electrical / plumbing capex.
- Climate carrying-cost: severe flood risk; severe wind risk, 99% chance of damaging wind over 30y; extreme-heat days projected 7→22/yr by 2055 (HVAC capex compounding) — expect insurance premiums to compound above CPI over the hold.
Questions for the listing agent
- It's been on market 109 days. Have you received any prior offers? Is the seller open to a 10% concession, seller financing, or rate buy-down credit?
- Built in 1956 — when were the roof, HVAC, electrical panel, plumbing, and water heater last replaced?
- What's the actual annual flood-insurance premium (NFIP or private), and is the property in a SFHA with mandatory coverage?
- Why hasn't it sold? Are there any deal-killer items the seller is aware of (foundation, flood, title, zoning, code violations)?
- Is there a deadline driving the sale (1031 exchange, divorce, estate, relocation)? That informs how much negotiation room exists.
- The area grade is low — what's the realistic commute time and amenity access for the typical tenant pool here? Any planned neighborhood developments (good or bad) we should know about?
- What's the average days-on-market for RENTAL listings here right now (not sales)? A rising rental-DOM trend means longer vacancies and softer asking-rent achievability than the comps imply.
- What's the recent tenant-quality profile in this submarket — average credit score on applications, eviction rate, late-payment / NSF rate, and stable-employment percentage? A property-management company in the area should have these aggregated.
- How much new for-sale + rental construction is in the pipeline within 1–3 miles? Heavy new supply typically softens prices + rents 12–24 months out; constrained supply supports both.
Investment metrics
- 1% rule
- 0.90% ✗
- Cap rate
- 7.07%
- Cash-on-cash
- 2.77%
- DSCR
- 1.12
- GRM
- 9.3
CMA / ARV
- ARV (median comp)
- $192,072
- List price
- $185,000
- Delta
- -3.68%
- Verdict
- FAIR
- Comps
- 20 within 1.0 mi
Show comp detail 12 sales within ~0.75 mi
| Address | Dist | Beds/Ba | Sqft | Sold | Price | $/sf | Match |
|---|---|---|---|---|---|---|---|
| 4844 Sierra Madre Dr | 0.14mi | 3/2.0 | 1,518 (-1%) | 2mo | $195,000 | $128 | 91 |
| 10101 Dreux Ave | 0.13mi | 3/2.0 | 1,633 (+7%) | 3mo | $206,000 | $126 | 80 |
| 10700 Vienna St | 0.43mi | 3/2.0 | 1,508 (-1%) | 8mo | $120,000 | $80 | 71 |
| 4927 Sandalwood St | 0.33mi | 4/2.5 (+1) | 1,481 (-3%) | 7mo | $260,000 | $176 | 66 |
| 4635 Longfellow Dr | 0.74mi | 3/2.0 | 1,530 (+0%) | 1mo | $225,000 | $147 | 64 |
| 4718 Hauck Dr | 0.20mi | 3/2.0 | 1,748 (+14%) | 5mo | $234,000 | $134 | 63 |
| 4714 Rosalia Dr | 0.46mi | 2/2.0 (-1) | 1,579 (+3%) | 9mo | $158,000 | $100 | 60 |
| 4921 Nighthart St | 0.57mi | 3/1.0 | 1,599 (+5%) | 2mo | $65,000 | $41 | 60 |
| 4624 Wright Rd | 0.59mi | 3/2.0 | 1,440 (-6%) | 4mo | $165,000 | $115 | 59 |
| 4811 Perelli Dr | 0.34mi | 3/2.0 | 1,730 (+13%) | 6mo | $200,000 | $116 | 57 |
| 4958 Sandalwood St | 0.39mi | 4/2.0 (+1) | 1,691 (+11%) | 5mo | $285,000 | $169 | 55 |
| 4711 Eunice St | 0.56mi | 3/2.0 | 1,665 (+9%) | 8mo | $219,000 | $132 | 52 |
Match score weights: distance 35% · size 25% · config 20% · recency 20%. Top-matched comps best support the ARV.
Projected returns pro-forma
-3.0% appreciation · 3.0% rent growth · sell at horizon
- IRR
- -14.3%
- Equity multiple
- 0.49×
- Total profit
- $-26,595
- Equity at exit
- $27,584
- IRR
- -5.6%
- Equity multiple
- 0.64×
- Total profit
- $-18,771
- Equity at exit
- $15,995
Cash invested: $51,800 (down + closing). Projections, not guarantees.
Landlord ↔ Tenant lean methodology
- Overall (STATE)
- 90 Strongly Landlord-Friendly
- State Louisiana
- 90 Strongly Landlord-Friendly · R+12
- County
- — inherits STATE
- City
- — inherits STATE
ZIP-level market 70127
- Home prices YoY
- -29.2%
- Active inventory
- 130
- Price-to-rent
- 9.3×
Monthly cashflow live
- Estimated rent
- $1,658 high interval (Pro) →
- Mortgage (P&I)
- −$970
- Tax from tax record
- −$143 /mo · $1,717/yr
- Insurance
- −$77
- Flood insurance flood zone
- −$66 /mo · $798/yr
- HOA
- −$0
- Vacancy / Maint / Mgmt
- −$348
- Net cashflow
- $53
Break-even live
Sensitivity live
| Price | -10% $158 | -5% $105 | +0% $53 | +5% $1 | +10% $-52 |
|---|---|---|---|---|---|
| Rent | -10% $-78 | -5% $-13 | +0% $53 | +5% $118 | +10% $184 |
| Rate | -1.0pp $146 | -0.5pp $100 | base $53 | +0.5pp $5 | +1.0pp $-44 |
UW: 25.0% down · 7.5% · 30yr · 1.5% tax · 5.0% vac · 8.0% maint · 8.0% mgmt
Financing live
Cash to close
- Down payment
- $46,250
- Closing costs
- $5,550
- Reserves months
- —
- Total cash needed
- —
Loan-product check · same deal, 3 products live
Conventional
25% down · 7.5% · 30yr
- Down + closing
- —
- Monthly P&I
- —
- Monthly cashflow
- —
- DSCR
- —
- Eligible?
- —
Personal DTI + credit; lowest rate.
DSCR
20% down · 8.5% · 30yr
- Down + closing
- —
- Monthly P&I
- —
- Monthly cashflow
- —
- DSCR
- —
- Eligible?
- —
No personal income docs; deal must DSCR.
Hard money
10% down · 12.0% · 12mo
- Down + closing
- —
- Monthly P&I
- —
- Monthly cashflow
- —
- DSCR
- —
- Eligible?
- —
Short-term bridge; refi at stabilization.
Rent comps 11 comps
| Address | Beds | Baths | Sqft | Rent | $/sqft | DOM | Units | Dist |
|---|---|---|---|---|---|---|---|---|
| 5000 Cardenas Dr New Orleans, LA | 3.0 | 2.0 | 1800 | $1,920 | $1.07 | 25d | 1 | 0.30mi |
| 5131 Bundy Rd New Orleans, LA | 1.0–3.0 | 1.0–2.0 | 1000 | $1,314 | $1.31 | 3d | 21 | 0.76mi |
| 5754 Louis Prima Dr E New Orleans, LA | 3.0 | 2.5 | 2069 | $2,195 | $1.06 | 25d | 1 | 1.27mi |
| 10704 Roger Dr Unit D New Orleans, LA | 2.0 | 1.5 | 1050 | $950 | $0.90 | 25d | 1 | 1.34mi |
| 10821 Roger Dr Unit A New Orleans, LA | 2.0 | 1.5 | 1200 | $1,400 | $1.17 | 25d | 1 | 1.40mi |
| 11040 Roger Dr Unit C New Orleans, LA | 2.0 | 2.5 | 1505 | $1,500 | $1.00 | 25d | 1 | 1.43mi |
| 10951 Roger Dr Unit B New Orleans, LA | 3.0 | 2.5 | 2048 | $1,850 | $0.90 | 25d | 1 | 1.43mi |
| 9040 Bunker Hill Rd New Orleans, LA | 3.0 | 1.5 | 1400 | $1,450 | $1.04 | 17d | 1 | 1.47mi |
| 9042 Bunker Hill Rd New Orleans, LA | 3.0 | 1.5 | 1400 | $1,450 | $1.04 | 17d | 1 | 1.47mi |
| 9022 Bunker Hill Rd New Orleans, LA | 3.0 | 1.5 | 1400 | $1,400 | $1.00 | 25d | 1 | 1.48mi |
| 9020 Bunker Hill Rd New Orleans, LA | 3.0 | 1.5 | 1400 | $1,400 | $1.00 | 25d | 1 | 1.48mi |
Listing history 47 events
-
2026-06-21days on market $185,000 Active 109 DOM
-
2026-06-18days on market $185,000 Active 106 DOM
-
2026-06-17days on market $185,000 Active 105 DOM
-
2026-06-16days on market $185,000 Active 104 DOM
-
2026-06-15days on market $185,000 Active 103 DOM
-
2026-06-13days on market $185,000 Active 101 DOM
-
2026-06-10days on market $185,000 Active 98 DOM
-
2026-06-09days on market $185,000 Active 97 DOM
-
2026-06-08days on market $185,000 Active 96 DOM
-
2026-06-07days on market $185,000 Active 95 DOM
-
2026-06-05days on market $185,000 Active 92 DOM
-
2026-06-03days on market $185,000 Active 91 DOM
-
2026-06-02days on market $185,000 Active 90 DOM
-
2026-06-01days on market $185,000 Active 89 DOM
-
2026-05-31days on market $185,000 Active 88 DOM
-
2026-03-02$185,000 Active 926-char remark
Show marketing remark (928 chars)
Seller offering $3,000 in closing cost assistance with an acceptable offer. Must see, attractive home with great curb appeal in the convenient Read West neighborhood, just blocks from Joe Brown Park! Just under 1,600 sq ft, this home features a spacious open floor plan perfect for everyday living and entertaining, with a bright living, kitchen, and dining area. Offering 3 bedrooms, 2 full bathrooms, and a functional garage, this solid home includes updated electrical and plumbing, HVAC and roof only a few years old, tiled floors, large baseboards, beautiful trim throughout the main living areas, ceiling fans, and recessed lighting. Located in an established, sought-after area with great scenery, this beautifully elevated block has never flooded and is in Flood Zone X. Enjoy being just a bike ride away from the library, Lincoln Beach, and the anticipated Bayou Phoenix Family Entertainment Water Park & Lodging.
-
2026-03-02$185,000 Active 928-char remark
Show marketing remark (928 chars)
Seller offering $3,000 in closing cost assistance with an acceptable offer. Must see, attractive home with great curb appeal in the convenient Read West neighborhood, just blocks from Joe Brown Park! Just under 1,600 sq ft, this home features a spacious open floor plan perfect for everyday living and entertaining, with a bright living, kitchen, and dining area. Offering 3 bedrooms, 2 full bathrooms, and a functional garage, this solid home includes updated electrical and plumbing, HVAC and roof only a few years old, tiled floors, large baseboards, beautiful trim throughout the main living areas, ceiling fans, and recessed lighting. Located in an established, sought-after area with great scenery, this beautifully elevated block has never flooded and is in Flood Zone X. Enjoy being just a bike ride away from the library, Lincoln Beach, and the anticipated Bayou Phoenix Family Entertainment Water Park & Lodging.
-
2025-09-22price $185,000
-
2025-09-22price $185,000
-
2025-08-22$189,000 Active
-
2025-08-22$185,000 Active
-
2024-06-22price $175,000
-
2024-06-18price $179,000
-
2024-05-24$175,000 Active
-
2023-09-17price $185,000
-
2023-04-21price $190,000
-
2023-01-17$185,000
-
2022-08-23$205,000
-
2016-09-23historical
-
2016-06-08price $129,000
-
2016-03-22status Active
-
2016-03-22historical
-
2015-10-23price $139,000
-
2015-09-21$145,000 Active
-
2015-09-21$129,000
-
2014-01-06$145,500
-
2014-01-06$145,500
-
2012-09-04soldstatus $22,500
-
2012-05-29soldstatus $52,667
-
2012-04-25$23,000
-
2012-04-25$23,000
-
2011-01-11$50,000
-
2011-01-11$50,000
-
2001-02-22soldstatus $70,000
-
2001-02-22soldstatus $70,000
-
2001-01-24$70,000
-
2001-01-24$70,000
ⓘ Source: listings_history table (triggers on properties + properties_extension) + one-shot
backfill from property_details.listing_events for pre-trigger history.
Tax reassessment forecast LA · Resets to sale price
- Current annual tax
- $1,717 · $143/mo
- Projected year-2 tax
- $1,717 · $143/mo
- Expected delta
- $0/yr ($0/mo · 0.0%)
ⓘ Screening estimate from a state-policy table — verify with the county assessor before closing.
Climate risk First Street
- Flood 8/10 Severe FEMA zone X · 60% chance over 30 yrs
- Wildfire 1/10 Low
- Heat 10/10 Extreme 7 d/yr ≥108°F today · 22 d/yr by 30 yrs out
- Wind 10/10 Extreme 99% chance of damaging wind over 30 yrs
- Air quality 3/10 Moderate 3 unhealthy d/yr today · 3 by 30 yrs out
Nearby sold comps map
Loading sold comps map…
Walkable amenities ~0.75 mi
Loading nearby amenities…
Taxation est. · year 1
- Rental income
- $19,894
- − Mortgage interest
- −$10,363
- − Property taxes
- −$1,717
- − Insurance
- −$1,722
- − Repairs & maintenance
- −$1,592
- − Management
- −$1,592
- − Depreciation
- −$5,382
- Taxable loss
- −$2,473
- Est. tax savings @ 24.0%
- +$594
- After-tax cash flow
- $1,229/yr
For passive investors: Depreciation is non-cash, so a rental often shows a tax loss while cash-flowing — sheltering income. Rental losses are passive: they offset passive income freely, and up to $25,000/yr can offset ordinary (W-2) income if you actively participate and your MAGI is under $100k (phasing out to $0 by $150k); unused losses carry forward. On sale, claimed depreciation is recaptured at up to 25%, and gains may owe capital-gains tax (a 1031 exchange can defer both). Figures are a year-1 estimate at your 24.0% rate — not tax advice; consult a CPA.
Schools (NCES district)
- District
- Orleans Parish
- NCES district ID
- 2201170
- Math proficiency
- 11% ▼ -52.00%
- Reading proficiency
- 27% ▼ -46.00%
- Median HH income
- $37,011
- Composite
- 15.78/100
- National rank
- #9271
- State rank
- #69 of 98 in LA
Livability — New Orleans
- Score
- 81/100
- State rank
- #3
- US rank
- #1383
Category grades
Schools grade is shown separately in the Schools card above.
Census & demographics
- Census place
- New Orleans, LA
- County
- Orleans Parish · 338,817 people
- City population
- 338,817
- Metro
- New Orleans-Metairie, LA
- Population (ZIP)
- 23,107
- Household income
- $40,765
- Rent vs Own
- Severe rent burden
- 2030.0
Population outlook (Orleans County) Hauer SSP2
- Today (2025)
- 513,025 people
- By 2030
- 575,781 · +12.2%
- By 2040
- 700,174 · +36.5%
- By 2050
- 826,541 · +61.1%
- By 2075
- 1,123,374 · +119.0%
- By 2100
- 1,355,609 · +164.2%
Race, ethnicity, and origin ACS 2023
- Neighborhood character
- Predominantly Black (91%)
- Race & ethnicity
- Black 91% Hispanic / Latino 4% Two or more races 4% White 2%
- Common ancestry
- Lithuanian 1% Hispanic 1%
- Foreign-born
- 3% · Canada, Vietnam
- Languages at home
- 96% English-only · Spanish 2%
Political lean MEDSL · Orleans
- 2024 margin
- Solid D (+67.0) · D 82.2% · R 15.2% · Other 2.7%
- 2008→2024 swing
- +6.7pp toward D · 2008: 60.3pp · 2024: 67.0pp
- All cycles
- 2024: D+67.0 2020: D+68.2 2016: D+66.2 2012: D+62.5 2008: D+60.3
Not yet ingested
- Civics
- —
Market trends
- HPI YoY
- ▼ -72.43%
- Current HPI
- 175.4465
- Rent YoY
- —
- Metro
- New Orleans-Metairie, LA
- State GDP YoY
- ▲ 3.29%
- F500 in state
- 10
Industry mix (Fortune 500 HQ in LA)
| Industry | F500 HQs | Revenue |
|---|---|---|
| Telecommunications | 2 | $23B |
|
||
| Utilities | 1 | $12B |
|
||
| Wholesale / Distribution | 1 | $5B |
|
||
| Advertising | 1 | $2B |
|
||
Price history
+164.3% since first listed32 events — show timeline
- 2026-03-02 Listed $185,000 GSREIN
- 2026-03-02 Listed $185,000 AcadianaMLS
- 2025-09-22 Price Changed $185,000 AcadianaMLS
- 2025-09-22 Price Changed $185,000 GSREIN
- 2025-08-22 Listed $185,000 AcadianaMLS
- 2025-08-22 Listed $189,000 AcadianaMLS
- 2024-06-22 Price Changed $175,000 GSREIN
- 2024-06-18 Price Changed $179,000 GSREIN
- 2024-05-24 Listed $175,000 AcadianaMLS
- 2023-09-17 Price Changed $185,000 GSREIN
- 2023-04-21 Price Changed $190,000 GSREIN
- 2023-01-17 Listed $185,000 AcadianaMLS
- 2022-08-23 Listed $205,000 AcadianaMLS
- 2016-09-23 Listing Removed — GSREIN
- 2016-06-08 Price Changed $129,000 GSREIN
- 2016-03-22 Relisted — GSREIN
- 2016-03-22 Listing Removed — GSREIN
- 2015-10-23 Price Changed $139,000 GSREIN
- 2015-09-21 Listed $145,000 GSREIN
- 2015-09-21 Listed $129,000 AcadianaMLS
- 2014-01-06 Listed $145,500 GSREIN
- 2014-01-06 Listed $145,500 AcadianaMLS
- 2012-09-04 Sold (MLS) $22,500 GSREIN
- 2012-05-29 Sold (Public Records) $52,667 Public Records
- 2012-04-25 Listed $23,000 AcadianaMLS
- 2012-04-25 Listed $23,000 GSREIN
- 2011-01-11 Listed $50,000 GSREIN
- 2011-01-11 Listed $50,000 AcadianaMLS
- 2001-02-22 Sold (Public Records) $70,000 Public Records
- 2001-02-22 Sold (MLS) $70,000 GSREIN
- 2001-01-24 Listed $70,000 AcadianaMLS
- 2001-01-24 Listed $70,000 GSREIN
Property tax history
+7.4%/yrLatest (2026): $1,717 · +1.1% YoY. Source: county tax records.
Cash-flow waterfall
monthlySold comps — $/sqft
last 12 mo · ≤1 miLoading sold comps…