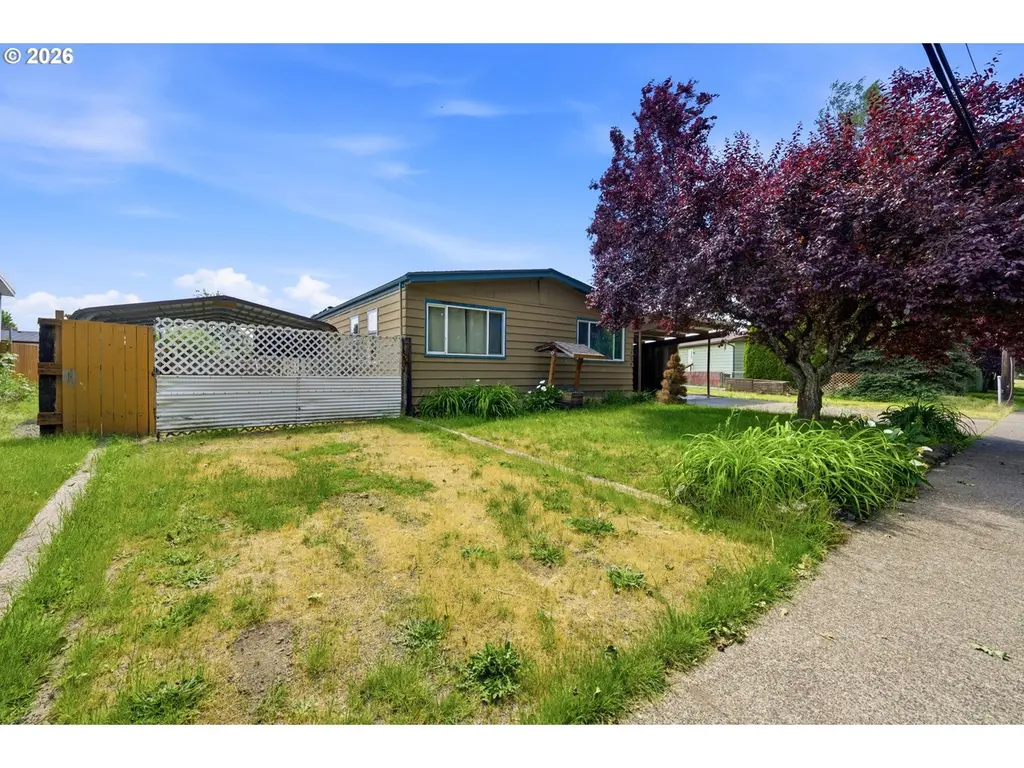
1404 NW Wallace Rd · McMinnville, OR
Flood risk 1/10 · Minimal
- FEMA flood zone
- X (unshaded)
- Chance of flooding over 30 yrs
- 0.0%
- Est. flood insurance / yr
- $507 – $1,088
Fire risk 4/10 · Minor
- Est. fire insurance / yr
- $498 – $926
Heat risk 3/10 · Minor
- Hot days now (above 93°F)
- 7 days/yr
- Hot days in 30 yrs
- 14 days/yr
Wind risk 1/10 · Minimal
- Chance of severe wind over 30 yrs
- —
Air-quality risk 8/10 · Major
- Unhealthy air days now
- 10 days/yr
- Unhealthy air days in 30 yrs
- 11 days/yr
Risk factors via First Street. Map © Google.
Why this score? — see what drove the B grade
The composite is a weighted blend of 9 inputs, each scored 0–100. Each bar is that input's sub-score; the figure is the points it added to the 100-point composite (weight × sub-score).
- Cash flow +30.0/30.0
- 1% rule +10.0/10.0
- DSCR +10.0/10.0
- ARV discount +7.5/15.0
- Schools +4.8/10.0
- Livability +3.8/5.0
- Rent growth +2.7/5.0
- Condition / age +2.5/5.0
- Appreciation +0.0/10.0
$100,000
🖨 Deal sheet (PDF) 📄 Offer letter ✓ Due diligence
Listing remarks
Don't miss a wonderful opportunity! Discover a charming double wide 1977 manufactured home with 4 bedrooms, 2 bathrooms, and 1,848 Sq Ft of living space, located just across from Michelbook Golf Course. This home is in a prime spot nearby from schools and downtown McMinnville, offering convenience and tranquility. With a separate dining area and laminate flooring, plus a bonus room for storage or an office, This home is bursting with potential. With a bit of TLC, you can transform it into your dream space. Don't miss this chance to create lasting memories in a welcoming neighborhood. Make sure to get park approved and schedule your showing soon to start envisioning your future in this speci
Key facts
- Laminate flooring
- Separate dining area
- Built 1977
Tags
Property features AI
Finance
- Financial info: Resale property
- HOA & community: Located in Squires Mobile West Estates (land lease community); Land lease monthly: $1,250 (lease expires April 30, 2027); Not a senior community
Exterior
- Parking: Carport; Off-street parking
- Utilities: Electric fuel; Public water; Public sewer
- Home design: Manufactured home in park; Single-story (main level living); No notable view
- Construction: Built in 1977; Composition and tar/gravel roof; Block and pier (pillar/post/pier) foundation; Manufacturer: SHELBURNE
- Exterior features: Deck; Fenced yard; Front porch; Aluminum exterior; Level lot; Concrete/paved road access
Interior
- Kitchen: Dishwasher; Free‑standing range; Free‑standing refrigerator; Microwave
- Bedrooms: Primary bedroom (main level); 2nd bedroom (main level); 3rd bedroom (main level); 4th bedroom (main level)
- Flooring: Laminate
- Bathrooms: 2 full bathrooms (both on main level)
- Heating & cooling: Wall furnace (heating); No central cooling
- Interior features: Laminate flooring; Vinyl window frames
- Laundry & utility: Main level laundry; Electric hot water
Neighborhood map
What this means for you Summary
Snapshot
- This is a 4-bed/2.5-bath manufactured listed at $100k.
Deal economics
- At list price, monthly cash flow is $1k ($16k/yr) — positive.
- The deal already cash-flows at list — no discount required.
- Meets the 1% rule at list price ($3k rent vs $100k).
- Recommended offer: $98k (1.5% below list) — sets the bar for market timing.
- Cap rate 22.7% vs local median 3.2% in McMinnville — top-decile yield for the area; either an underpriced asset or a hidden risk that comps aren't pricing in. Stress-test before assuming the spread holds.
Location & tenants
- Location reads 76/100 on livability (#79 in OR, #3,556 nationally) — a middle-class / working-renter tenant base. Strengths: health & safety A+, housing A, crime B; Watch: commute D+.
- Mcminnville SD 40 (town): math 50% / reading 58% proficiency, ranked #20 of 183 in OR (top 11%) — acceptable for families but not a draw, mixed tenant base, ~2y average lease.
- Zoned schools: Newby Elementary School (445 students, 70% FRL); Duniway Middle School (806 students, 66% FRL); Mcminnville High School (2,319 students, 38% FRL).
- Market conditions: Rents flat; 395 active listings in the ZIP; 13 comparable units currently listed for rent nearby; rentals at typical pace (median 26d on market — plan ~3-4 weeks tenant-placement turnaround); 46% of comp listings sitting > 30 days — soft ceiling on asking rent; solid renter incomes; 282 units permitted in Yamhill County in 2024 (0 in 5+ unit buildings).
- This rent runs 40% of the median local income ($76k/yr) — at the standard rent-burdened threshold; future hikes will face affordability resistance.
Forward outlook
- Local home prices are declining (-3.0%/yr); year-one equity from $691 of loan paydown is wiped out by about $3k of value loss. Plan a longer hold.
- Yamhill County population projected at +8% by 2050 — modest demand growth; plan on rents tracking national, not racing it.
- At projected returns (-3.0% appreciation + 0.8% rent growth), your $28k cash investment doubles in ~2 years — after that, you're playing with house money.
Negotiation context
- It's been on market 24 days — a 2% lower offer ($98k) is reasonable based on typical stale-listing flexibility.
Questions for the listing agent
- Built in 1977 — when were the roof, HVAC, electrical panel, plumbing, and water heater last replaced?
- Is there a deadline driving the sale (1031 exchange, divorce, estate, relocation)? That informs how much negotiation room exists.
- What's the average days-on-market for RENTAL listings here right now (not sales)? A rising rental-DOM trend means longer vacancies and softer asking-rent achievability than the comps imply.
- What's the recent tenant-quality profile in this submarket — average credit score on applications, eviction rate, late-payment / NSF rate, and stable-employment percentage? A property-management company in the area should have these aggregated.
- How much new for-sale + rental construction is in the pipeline within 1–3 miles? Heavy new supply typically softens prices + rents 12–24 months out; constrained supply supports both.
Investment metrics
- 1% rule
- 2.50% ✓
- Cap rate
- 22.69%
- Cash-on-cash
- 58.57%
- DSCR
- 3.61
- GRM
- 3.3
CMA / ARV
- ARV (on-the-fly)
- $432,432
- Comps found
- 8
Show comp detail 8 sales within ~0.75 mi
| Address | Dist | Beds/Ba | Sqft | Sold | Price | $/sf | Match |
|---|---|---|---|---|---|---|---|
| 1536 NW 7th Ct | 0.18mi | 3/2.0 (-1) | 1,872 (+1%) | 9mo | $125,000 | $67 | 75 |
| 925 NW Cypress St | 0.32mi | 4/2.0 | 1,848 (0%) | 19mo | $365,000 | $198 | 67 |
| 907 NW Cypress St | 0.30mi | 3/2.0 (-1) | 1,782 (-4%) | 8mo | $430,000 | $241 | 66 |
| 1073 NW Cypress St | 0.39mi | 3/2.0 (-1) | 1,764 (-4%) | 16mo | $404,000 | $229 | 54 |
| 981 NW Cypress St | 0.34mi | 3/3.0 (-1) | 1,782 (-4%) | 22mo | $405,000 | $227 | 53 |
| 1691 NW Del Monte Dr | 0.32mi | 3/2.0 (-1) | 1,725 (-7%) | 22mo | $404,000 | $234 | 48 |
| 1643 NW 6th St | 0.30mi | 3/2.0 (-1) | 1,616 (-13%) | 12mo | $399,000 | $247 | 48 |
| 1722 NW Wallace Rd | 0.35mi | 3/2.0 (-1) | 1,677 (-9%) | 23mo | $400,000 | $239 | 42 |
Match score weights: distance 35% · size 25% · config 20% · recency 20%. Top-matched comps best support the ARV.
Projected returns pro-forma
-3.0% appreciation · 0.79% rent growth · sell at horizon
- IRR
- 54.7%
- Equity multiple
- 3.34×
- Total profit
- $65,386
- Equity at exit
- $14,910
- IRR
- 59.0%
- Equity multiple
- 6.27×
- Total profit
- $147,608
- Equity at exit
- $8,646
Cash invested: $28,000 (down + closing). Projections, not guarantees.
Landlord ↔ Tenant lean methodology
- Overall (STATE)
- 28 Tenant-Leaning
- State Oregon
- 28 Tenant-Leaning · D+6
- County
- — inherits STATE
- City
- — inherits STATE
ZIP-level market 97128
- Rents YoY
- 0.8%
- Active inventory
- 395
- Price-to-rent
- 3.3×
Monthly cashflow live
- Estimated rent
- $2,501 high interval (Pro) →
- Mortgage (P&I)
- −$524
- Tax from tax record
- −$43 /mo · $519/yr
- Insurance
- −$42
- HOA
- −$0
- Vacancy / Maint / Mgmt
- −$525
- Net cashflow
- $1,367
Break-even live
Sensitivity live
| Price | -10% $1,423 | -5% $1,395 | +0% $1,367 | +5% $1,338 | +10% $1,310 |
|---|---|---|---|---|---|
| Rent | -10% $1,169 | -5% $1,268 | +0% $1,367 | +5% $1,465 | +10% $1,564 |
| Rate | -1.0pp $1,417 | -0.5pp $1,392 | base $1,367 | +0.5pp $1,341 | +1.0pp $1,314 |
UW: 25.0% down · 7.5% · 30yr · 1.5% tax · 5.0% vac · 8.0% maint · 8.0% mgmt
Financing live
Cash to close
- Down payment
- $25,000
- Closing costs
- $3,000
- Reserves months
- —
- Total cash needed
- —
Loan-product check · same deal, 3 products live
Conventional
25% down · 7.5% · 30yr
- Down + closing
- —
- Monthly P&I
- —
- Monthly cashflow
- —
- DSCR
- —
- Eligible?
- —
Personal DTI + credit; lowest rate.
DSCR
20% down · 8.5% · 30yr
- Down + closing
- —
- Monthly P&I
- —
- Monthly cashflow
- —
- DSCR
- —
- Eligible?
- —
No personal income docs; deal must DSCR.
Hard money
10% down · 12.0% · 12mo
- Down + closing
- —
- Monthly P&I
- —
- Monthly cashflow
- —
- DSCR
- —
- Eligible?
- —
Short-term bridge; refi at stabilization.
Rent comps 13 comps
| Address | Beds | Baths | Sqft | Rent | $/sqft | DOM | Units | Dist |
|---|---|---|---|---|---|---|---|---|
| 136 SW Sharon Jane Pl McMinnville, OR | 3.0 | 2.0 | 1477 | $2,150 | $1.46 | 24d | 1 | 0.41mi |
| 140 SW Daniels St McMinnville, OR | 3.0 | 1.0 | 1524 | $1,995 | $1.31 | 26d | 1 | 0.43mi |
| 1795 NW 2nd St McMinnville, OR | 2.0–4.0 | 1.0 | 1250 | $2,150 | $1.72 | 0d | 2 | 0.47mi |
| 467 NW Meadows Dr McMinnville, OR | 3.0 | 2.0 | 1278 | $2,100 | $1.64 | 46d | 1 | 0.55mi |
| 1302 SW Wright St McMinnville, OR | 3.0 | 2.5 | 1763 | $2,400 | $1.36 | 46d | 1 | 0.60mi |
| 939 SW Fellows Ct McMinnville, OR | 3.0 | 2.0 | 1729 | $2,375 | $1.37 | 46d | 1 | 0.79mi |
| 2280 NW Fendle Way McMinnville, OR | 3.0 | 2.0 | 1473 | $2,449 | $1.66 | 46d | 1 | 0.86mi |
| 1809 NW 23rd St McMinnville, OR | 3.0 | 2.5 | 1440 | $2,200 | $1.53 | 24d | 1 | 0.87mi |
| 417 SW Pemberly Loop McMinnville, OR | 3.0 | 2.5 | 1700 | $2,200 | $1.29 | 46d | 1 | 0.95mi |
| 2372 NW Meadows Dr Unit 1550268P McMinnville, OR | 3.0 | 2.0 | 1539 | $2,954 | $1.92 | 4d | 1 | 0.95mi |
| 1149 SW Brockwood Ave McMinnville, OR | 3.0 | 2.0 | 1432 | $3,600 | $2.51 | 26d | 1 | 1.02mi |
| 982 SW Hawthorne St McMinnville, OR | 3.0 | 2.0 | 1458 | $2,375 | $1.63 | 24d | 1 | 1.05mi |
| 1116 SE Millright Ave McMinnville, OR | 3.0 | 2.5 | 1652 | $2,300 | $1.39 | 46d | 1 | 1.32mi |
Listing history 16 events
-
2026-06-21days on market $100,000 Active 24 DOM
-
2026-06-18days on market $100,000 Active 21 DOM
-
2026-06-17days on market $100,000 Active 20 DOM
-
2026-06-16days on market $100,000 Active 19 DOM
-
2026-06-15days on market $100,000 Active 18 DOM
-
2026-06-13days on market $100,000 Active 16 DOM
-
2026-06-13days on market $100,000 Active 15 DOM
-
2026-06-09days on market $100,000 Active 12 DOM
-
2026-06-08days on market $100,000 Active 11 DOM
-
2026-06-07days on market $100,000 Active 10 DOM
-
2026-06-05days on market $100,000 Active 7 DOM
-
2026-06-03days on market $100,000 Active 6 DOM
-
2026-06-02days on market $100,000 Active 5 DOM
-
2026-06-01days on market $100,000 Active 4 DOM
-
2026-05-31days on market $100,000 Active 3 DOM
-
2026-05-28$100,000 Active
ⓘ Source: listings_history table (triggers on properties + properties_extension) + one-shot
backfill from property_details.listing_events for pre-trigger history.
Tax reassessment forecast OR · Resets to sale price
- Current annual tax
- $519 · $43/mo
- Projected year-2 tax
- $970 · $81/mo
- Expected delta
- +$451/yr (+$38/mo · 86.9%)
ⓘ Screening estimate from a state-policy table — verify with the county assessor before closing.
Climate risk First Street
- Flood 1/10 Low FEMA zone X (unshaded) · 0% chance over 30 yrs
- Wildfire 4/10 Moderate
- Heat 3/10 Moderate 7 d/yr ≥93°F today · 14 d/yr by 30 yrs out
- Wind 1/10 Low
- Air quality 8/10 Severe 10 unhealthy d/yr today · 11 by 30 yrs out
Nearby sold comps map
Loading sold comps map…
Walkable amenities ~0.75 mi
Loading nearby amenities…
Taxation est. · year 1
- Rental income
- $30,015
- − Mortgage interest
- −$5,602
- − Property taxes
- −$519
- − Insurance
- −$500
- − Repairs & maintenance
- −$2,401
- − Management
- −$2,401
- − Depreciation
- −$2,909
- Taxable income
- $15,683
- Est. tax owed @ 24.0%
- −$3,764
- After-tax cash flow
- $12,636/yr
For passive investors: Depreciation is non-cash, so a rental often shows a tax loss while cash-flowing — sheltering income. Rental losses are passive: they offset passive income freely, and up to $25,000/yr can offset ordinary (W-2) income if you actively participate and your MAGI is under $100k (phasing out to $0 by $150k); unused losses carry forward. On sale, claimed depreciation is recaptured at up to 25%, and gains may owe capital-gains tax (a 1031 exchange can defer both). Figures are a year-1 estimate at your 24.0% rate — not tax advice; consult a CPA.
Schools (NCES district)
- District
- Mcminnville SD 40
- NCES district ID
- 4108010
- Math proficiency
- 50% ▼ -1.00%
- Reading proficiency
- 58% ▼ -1.00%
- Median HH income
- $47,382
- Composite
- 47.69/100
- National rank
- #4919
- State rank
- #20 of 183 in OR
Livability — McMinnville
- Score
- 76/100
- State rank
- #79
- US rank
- #3556
Category grades
Schools grade is shown separately in the Schools card above.
Census & demographics
- Census place
- McMinnville, OR
- County
- Yamhill County · 71,150 people
- City population
- 38,664
- Metro
- Portland-Vancouver-Hillsboro, OR-WA
- Population (ZIP)
- 38,664
- Household income
- $75,896
- Rent vs Own
- Severe rent burden
- 1508.0
Population outlook (Yamhill County) Hauer SSP2
- Today (2025)
- 109,295 people
- By 2030
- 112,060 · +2.5%
- By 2040
- 115,975 · +6.1%
- By 2050
- 118,155 · +8.1%
- By 2075
- 120,968 · +10.7%
- By 2100
- 116,163 · +6.3%
Race, ethnicity, and origin ACS 2023
- Neighborhood character
- Predominantly White (72%)
- Race & ethnicity
- White 72% Hispanic / Latino 19% Two or more races 14% Asian 2%
- Hispanic origin (detail)
- Mexican 17%
- Common ancestry
- Italian 6% Portuguese 3% Slovak 3%
- Foreign-born
- 9% · Canada, China, South Korea
- Languages at home
- 85% English-only · Spanish 13% Chinese 1% German/W. Germanic 1%
Political lean MEDSL · Yamhill
- 2024 margin
- Lean R (+6.1) · D 45.3% · R 51.4% · Other 3.3%
- 2008→2024 swing
- -4.8pp toward R · 2008: -1.4pp · 2024: -6.1pp
- All cycles
- 2024: R+6.1 2020: R+4.0 2016: R+8.8 2012: R+6.7 2008: R+1.4
Not yet ingested
- Civics
- —
Market trends
- HPI YoY
- ▼ -201.59%
- Current HPI
- 320.373
- Rent YoY
- ▲ 0.79%
- Metro
- Portland-Vancouver-Hillsboro, OR-WA
- State GDP YoY
- ▲ 2.05%
- F500 in state
- 2
Industry mix (Fortune 500 HQ in OR)
| Industry | F500 HQs | Revenue |
|---|---|---|
| Consumer Goods | 1 | $51B |
|
||
Price history
1 event — show timeline
- 2026-05-28 Listed $100,000 RMLS
Property tax history
+2.4%/yrLatest (2025): $519 · +4.0% YoY. Source: county tax records.
Cash-flow waterfall
monthlySold comps — $/sqft
last 12 mo · ≤1 miLoading sold comps…