 Multi-family
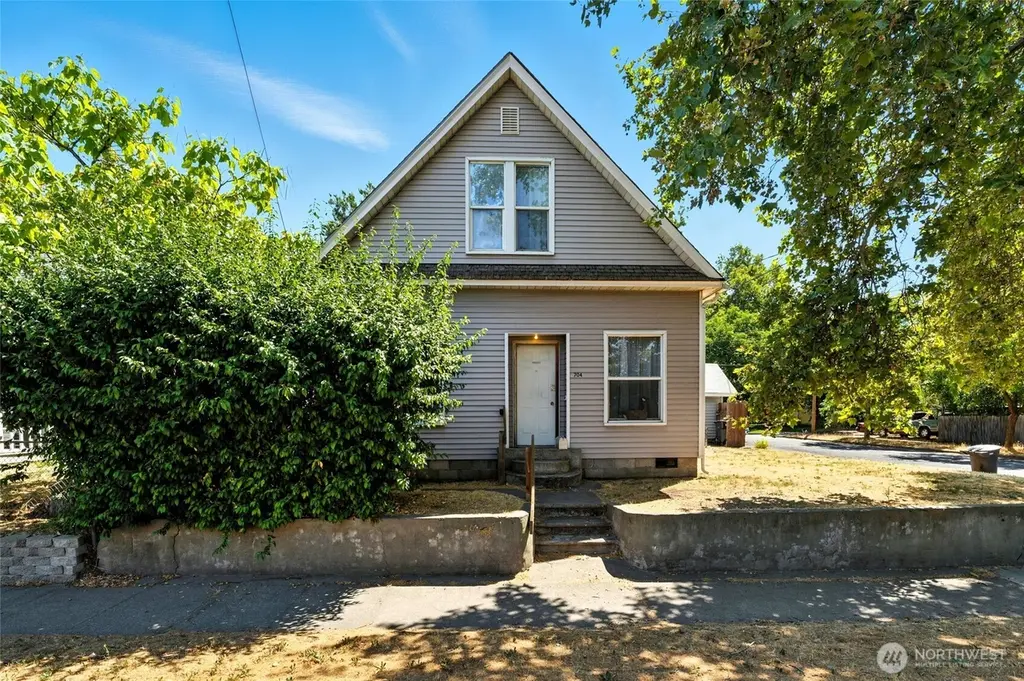
704 N Rose St · Walla Walla, WA
Flood risk 1/10 · Minimal
- FEMA flood zone
- —
- Chance of flooding over 30 yrs
- 0.0%
- Est. flood insurance / yr
- —
Fire risk 1/10 · Minimal
- Est. fire insurance / yr
- $604 – $1,122
Heat risk 4/10 · Minor
- Hot days now (above 98°F)
- 7 days/yr
- Hot days in 30 yrs
- 14 days/yr
Wind risk 1/10 · Minimal
- Chance of severe wind over 30 yrs
- —
Air-quality risk 8/10 · Major
- Unhealthy air days now
- 9 days/yr
- Unhealthy air days in 30 yrs
- 13 days/yr
Risk factors via First Street. Map © Google.
Why this score? — see what drove the C- grade
The composite is a weighted blend of 9 inputs, each scored 0–100. Each bar is that input's sub-score; the figure is the points it added to the 100-point composite (weight × sub-score).
- Cash flow +15.0/30.0
- ARV discount +15.0/15.0
- DSCR +4.6/10.0
- Schools +4.1/10.0
- Livability +4.0/5.0
- 1% rule +3.9/10.0
- Rent growth +3.1/5.0
- Condition / age +2.5/5.0
- Appreciation +0.0/10.0
$279,000
🖨 Deal sheet 📄 Offer letter ✓ Due diligence
Multi-family units
County records classify this as Multi-Family (2-4 Unit). Listing-text estimate: 1 unit. estimate disagrees with records
Listing remarks
Prime opportunity near Downtown Walla Walla and Whitman College! This 5-bedroom, 2-bath single-family home sits on a spacious corner lot just blocks from downtown and the college, an ideal location for strong rental demand or convenient in-town living. Currently leased through May, the property offers immediate income with long-term upside. Inside, you’ll find generous living space and a flexible floor plan to suit a variety of needs. Outside, enjoy a detached one-car garage and plenty of yard space. Whether you’re expanding your investment portfolio or searching for a well-located home close to downtown, this is an opportunity you won’t want to miss.
Key facts
- Plenty of yard space
- Flexible floor plan
- Corner lot
Tags
Neighborhood map
What this means for you Summary
Snapshot
- This is a 4-bed/1.0-bath multifamily listed at $279k.
Deal economics
- At list price, monthly cash flow is $86 ($1k/yr) — positive.
- The deal already cash-flows at list — no discount required.
- To meet the 1% rule (rent ≥ 1% of price), the offer needs to be $249k (10.9% below list).
- Recommended offer: $249k (10.9% below list) — sets the bar for 1% rule.
- Cap rate 6.7% vs local median 2.3% in Walla Walla — top-decile yield for the area; either an underpriced asset or a hidden risk that comps aren't pricing in. Stress-test before assuming the spread holds.
Location & tenants
- Location reads 79/100 on livability (#105 in WA, #2,015 nationally) — a middle-class / working-renter tenant base. Strengths: amenities A+, commute A+, housing A+; Watch: schools C-.
- Walla Walla Public Schools (urban): math 41% / reading 50% proficiency, ranked #179 of 291 in WA (top 62%) — families likely to look elsewhere, expect single-tenant / working-renter base with shorter leases.
- Market conditions: Rents rising (+2.4%/yr); 422 active listings in the ZIP; 3 comparable units currently listed for rent nearby; rentals lingering (median 44d on market — plan ~5-8 weeks vacancy on turnover, expect pricing pressure); 67% of comp listings sitting > 30 days — soft ceiling on asking rent; 206 units permitted in Walla Walla County in 2024 (50 in 5+ unit buildings).
- This rent runs 41% of the median local income ($72k/yr) — at the standard rent-burdened threshold; future hikes will face affordability resistance.
Forward outlook
- Local home prices are declining (-3.0%/yr); year-one equity from $2k of loan paydown is wiped out by about $8k of value loss. Plan a longer hold.
- Walla Walla County population projected at +8% by 2050 — modest demand growth; plan on rents tracking national, not racing it.
Negotiation context
- It's been on market 64 days — a 6% lower offer ($262k) is reasonable based on typical stale-listing flexibility.
- Current owner paid $72k; list at $279k implies a 288% gain — meaningful room to come down on a strong offer.
Risks & watch-outs
- Watch-outs: built in 1908 — expect roof / HVAC / electrical / plumbing capex.
Questions for the listing agent
- It's been on market 64 days. Have you received any prior offers? Is the seller open to a 11% concession, seller financing, or rate buy-down credit?
- Built in 1908 — when were the roof, HVAC, electrical panel, plumbing, and water heater last replaced?
- Why hasn't it sold? Are there any deal-killer items the seller is aware of (foundation, flood, title, zoning, code violations)?
- Is there a deadline driving the sale (1031 exchange, divorce, estate, relocation)? That informs how much negotiation room exists.
- What's the average days-on-market for RENTAL listings here right now (not sales)? A rising rental-DOM trend means longer vacancies and softer asking-rent achievability than the comps imply.
- What's the recent tenant-quality profile in this submarket — average credit score on applications, eviction rate, late-payment / NSF rate, and stable-employment percentage? A property-management company in the area should have these aggregated.
- How much new apartment / multifamily construction is in the pipeline within 1–3 miles? Heavy new supply (>2% of stock underway) typically softens rents 12–24 months out; light construction supports rent growth.
Investment metrics
- 1% rule
- 0.89% ✗
- Cap rate
- 6.66%
- Cash-on-cash
- 1.32%
- DSCR
- 1.06
- GRM
- 9.4
CMA / ARV
- ARV (median comp)
- $398,515
- List price
- $279,000
- Delta
- -29.99%
- Verdict
- UNDERPRICED
- Comps
- 20 within 1.0 mi
Projected returns pro-forma
-3.0% appreciation · 2.4% rent growth · sell at horizon
- IRR
- -14.9%
- Equity multiple
- 0.47×
- Total profit
- $-41,215
- Equity at exit
- $41,600
- IRR
- -7.2%
- Equity multiple
- 0.55×
- Total profit
- $-34,855
- Equity at exit
- $24,123
Cash invested: $78,120 (down + closing). Projections, not guarantees.
Landlord ↔ Tenant lean methodology
- Overall (STATE)
- 28 Tenant-Leaning
- State Washington
- 28 Tenant-Leaning · D+8
- County
- — inherits STATE
- City
- — inherits STATE
ZIP-level market 99362
- Rents YoY
- 2.4%
- Active inventory
- 422
- Price-to-rent
- 9.4×
Monthly cashflow live
- Estimated rent
- $2,486 medium interval (Pro) →
- Mortgage (P&I)
- −$1,463
- Tax from tax record
- −$299 /mo · $3,585/yr
- Insurance
- −$116
- HOA
- −$0
- Vacancy / Maint / Mgmt
- −$522
- Net cashflow
- $86
Break-even live
UW: 25.0% down · 7.5% · 30yr · 1.5% tax · 5.0% vac · 8.0% maint · 8.0% mgmt
Financing live
Cash to close
- Down payment
- $69,750
- Closing costs
- $8,370
- Reserves months
- —
- Total cash needed
- —
Loan-product check · same deal, 3 products live
Conventional
25% down · 7.5% · 30yr
- Down + closing
- —
- Monthly P&I
- —
- Monthly cashflow
- —
- DSCR
- —
- Eligible?
- —
Personal DTI + credit; lowest rate.
DSCR
20% down · 8.5% · 30yr
- Down + closing
- —
- Monthly P&I
- —
- Monthly cashflow
- —
- DSCR
- —
- Eligible?
- —
No personal income docs; deal must DSCR.
Hard money
10% down · 12.0% · 12mo
- Down + closing
- —
- Monthly P&I
- —
- Monthly cashflow
- —
- DSCR
- —
- Eligible?
- —
Short-term bridge; refi at stabilization.
Rent comps 3 comps
| Address | Beds | Baths | Sqft | Rent | $/sqft | DOM | Units | Dist |
|---|---|---|---|---|---|---|---|---|
| 1055 E Isaacs Ave Unit B Walla Walla, WA | 5.0 | 2.0 | 1600 | $3,000 | $1.88 | 43d | 1 | 0.41mi |
| 643 Ava St Walla Walla, WA | 3.0 | 2.0 | 1574 | $2,495 | $1.59 | 21d | 1 | 0.53mi |
| 425 N 7th Ave Apt 2 Walla Walla, WA | 4.0 | 2.5 | 1697 | $1,795 | $1.06 | 43d | 1 | 0.85mi |
Listing history 18 events
-
2026-06-19days on market $279,000 Active 64 DOM
-
2026-06-18days on market $279,000 Active 63 DOM
-
2026-06-17days on market $279,000 Active 62 DOM
-
2026-06-16days on market $279,000 Active 61 DOM
-
2026-06-15days on market $279,000 Active 60 DOM
-
2026-06-14days on market $279,000 Active 58 DOM
-
2026-06-12pricedays on market $279,000 Active 57 DOM
-
2026-06-09days on market $299,000 Active 54 DOM
-
2026-06-08days on market $299,000 Active 53 DOM
-
2026-06-07days on market $299,000 Active 52 DOM
-
2026-06-02days on market $299,000 Active 47 DOM
-
2026-06-01days on market $299,000 Active 46 DOM
-
2026-05-31days on market $299,000 Active 45 DOM
-
2026-05-30days on market $299,000 Active 44 DOM
-
2026-04-27price $299,000
-
2026-04-16$369,000 Active
-
2003-09-05soldstatus $72,000
-
1984-05-07soldstatus $25,800
ⓘ Source: listings_history table (triggers on properties + properties_extension) + one-shot
backfill from property_details.listing_events for pre-trigger history.
Tax reassessment forecast WA · Resets to sale price
- Current annual tax
- $3,585 · $299/mo
- Projected year-2 tax
- $3,585 · $299/mo
- Expected delta
- $0/yr ($0/mo · 0.0%)
ⓘ Screening estimate from a state-policy table — verify with the county assessor before closing.
Climate risk First Street
- Flood 1/10 Low 0% chance over 30 yrs
- Wildfire 1/10 Low
- Heat 4/10 Moderate 7 d/yr ≥98°F today · 14 d/yr by 30 yrs out
- Wind 1/10 Low
- Air quality 8/10 Severe 9 unhealthy d/yr today · 13 by 30 yrs out
Nearby sold comps map
Loading sold comps map…
Walkable amenities ~0.75 mi
Loading nearby amenities…
Taxation est. · year 1
- Rental income
- $29,835
- − Mortgage interest
- −$15,628
- − Property taxes
- −$3,585
- − Insurance
- −$1,395
- − Repairs & maintenance
- −$2,387
- − Management
- −$2,387
- − Depreciation
- −$8,116
- Taxable loss
- −$3,663
- Est. tax savings @ 24.0%
- +$879
- After-tax cash flow
- $1,912/yr
For passive investors: Depreciation is non-cash, so a rental often shows a tax loss while cash-flowing — sheltering income. Rental losses are passive: they offset passive income freely, and up to $25,000/yr can offset ordinary (W-2) income if you actively participate and your MAGI is under $100k (phasing out to $0 by $150k); unused losses carry forward. On sale, claimed depreciation is recaptured at up to 25%, and gains may owe capital-gains tax (a 1031 exchange can defer both). Figures are a year-1 estimate at your 24.0% rate — not tax advice; consult a CPA.
Schools (NCES district)
- District
- Walla Walla Public Schools
- NCES district ID
- 5309450
- Math proficiency
- 41% ▲ 3.00%
- Reading proficiency
- 50% ▼ -1.00%
- Median HH income
- $46,207
- Composite
- 40.88/100
- National rank
- #7531
- State rank
- #179 of 291 in WA
Livability — Walla Walla
- Score
- 79/100
- State rank
- #105
- US rank
- #2015
Category grades
Schools grade is shown separately in the Schools card above.
Census & demographics
- Census place
- Walla Walla, WA
- County
- Walla Walla County · 52,990 people
- City population
- 42,853
- Metro
- Walla Walla, WA
- Population (ZIP)
- 42,853
- Household income
- $72,474
- Rent vs Own
- Severe rent burden
- 1238.0
Population outlook (Walla Walla County) Hauer SSP2
- Today (2025)
- 63,088 people
- By 2030
- 64,417 · +2.1%
- By 2040
- 66,563 · +5.5%
- By 2050
- 68,337 · +8.3%
- By 2075
- 73,235 · +16.1%
- By 2100
- 74,878 · +18.7%
Race, ethnicity, and origin ACS 2023
- Neighborhood character
- Predominantly White (69%)
- Race & ethnicity
- White 69% Hispanic / Latino 22% Two or more races 9% Black 2% Asian 2% Native American 2%
- Hispanic origin (detail)
- Mexican 17%
- Common ancestry
- Slovak 3% Portuguese 3% Lithuanian 3%
- Foreign-born
- 9% · Canada, China
- Languages at home
- 83% English-only · Spanish 15% Chinese 1%
Political lean MEDSL · Walla Walla
- 2024 margin
- Lean R (+8.1) · D 44.6% · R 52.7% · Other 2.7%
- 2008→2024 swing
- +8.5pp toward D · 2008: -16.6pp · 2024: -8.1pp
- All cycles
- 2024: R+8.1 2020: R+8.7 2016: R+16.4 2012: R+22.3 2008: R+16.6
Not yet ingested
- Civics
- —
Market trends
- HPI YoY
- ▼ -488.03%
- Current HPI
- 321.6891
- Rent YoY
- ▲ 2.40%
- Metro
- Walla Walla, WA
- State GDP YoY
- ▲ 4.65%
- F500 in state
- 22
Industry mix (Fortune 500 HQ in WA)
| Industry | F500 HQs | Revenue |
|---|---|---|
| Retail | 2 | $269B |
|
||
| Technology / Retail | 1 | $638B |
|
||
| Technology | 1 | $245B |
|
||
| Telecommunications | 1 | $38B |
|
||
| Food / Beverage | 1 | $36B |
|
||
| Automotive / Trucks | 1 | $34B |
|
||
Price history
+1058.9% since first listed4 events — show timeline
- 2026-04-27 Price Changed $299,000 NWMLS as Distributed by MLS Grid
- 2026-04-16 Listed $369,000 NWMLS as Distributed by MLS Grid
- 2003-09-05 Sold (Public Records) $72,000 Public Records
- 1984-05-07 Sold (Public Records) $25,800 Public Records
Property tax history
+6.5%/yrLatest (2026): $3,585 · -1.3% YoY. Source: county tax records.
Cash-flow waterfall
monthlySold comps — $/sqft
last 12 mo · ≤1 miLoading sold comps…