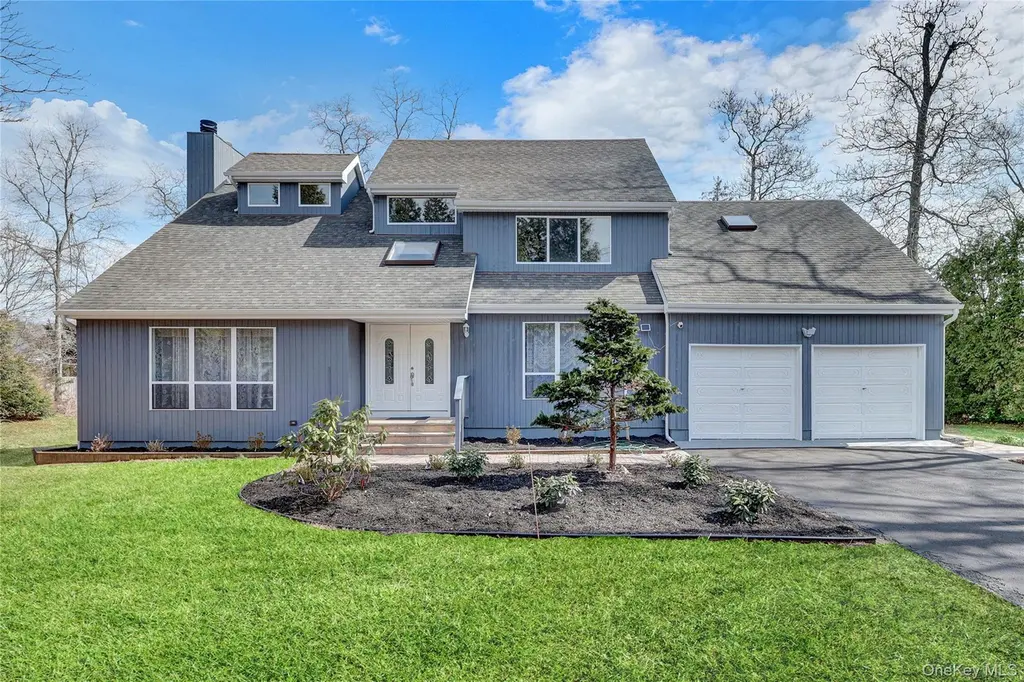
242 Trout Brook Ln · Aquebogue, NY
Flood risk 6/10 · Moderate
- FEMA flood zone
- X (unshaded)
- Chance of flooding over 30 yrs
- 0.7%
- Est. flood insurance / yr
- $473 – $860
Fire risk 2/10 · Minimal
- Est. fire insurance / yr
- $691 – $1,283
Heat risk 5/10 · Moderate
- Hot days now (above 91°F)
- 7 days/yr
- Hot days in 30 yrs
- 19 days/yr
Wind risk 8/10 · Major
- Chance of severe wind over 30 yrs
- 80.0%
Air-quality risk 3/10 · Minor
- Unhealthy air days now
- 2 days/yr
- Unhealthy air days in 30 yrs
- 3 days/yr
Risk factors via First Street. Map © Google.
Why this score? — see what drove the B grade
The composite is a weighted blend of 9 inputs, each scored 0–100. Each bar is that input's sub-score; the figure is the points it added to the 100-point composite (weight × sub-score).
- Cash flow +30.0/30.0
- 1% rule +10.0/10.0
- DSCR +10.0/10.0
- ARV discount +9.3/15.0
- Schools +3.6/10.0
- Livability +3.1/5.0
- Rent growth +2.5/5.0
- Condition / age +2.5/5.0
- Appreciation +0.0/10.0
$825,000
🖨 Deal sheet (PDF) 📄 Offer letter ✓ Due diligence
Listing remarks
Welcome to 242 Trout Brook Lane located on a desirable & serene cul-de-sac in the wonderful town of Aquebogue, gateway to wine country & The Hamptons! The first floor of this stunning 4 bedroom, 2.5 bath home offers a kitchen with light textured granite and maple cabinets, a dining room with an elegant fireplace, a living room, a den, and a laundry room with half bath. The second floor offers a primary bedroom ensuite with full bath, three additional bedrooms and a second full bath. The home also boasts central air conditioning, hard wood floors, a 2 car garage and a rear deck so you can view the half acre property with plenty of room for a pool or anything else you might want f
Key facts
- 0.47 acre lot
- 2 garage spots
- Built 1987
Property features AI
Exterior
- Parking: Driveway; On-street parking; 2-car garage
- Utilities: Cesspool sewer; Water connected; Electricity connected; Trash collection (public); Cable available; Phone available; Underground utilities
- Home design: Single family residence; Two levels
- Construction: Wood siding construction; Full basement (unfinished); Pull-down attic stairs
- Exterior features: Wood siding; Back yard with wood fencing; Not waterfront
Interior
- Kitchen: Dishwasher; Electric cooktop; Electric oven; Electric range; Microwave; Stainless steel appliances; Granite countertops; Kitchen island; Pantry; Eat-in kitchen
- Bedrooms: Two-level home (bedrooms on multiple levels possible)
- Flooring: Hardwood floors
- Bathrooms: 2 full bathrooms; 1 half bathroom; Basement with unfinished area
- Heating & cooling: Oil heating; Central air conditioning; Fireplace (1)
- Interior features: First-floor full bath; Chandelier; Eat-in kitchen; Entrance foyer; Formal dining room; Granite counters; High ceilings; Kitchen island; Pantry; Recessed lighting; Storage; Walk-through kitchen
- Laundry & utility: Laundry room with washer hookup; In-hall laundry; Washer hookup; Electric dryer hookup
Neighborhood map
What this means for you Summary
Snapshot
- This is a 4-bed/2.5-bath single-family listed at $825k.
Deal economics
- At list price, monthly cash flow is $9k ($113k/yr) — positive.
- The deal already cash-flows at list — no discount required.
- Meets the 1% rule at list price ($19k rent vs $825k).
- Recommended offer: $813k (1.5% below list) — sets the bar for market timing.
Location & tenants
- Location reads 62/100 on livability (#887 in NY) — a middle-class / working-renter tenant base. Strengths: crime A+, employment A+, housing A+; Watch: amenities F, commute F, cost of living F.
- Riverhead Central School District (suburban): math 34% / reading 48% proficiency, ranked #489 of 590 in NY (top 83%) — families likely to look elsewhere, expect single-tenant / working-renter base with shorter leases.
- Zoned schools: Aquebogue Elementary School (math 47% / reading 57%, grade C-, #988 of 2,108 statewide, top 49%, 474 students, 40% FRL); Riverhead Middle School (math 18% / reading 35%, grade F, #594 of 729 statewide, top 81%, 827 students, 57% FRL); Riverhead Senior High School (math 80% / reading 86%, grade A, #440 of 1,100 statewide, top 40%, 2,001 students, 52% FRL).
- Zoned-school proficiency averages 54% at this address vs 41% district-wide (+13 pts) — the actual schools serving this property are materially stronger than the Riverhead Central School District average implies; a family-tenant draw the district grade alone would hide.
- Market conditions: 192 active listings in the ZIP; 3 comparable units currently listed for rent nearby; rentals lingering (median 45d on market — plan ~5-8 weeks vacancy on turnover, expect pricing pressure); 67% of comp listings sitting > 30 days — soft ceiling on asking rent; 1,366 units permitted in Suffolk County in 2024 (216 in 5+ unit buildings).
Forward outlook
- Local home prices are declining (-3.0%/yr); year-one equity from $6k of loan paydown is wiped out by about $25k of value loss. Plan a longer hold.
- Suffolk County population projected to shrink 5% by 2050 — rents likely to lag national; underwrite the cash flow, not the appreciation.
- At projected returns (-3.0% appreciation + 3.0% rent growth), your $231k cash investment doubles in ~3 years — after that, you're playing with house money.
Negotiation context
- It's been on market 27 days — a 2% lower offer ($813k) is reasonable based on typical stale-listing flexibility.
- Current owner paid $525k; list at $825k implies a 57% gain — meaningful room to come down on a strong offer.
Risks & watch-outs
- Climate carrying-cost: major flood risk; severe wind risk, 80% chance of damaging wind over 30y; extreme-heat days projected 7→19/yr by 2055 (HVAC capex compounding) — expect insurance premiums to compound above CPI over the hold.
Questions for the listing agent
- Is there a deadline driving the sale (1031 exchange, divorce, estate, relocation)? That informs how much negotiation room exists.
- Schools are B-rated — typically a magnet for longer-tenancy family renters. What's the average tenant stay here, and is there a school-zone premium baked into asking?
- What's the average days-on-market for RENTAL listings here right now (not sales)? A rising rental-DOM trend means longer vacancies and softer asking-rent achievability than the comps imply.
- What's the recent tenant-quality profile in this submarket — average credit score on applications, eviction rate, late-payment / NSF rate, and stable-employment percentage? A property-management company in the area should have these aggregated.
- How much new for-sale + rental construction is in the pipeline within 1–3 miles? Heavy new supply typically softens prices + rents 12–24 months out; constrained supply supports both.
Investment metrics
- 1% rule
- 2.30% ✓
- Cap rate
- 19.95%
- Cash-on-cash
- 48.76%
- DSCR
- 3.17
- GRM
- 3.6
CMA / ARV
- ARV (on-the-fly)
- $858,486
- Comps found
- 10
Show comp detail 10 sales within ~0.75 mi
| Address | Dist | Beds/Ba | Sqft | Sold | Price | $/sf | Match |
|---|---|---|---|---|---|---|---|
| 117 Trout Brook Ln | 0.28mi | 3/2.0 (-1) | 2,156 (-0%) | 2mo | $757,350 | $351 | 78 |
| 170 Grant Dr | 0.11mi | 4/2.5 | 2,129 (-1%) | 18mo | $905,000 | $425 | 77 |
| 133 Trout Brook Ln | 0.24mi | 4/2.0 | 2,301 (+7%) | 2mo | $780,000 | $339 | 74 |
| 97 Grant Dr | 0.11mi | 3/2.5 (-1) | 1,900 (-12%) | 9mo | $950,000 | $500 | 62 |
| 34 Colonial Dr | 0.11mi | 3/2.5 (-1) | 1,950 (-10%) | 18mo | $867,000 | $445 | 59 |
| 29 Linda Ave | 0.33mi | 4/3.0 | 1,900 (-12%) | 5mo | $670,000 | $353 | 58 |
| 195 Linda Ave | 0.13mi | 3/2.5 (-1) | 1,950 (-10%) | 21mo | $725,000 | $372 | 56 |
| 153 Fox Run Ln | 0.33mi | 3/2.0 (-1) | 1,900 (-12%) | 17mo | $775,000 | $408 | 44 |
| 9 Terry | 0.54mi | 3/3.5 (-1) | 2,000 (-7%) | 14mo | $700,000 | $350 | 42 |
| 74 Sunrise Ave | 0.69mi | 4/2.0 | 1,871 (-13%) | 13mo | $745,000 | $398 | 33 |
Match score weights: distance 35% · size 25% · config 20% · recency 20%. Top-matched comps best support the ARV.
Projected returns pro-forma
-3.0% appreciation · 3.0% rent growth · sell at horizon
- IRR
- 46.3%
- Equity multiple
- 3.01×
- Total profit
- $464,392
- Equity at exit
- $123,010
- IRR
- 52.1%
- Equity multiple
- 6.09×
- Total profit
- $1,175,160
- Equity at exit
- $71,331
Cash invested: $231,000 (down + closing). Projections, not guarantees.
Landlord ↔ Tenant lean methodology
- Overall (STATE)
- 15 Strongly Tenant-Friendly
- State New York
- 15 Strongly Tenant-Friendly · D+10
- County
- — inherits STATE
- City
- — inherits STATE
ZIP-level market 11901
- Home prices YoY
- -29.5%
- Active inventory
- 192
- Price-to-rent
- 3.6×
Monthly cashflow live
- Estimated rent
- $18,996 medium interval (Pro) →
- Mortgage (P&I)
- −$4,326
- Tax from tax record
- −$950 /mo · $11,396/yr
- Insurance
- −$344
- HOA
- −$0
- Vacancy / Maint / Mgmt
- −$3,989
- Net cashflow
- $9,387
Break-even live
Sensitivity live
| Price | -10% $9,854 | -5% $9,620 | +0% $9,387 | +5% $9,153 | +10% $8,920 |
|---|---|---|---|---|---|
| Rent | -10% $7,886 | -5% $8,636 | +0% $9,387 | +5% $10,137 | +10% $10,887 |
| Rate | -1.0pp $9,802 | -0.5pp $9,596 | base $9,387 | +0.5pp $9,173 | +1.0pp $8,955 |
UW: 25.0% down · 7.5% · 30yr · 1.5% tax · 5.0% vac · 8.0% maint · 8.0% mgmt
Financing live
Cash to close
- Down payment
- $206,250
- Closing costs
- $24,750
- Reserves months
- —
- Total cash needed
- —
Loan-product check · same deal, 3 products live
Conventional
25% down · 7.5% · 30yr
- Down + closing
- —
- Monthly P&I
- —
- Monthly cashflow
- —
- DSCR
- —
- Eligible?
- —
Personal DTI + credit; lowest rate.
DSCR
20% down · 8.5% · 30yr
- Down + closing
- —
- Monthly P&I
- —
- Monthly cashflow
- —
- DSCR
- —
- Eligible?
- —
No personal income docs; deal must DSCR.
Hard money
10% down · 12.0% · 12mo
- Down + closing
- —
- Monthly P&I
- —
- Monthly cashflow
- —
- DSCR
- —
- Eligible?
- —
Short-term bridge; refi at stabilization.
Rent comps 3 comps
| Address | Beds | Baths | Sqft | Rent | $/sqft | DOM | Units | Dist |
|---|---|---|---|---|---|---|---|---|
| 123 Broad Ave Riverhead, NY | 5.0 | 3.0 | 2367 | $20,000 | $8.45 | 20d | 1 | 0.06mi |
| 97 Grant DR Aquebogue, NY | 3.0 | 2.5 | 1900 | $20,000 | $10.53 | 45d | 1 | 0.12mi |
| 807 Union Ave Riverhead, NY | 4.0 | 2.5 | 2552 | $9,000 | $3.53 | 45d | 1 | 0.52mi |
Listing history 4 events
-
2026-04-28status Pending
-
2026-03-29$825,000 Active
-
2021-06-01soldstatus $525,000
-
2003-08-20soldstatus $326,000
ⓘ Source: listings_history table (triggers on properties + properties_extension) + one-shot
backfill from property_details.listing_events for pre-trigger history.
Tax reassessment forecast NY · Partial reset (capped growth)
- Current annual tax
- $11,396 · $950/mo
- Projected year-2 tax
- $12,669 · $1,056/mo
- Expected delta
- +$1,273/yr (+$106/mo · 11.2%)
ⓘ Screening estimate from a state-policy table — verify with the county assessor before closing.
Climate risk First Street
- Flood 6/10 Major FEMA zone X (unshaded) · 70% chance over 30 yrs
- Wildfire 2/10 Low
- Heat 5/10 Major 7 d/yr ≥91°F today · 19 d/yr by 30 yrs out
- Wind 8/10 Severe 80% chance of damaging wind over 30 yrs
- Air quality 3/10 Moderate 2 unhealthy d/yr today · 3 by 30 yrs out
Nearby sold comps map
Loading sold comps map…
Walkable amenities ~0.75 mi
Loading nearby amenities…
Taxation est. · year 1
- Rental income
- $227,946
- − Mortgage interest
- −$46,213
- − Property taxes
- −$11,396
- − Insurance
- −$4,125
- − Repairs & maintenance
- −$18,236
- − Management
- −$18,236
- − Depreciation
- −$24,000
- Taxable income
- $105,741
- Est. tax owed @ 24.0%
- −$25,378
- After-tax cash flow
- $87,262/yr
For passive investors: Depreciation is non-cash, so a rental often shows a tax loss while cash-flowing — sheltering income. Rental losses are passive: they offset passive income freely, and up to $25,000/yr can offset ordinary (W-2) income if you actively participate and your MAGI is under $100k (phasing out to $0 by $150k); unused losses carry forward. On sale, claimed depreciation is recaptured at up to 25%, and gains may owe capital-gains tax (a 1031 exchange can defer both). Figures are a year-1 estimate at your 24.0% rate — not tax advice; consult a CPA.
Schools (NCES district)
- District
- Riverhead Central School District
- NCES district ID
- 3624690
- Math proficiency
- 34% ▼ -4.00%
- Reading proficiency
- 48% ▲ 13.00%
- Median HH income
- $61,607
- Composite
- 36.38/100
- National rank
- #4683
- State rank
- #489 of 590 in NY
Livability — Aquebogue
- Score
- 62/100
- State rank
- #887
- US rank
- #17213
Category grades
Schools grade is shown separately in the Schools card above.
Census & demographics
- Census place
- Aquebogue, NY
- City population
- 24
- Population (ZIP)
- 32,921
Population outlook (Suffolk County) Hauer SSP2
- Today (2025)
- 1,505,262 people
- By 2030
- 1,498,318 · -0.5%
- By 2040
- 1,471,101 · -2.3%
- By 2050
- 1,424,848 · -5.3%
- By 2075
- 1,337,157 · -11.2%
- By 2100
- 1,217,720 · -19.1%
Race, ethnicity, and origin ACS 2023
- Neighborhood character
- Diverse neighborhood (Simpson 0.63)
- Race & ethnicity
- White 52% Hispanic / Latino 29% Two or more races 14% Black 11% Asian 3%
- Hispanic origin (detail)
- Mexican 4%
- Common ancestry
- Romanian 8% Iranian 1% Portuguese 1%
- Foreign-born
- 25% · Canada, Jamaica
- Languages at home
- 68% English-only · Spanish 26% Other Indo-European 3% Russian/Polish/Slavic 2%
Political lean MEDSL · Suffolk
- 2024 margin
- Lean R (+10.0) · D 45.0% · R 55.0%
- 2008→2024 swing
- -16.0pp toward R · 2008: 6.0pp · 2024: -10.0pp
- All cycles
- 2024: R+10.0 2020: R+0.0 2016: R+8.2 2012: D+2.9 2008: D+6.0
Not yet ingested
- Civics
- —
Market trends
- HPI YoY
- ▼ -182.60%
- Current HPI
- 436.7781
- Rent YoY
- —
- Metro
- —
- State GDP YoY
- ▲ 2.60%
- F500 in state
- 92
Industry mix (Fortune 500 HQ in NY)
| Industry | F500 HQs | Revenue |
|---|---|---|
| Financial Services | 10 | $950B |
|
||
| Consumer Goods | 9 | $162B |
|
||
| Insurance | 4 | $225B |
|
||
| Telecommunications | 2 | $144B |
|
||
| Pharmaceuticals | 2 | $112B |
|
||
| Media / Entertainment | 2 | $69B |
|
||
Price history
+153.1% since first listed4 events — show timeline
- 2026-04-28 Pending — OneKey® MLS as Distributed by MLS Grid
- 2026-03-29 Listed $825,000 OneKey® MLS as Distributed by MLS Grid
- 2021-06-01 Sold (Public Records) $525,000 Public Records
- 2003-08-20 Sold (Public Records) $326,000 Public Records
Property tax history
+1.6%/yrLatest (2025): $11,396 · +0.0% YoY. Source: county tax records.
Cash-flow waterfall
monthlySold comps — $/sqft
last 12 mo · ≤1 miLoading sold comps…