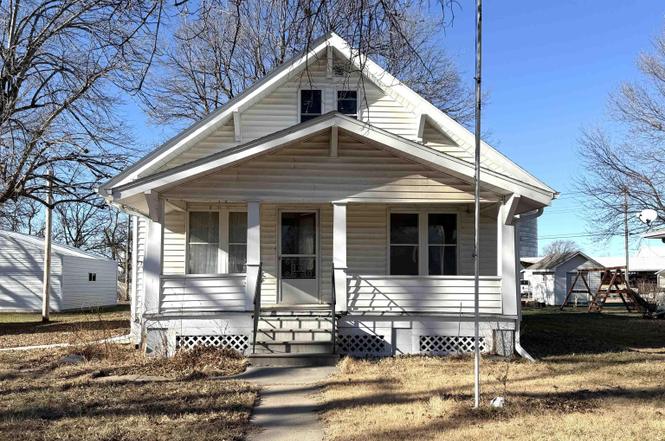
233 S Fillmore St · Bruning, NE
Flood risk 1/10 · Minimal
- FEMA flood zone
- X (unshaded)
- Chance of flooding over 30 yrs
- 0.0%
- Est. flood insurance / yr
- $473 – $860
Fire risk 1/10 · Minimal
- Est. fire insurance / yr
- $1,161 – $2,155
Heat risk 3/10 · Minor
- Hot days now (above 104°F)
- 7 days/yr
- Hot days in 30 yrs
- 16 days/yr
Wind risk 2/10 · Minimal
- Chance of severe wind over 30 yrs
- —
Air-quality risk 1/10 · Minimal
- Unhealthy air days now
- 0 days/yr
- Unhealthy air days in 30 yrs
- 0 days/yr
Risk factors via First Street. Map © Google.
Why this score? — see what drove the B+ grade
The composite is a weighted blend of 9 inputs, each scored 0–100. Each bar is that input's sub-score; the figure is the points it added to the 100-point composite (weight × sub-score).
- Cash flow +30.0/30.0
- DSCR +10.0/10.0
- 1% rule +9.7/10.0
- ARV discount +7.5/15.0
- Schools +5.2/10.0
- Appreciation +5.1/10.0
- Livability +3.4/5.0
- Rent growth +2.5/5.0
- Condition / age +2.5/5.0
$75,000
🖨 Deal sheet (PDF) 📄 Offer letter ✓ Due diligence
Listing remarks
Step into this charming 1920s home full of character, featuring beautiful original woodwork and an original front door that sets the tone from the moment you arrive. The spacious living room showcases stunning craftsmanship and timeless details. The first bedroom offers hardwood floors and closet space, with easy access to the bathroom and second main-level bedroom. The kitchen includes a cozy breakfast nook where you can enjoy your morning coffee while watching the squirrels play in the backyard. Upstairs, you’ll find an additional bedroom space with endless potential—perfect for a home office, guest room, or creative retreat. Outside, a large 26 x 26 detached garage provides p
Key facts
- Breakfast nook
- Alley access
- Original front door
Tags
Property features AI
Exterior
- Parking: Detached garage; Two covered parking spaces (2 total)
- Utilities: Public water; Public sewer
- Home design: Single-family residence; One-and-a-half story; Built in 1920; Not new / not a model
- Construction: Vinyl siding; Block foundation
- Exterior features: Front porch; Lot approximately 0.2 acre (about 60 x 140); Lot up to 1/4 acre
Interior
- Kitchen: Range; Refrigerator
- Bedrooms: Primary bedroom on the main floor; Second bedroom on the main floor; Third bedroom on the second floor
- Flooring: Carpet; Wood
- Bathrooms: One full bathroom (main level)
- Heating & cooling: Natural gas forced-air heating; Central air; Window AC units
- Interior features: Unfinished basement; No fireplaces
Neighborhood map
What this means for you Summary
Snapshot
- This is a 3-bed/1.0-bath single-family listed at $75k.
Deal economics
- At list price, monthly cash flow is $395 ($5k/yr) — positive.
- The deal already cash-flows at list — no discount required.
- Meets the 1% rule at list price ($1k rent vs $75k).
- Recommended offer: $66k (12.0% below list) — sets the bar for market timing.
Location & tenants
- Location reads 68/100 on livability (#258 in NE) — a middle-class / working-renter tenant base. Strengths: cost of living A+, housing A+; Watch: health & safety C-, amenities F, commute F.
- Bruning-Davenport Unified System (rural): math 70% / reading 50% proficiency, ranked #65 of 245 in NE (top 26%) — acceptable for families but not a draw, mixed tenant base, ~2y average lease.
- Zoned schools: Bruning-Davenport Elem/Bruning (43 students, 33% FRL); Bruning-Davenport Middle Sch (math 54% / reading 54%, grade B-, #32 of 128 statewide, top 28%, 49 students, 37% FRL); Bruning-Davenport High School (51 students, 35% FRL).
- Market conditions: 6 active listings in the ZIP; 3 units permitted in Thayer County in 2024 (0 in 5+ unit buildings).
Forward outlook
- In year one you build about $612 of equity ($519 loan paydown + $93 appreciation (0.1% local appreciation)).
- Thayer County population projected at +6% by 2050 — modest demand growth; plan on rents tracking national, not racing it.
- At projected returns (0.1% appreciation + 3.0% rent growth), your $21k cash investment doubles in ~4 years — after that, you're playing with house money.
Negotiation context
- It's been on market 163 days — a 12% lower offer ($66k) is reasonable based on typical stale-listing flexibility.
Risks & watch-outs
- Watch-outs: built in 1920 — expect roof / HVAC / electrical / plumbing capex.
Questions for the listing agent
- It's been on market 163 days. Have you received any prior offers? Is the seller open to a 12% concession, seller financing, or rate buy-down credit?
- Built in 1920 — when were the roof, HVAC, electrical panel, plumbing, and water heater last replaced?
- Why hasn't it sold? Are there any deal-killer items the seller is aware of (foundation, flood, title, zoning, code violations)?
- Is there a deadline driving the sale (1031 exchange, divorce, estate, relocation)? That informs how much negotiation room exists.
- Schools are B-rated — typically a magnet for longer-tenancy family renters. What's the average tenant stay here, and is there a school-zone premium baked into asking?
- What's the average days-on-market for RENTAL listings here right now (not sales)? A rising rental-DOM trend means longer vacancies and softer asking-rent achievability than the comps imply.
- What's the recent tenant-quality profile in this submarket — average credit score on applications, eviction rate, late-payment / NSF rate, and stable-employment percentage? A property-management company in the area should have these aggregated.
- How much new for-sale + rental construction is in the pipeline within 1–3 miles? Heavy new supply typically softens prices + rents 12–24 months out; constrained supply supports both.
Investment metrics
- 1% rule
- 1.47% ✓
- Cap rate
- 12.62%
- Cash-on-cash
- 22.60%
- DSCR
- 2.01
- GRM
- 5.7
CMA / ARV
No comps found within radius.
Projected returns pro-forma
0.12% appreciation · 3.0% rent growth · sell at horizon
- IRR
- 22.9%
- Equity multiple
- 2.12×
- Total profit
- $23,419
- Equity at exit
- $22,242
- IRR
- 26.8%
- Equity multiple
- 4.01×
- Total profit
- $63,120
- Equity at exit
- $27,108
Cash invested: $21,000 (down + closing). Projections, not guarantees.
Landlord ↔ Tenant lean methodology
- Overall (STATE)
- 83 Strongly Landlord-Friendly
- State Nebraska
- 83 Strongly Landlord-Friendly · R+13
- County
- — inherits STATE
- City
- — inherits STATE
ZIP-level market 68322
- Home prices YoY
- 0.1%
- Active inventory
- 6
- Price-to-rent
- 5.7×
Monthly cashflow live
- Estimated rent
- $1,102 medium interval (Pro) →
- Mortgage (P&I)
- −$393
- Tax from tax record
- −$50 /mo · $605/yr
- Insurance
- −$31
- HOA
- −$0
- Vacancy / Maint / Mgmt
- −$231
- Net cashflow
- $395
Break-even live
Sensitivity live
| Price | -10% $438 | -5% $417 | +0% $395 | +5% $374 | +10% $353 |
|---|---|---|---|---|---|
| Rent | -10% $308 | -5% $352 | +0% $395 | +5% $439 | +10% $483 |
| Rate | -1.0pp $433 | -0.5pp $415 | base $395 | +0.5pp $376 | +1.0pp $356 |
UW: 25.0% down · 7.5% · 30yr · 1.5% tax · 5.0% vac · 8.0% maint · 8.0% mgmt
Financing live
Cash to close
- Down payment
- $18,750
- Closing costs
- $2,250
- Reserves months
- —
- Total cash needed
- —
Loan-product check · same deal, 3 products live
Conventional
25% down · 7.5% · 30yr
- Down + closing
- —
- Monthly P&I
- —
- Monthly cashflow
- —
- DSCR
- —
- Eligible?
- —
Personal DTI + credit; lowest rate.
DSCR
20% down · 8.5% · 30yr
- Down + closing
- —
- Monthly P&I
- —
- Monthly cashflow
- —
- DSCR
- —
- Eligible?
- —
No personal income docs; deal must DSCR.
Hard money
10% down · 12.0% · 12mo
- Down + closing
- —
- Monthly P&I
- —
- Monthly cashflow
- —
- DSCR
- —
- Eligible?
- —
Short-term bridge; refi at stabilization.
Listing history 17 events
-
2026-06-21days on market $75,000 Active 163 DOM
-
2026-06-18days on market $75,000 Active 161 DOM
-
2026-06-17days on market $75,000 Active 160 DOM
-
2026-06-16days on market $75,000 Active 159 DOM
-
2026-06-15days on market $75,000 Active 158 DOM
-
2026-06-13days on market $75,000 Active 156 DOM
-
2026-06-12days on market $75,000 Active 155 DOM
-
2026-06-09days on market $75,000 Active 152 DOM
-
2026-06-08days on market $75,000 Active 151 DOM
-
2026-06-07days on market $75,000 Active 150 DOM
-
2026-06-05days on market $75,000 Active 148 DOM
-
2026-06-04days on market $75,000 Active 146 DOM
-
2026-06-02days on market $75,000 Active 145 DOM
-
2026-06-01days on market $75,000 Active 144 DOM
-
2026-05-31days on market $75,000 Active 143 DOM
-
2026-03-07price $75,000
-
2026-01-06$90,000 New
ⓘ Source: listings_history table (triggers on properties + properties_extension) + one-shot
backfill from property_details.listing_events for pre-trigger history.
Tax reassessment forecast NE · Resets to sale price
- Current annual tax
- $605 · $50/mo
- Projected year-2 tax
- $1,298 · $108/mo
- Expected delta
- +$693/yr (+$58/mo · 114.5%)
ⓘ Screening estimate from a state-policy table — verify with the county assessor before closing.
Climate risk First Street
- Flood 1/10 Low FEMA zone X (unshaded) · 0% chance over 30 yrs
- Wildfire 1/10 Low
- Heat 3/10 Moderate 7 d/yr ≥104°F today · 16 d/yr by 30 yrs out
- Wind 2/10 Low
- Air quality 1/10 Low 0 unhealthy d/yr today · 0 by 30 yrs out
Nearby sold comps map
Loading sold comps map…
Walkable amenities ~0.75 mi
Loading nearby amenities…
Taxation est. · year 1
- Rental income
- $13,222
- − Mortgage interest
- −$4,201
- − Property taxes
- −$605
- − Insurance
- −$375
- − Repairs & maintenance
- −$1,058
- − Management
- −$1,058
- − Depreciation
- −$2,182
- Taxable income
- $3,743
- Est. tax owed @ 24.0%
- −$898
- After-tax cash flow
- $3,847/yr
For passive investors: Depreciation is non-cash, so a rental often shows a tax loss while cash-flowing — sheltering income. Rental losses are passive: they offset passive income freely, and up to $25,000/yr can offset ordinary (W-2) income if you actively participate and your MAGI is under $100k (phasing out to $0 by $150k); unused losses carry forward. On sale, claimed depreciation is recaptured at up to 25%, and gains may owe capital-gains tax (a 1031 exchange can defer both). Figures are a year-1 estimate at your 24.0% rate — not tax advice; consult a CPA.
Schools (NCES district)
- District
- Bruning-Davenport Unified System
- NCES district ID
- 3100124
- Math proficiency
- 70% ▲ 10.00%
- Reading proficiency
- 50% ▬ 0.00%
- Median HH income
- $46,647
- Composite
- 52.41/100
- National rank
- #3418
- State rank
- #65 of 245 in NE
Livability — Bruning
- Score
- 68/100
- State rank
- #258
- US rank
- #9269
Category grades
Schools grade is shown separately in the Schools card above.
Census & demographics
- Census place
- Bruning, NE
- Population (ZIP)
- 520
Population outlook (Thayer County) Hauer SSP2
- Today (2025)
- 4,947 people
- By 2030
- 4,983 · +0.7%
- By 2040
- 5,052 · +2.1%
- By 2050
- 5,224 · +5.6%
- By 2075
- 6,247 · +26.3%
- By 2100
- 6,520 · +31.8%
Race, ethnicity, and origin ACS 2023
- Neighborhood character
- Predominantly White (89%)
- Race & ethnicity
- White 89% Two or more races 7% Hispanic / Latino 5% Native American 1%
- Common ancestry
- Slovak 2% Italian 1% Iranian 1%
- Foreign-born
- 1% · Canada
- Languages at home
- 98% English-only · Spanish 1% German/W. Germanic 1%
Political lean MEDSL · Thayer
- 2024 margin
- Solid R (+60.8) · D 19.1% · R 79.9% · Other 1.1%
- 2008→2024 swing
- -27.4pp toward R · 2008: -33.4pp · 2024: -60.8pp
- All cycles
- 2024: R+60.8 2020: R+56.3 2016: R+57.5 2012: R+43.0 2008: R+33.4
Not yet ingested
- Civics
- —
Market trends
- HPI YoY
- ▲ 0.12%
- Current HPI
- 220.4337
- Rent YoY
- —
- Metro
- —
- State GDP YoY
- ▲ 0.68%
- F500 in state
- 2
Industry mix (Fortune 500 HQ in NE)
| Industry | F500 HQs | Revenue |
|---|---|---|
| Conglomerate | 1 | $371B |
|
||
Price history
-16.7% since first listed2 events — show timeline
- 2026-03-07 Price Changed $75,000 GPRMLS
- 2026-01-06 Listed $90,000 GPRMLS
Property tax history
+1.1%/yrLatest (2025): $605 · +15.1% YoY. Source: county tax records.
Cash-flow waterfall
monthlySold comps — $/sqft
last 12 mo · ≤1 miLoading sold comps…