 🏷️ Likely Rental
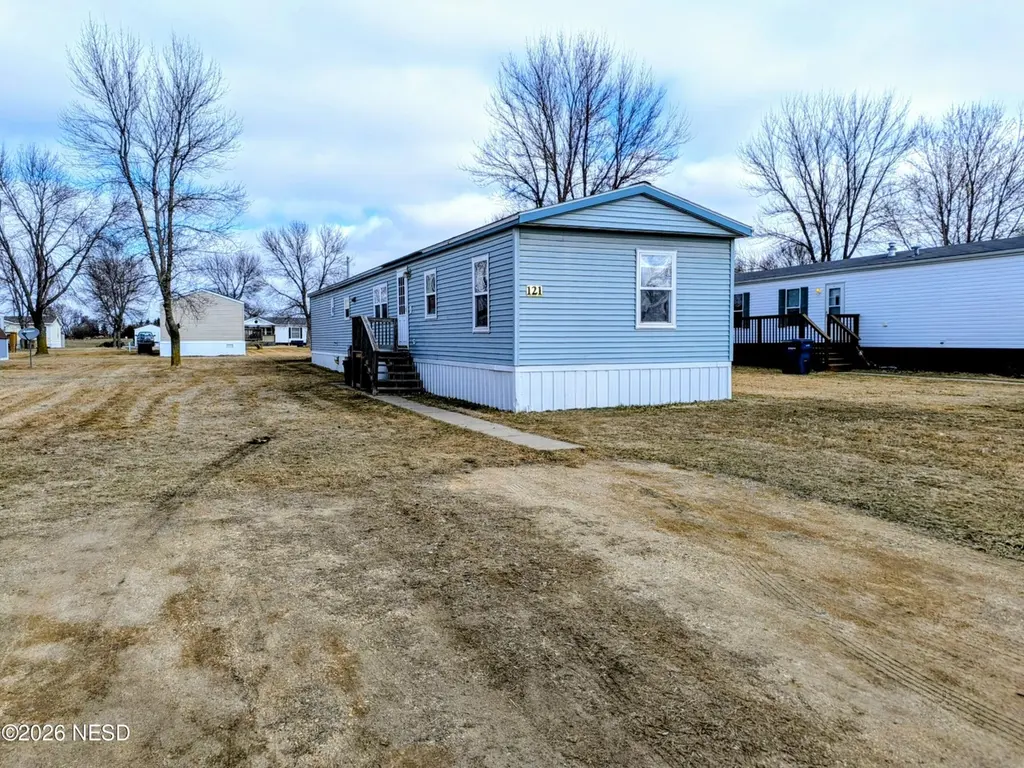
121 18th Ave SW · Watertown, SD
Flood risk No data
- FEMA flood zone
- —
- Chance of flooding over 30 yrs
- —
- Est. flood insurance / yr
- —
Fire risk No data
- Est. fire insurance / yr
- —
Heat risk 1/10 · Minimal
- Hot days now (above threshold)
- 7 days/yr
- Hot days in 30 yrs
- 13 days/yr
Wind risk No data
- Chance of severe wind over 30 yrs
- —
Air-quality risk 2/10 · Minimal
- Unhealthy air days now
- 1 days/yr
- Unhealthy air days in 30 yrs
- 1 days/yr
Risk factors via First Street. Map © Google.
Why this score? — see what drove the B+ grade
The composite is a weighted blend of 9 inputs, each scored 0–100. Each bar is that input's sub-score; the figure is the points it added to the 100-point composite (weight × sub-score).
- Cash flow +30.0/30.0
- ARV discount +15.0/15.0
- 1% rule +10.0/10.0
- DSCR +10.0/10.0
- Schools +4.3/10.0
- Livability +3.9/5.0
- Rent growth +2.5/5.0
- Condition / age +2.5/5.0
- Appreciation +0.0/10.0
$45,000
🖨 Deal sheet (PDF) 📄 Offer letter ✓ Due diligence
Listing remarks MLS
A wonderful opportunity to live in a highly desired area! This move-in-ready 3-bedroom, 2-bath home has been thoughtfully maintained and features recent updates to the water heater, central air, and furnace, offering comfort and peace of mind from day one. The property includes a 12×12 shed for extra storage and a spacious area ideal for adding a garage, giving you room to expand as you wish. Lot rent is $395/month, and purchase is subject to buyer approval by the mobile home park.
Key facts
- Built 1983
- Listed 52 days
Neighborhood map
What this means for you Summary
Snapshot
- This is a 3-bed/1.0-bath single-family listed at $45k.
Deal economics
- At list price, monthly cash flow is $320 ($4k/yr) — positive.
- The deal already cash-flows at list — no discount required.
- Meets the 1% rule at list price ($1k rent vs $45k).
- Recommended offer: $44k (3.0% below list) — sets the bar for market timing.
- Cap rate 14.8% vs local median 2.3% in Watertown — top-decile yield for the area; either an underpriced asset or a hidden risk that comps aren't pricing in. Stress-test before assuming the spread holds.
Location & tenants
- Location reads 78/100 on livability (#11 in SD, #2,681 nationally) — a middle-class / working-renter tenant base. Strengths: cost of living A+, housing A+, health & safety A+; Watch: commute F.
- Watertown School District 14-4 (town): math 45% / reading 57% proficiency, ranked #28 of 59 in SD (top 48%) — acceptable for families but not a draw, mixed tenant base, ~2y average lease.
- Zoned schools: Watertown Middle School - 02 (math 42% / reading 63%, grade C+, #45 of 143 statewide, top 31%, 600 students, 26% FRL); Watertown High School - 01 (math 42% / reading 67%, grade C-, #53 of 151 statewide, top 41%, 1,220 students, 22% FRL) — zoned schools at 24% FRL track the district average.
- Market conditions: 228 active listings in the ZIP; 2 comparable units currently listed for rent nearby; 160 units permitted in Codington County in 2024 (63 in 5+ unit buildings).
Forward outlook
- Local home prices are declining (-3.0%/yr); year-one equity from $311 of loan paydown is wiped out by about $1k of value loss. Plan a longer hold.
- Codington County population projected at +14% by 2050 — modest demand growth; plan on rents tracking national, not racing it.
- At projected returns (-3.0% appreciation + 3.0% rent growth), your $13k cash investment doubles in ~4 years — after that, you're playing with house money.
Negotiation context
- It's been on market 52 days — a 3% lower offer ($44k) is reasonable based on typical stale-listing flexibility.
Risks & watch-outs
- Watch-outs: HOA is 30% of rent.
Questions for the listing agent
- It's been on market 52 days. Have you received any prior offers? Is the seller open to a 3% concession, seller financing, or rate buy-down credit?
- What does the HOA fee cover, when was the last increase, and are there any pending special assessments or reserve-fund shortfalls?
- Is there a deadline driving the sale (1031 exchange, divorce, estate, relocation)? That informs how much negotiation room exists.
- Schools are B-rated — typically a magnet for longer-tenancy family renters. What's the average tenant stay here, and is there a school-zone premium baked into asking?
- What's the average days-on-market for RENTAL listings here right now (not sales)? A rising rental-DOM trend means longer vacancies and softer asking-rent achievability than the comps imply.
- What's the recent tenant-quality profile in this submarket — average credit score on applications, eviction rate, late-payment / NSF rate, and stable-employment percentage? A property-management company in the area should have these aggregated.
- How much new for-sale + rental construction is in the pipeline within 1–3 miles? Heavy new supply typically softens prices + rents 12–24 months out; constrained supply supports both.
Investment metrics
- 1% rule
- 2.89% ✓
- Cap rate
- 14.83%
- Cash-on-cash
- 30.48%
- DSCR
- 2.36
- GRM
- 2.9
CMA / ARV
- ARV (median comp)
- $65,817
- List price
- $45,000
- Delta
- -31.63%
- Verdict
- UNDERPRICED
- Comps
- 12 within 1.0 mi
Show comp detail 7 sales within ~0.75 mi
| Address | Dist | Beds/Ba | Sqft | Sold | Price | $/sf | Match |
|---|---|---|---|---|---|---|---|
| 121 18th Ave SW | 0.00mi | 3/1.0 | 1,216 (0%) | 1mo | $40,000 | $33 | 99 |
| 106 17th Ave SW | 0.04mi | 3/2.0 | 1,216 (0%) | 5mo | $38,000 | $31 | 90 |
| 143 19th Ave SW | 0.06mi | 3/2.0 | 1,232 (+1%) | 3mo | $61,500 | $50 | 88 |
| 163 19th Ave SW | 0.07mi | 3/2.0 | 1,232 (+1%) | 7mo | $95,000 | $77 | 85 |
| 12 17th Ave SW | 0.07mi | 3/2.0 | 1,140 (-6%) | 0mo | $100,000 | $88 | 82 |
| 142 18th Ave SW | 0.04mi | 3/2.0 | 1,320 (+9%) | 5mo | $135,000 | $102 | 76 |
| 17 17th Ave SW | 0.07mi | 3/2.0 | 1,040 (-14%) | 13mo | $92,000 | $88 | 58 |
Match score weights: distance 35% · size 25% · config 20% · recency 20%. Top-matched comps best support the ARV.
Projected returns pro-forma
-3.0% appreciation · 3.0% rent growth · sell at horizon
- IRR
- 25.5%
- Equity multiple
- 2.06×
- Total profit
- $13,357
- Equity at exit
- $6,710
- IRR
- 33.4%
- Equity multiple
- 4.09×
- Total profit
- $38,947
- Equity at exit
- $3,891
Cash invested: $12,600 (down + closing). Projections, not guarantees.
Landlord ↔ Tenant lean methodology
- Overall (STATE)
- 83 Strongly Landlord-Friendly
- State South Dakota
- 83 Strongly Landlord-Friendly · R+16
- County
- — inherits STATE
- City
- — inherits STATE
ZIP-level market 57201
- Active inventory
- 228
- Price-to-rent
- 2.9×
Monthly cashflow live
- Estimated rent
- $1,299 medium interval (Pro) →
- Mortgage (P&I)
- −$236
- Tax est. 1.5%
- −$56 /mo · $675/yr
- Insurance
- −$19
- HOA
- −$395
- Lot rent
- −$0
- Vacancy / Maint / Mgmt
- −$273
- Net cashflow
- $320
Break-even live
Sensitivity live
| Price | -10% $351 | -5% $336 | +0% $320 | +5% $305 | +10% $289 |
|---|---|---|---|---|---|
| Rent | -10% $217 | -5% $269 | +0% $320 | +5% $371 | +10% $423 |
| Rate | -1.0pp $343 | -0.5pp $332 | base $320 | +0.5pp $308 | +1.0pp $297 |
UW: 25.0% down · 7.5% · 30yr · 1.5% tax · 5.0% vac · 8.0% maint · 8.0% mgmt
Financing live
Cash to close
- Down payment
- $11,250
- Closing costs
- $1,350
- Reserves months
- —
- Total cash needed
- —
Loan-product check · same deal, 3 products live
Conventional
25% down · 7.5% · 30yr
- Down + closing
- —
- Monthly P&I
- —
- Monthly cashflow
- —
- DSCR
- —
- Eligible?
- —
Personal DTI + credit; lowest rate.
DSCR
20% down · 8.5% · 30yr
- Down + closing
- —
- Monthly P&I
- —
- Monthly cashflow
- —
- DSCR
- —
- Eligible?
- —
No personal income docs; deal must DSCR.
Hard money
10% down · 12.0% · 12mo
- Down + closing
- —
- Monthly P&I
- —
- Monthly cashflow
- —
- DSCR
- —
- Eligible?
- —
Short-term bridge; refi at stabilization.
Rent comps 2 comps
| Address | Beds | Baths | Sqft | Rent | $/sqft | DOM | Units | Dist |
|---|---|---|---|---|---|---|---|---|
| 2330 Challenger Way Watertown, SD | 1.0–3.0 | 1.0–2.0 | 1143 | $1,355 | $1.19 | 46d | 1 | 0.43mi |
| 22 8th Ave SW Watertown, SD | 2.0 | 1.0 | 830 | $1,200 | $1.45 | 46d | 1 | 0.98mi |
HOA detail
- Monthly dues
- $395 · $4,740/yr
- Likely covers
- water
Listing history 2 events
-
2026-05-18status Pending 492-char remark
Show marketing remark (492 chars)
A wonderful opportunity to live in a highly desired area! This move-in-ready 3-bedroom, 2-bath home has been thoughtfully maintained and features recent updates to the water heater, central air, and furnace, offering comfort and peace of mind from day one. The property includes a 12×12 shed for extra storage and a spacious area ideal for adding a garage, giving you room to expand as you wish. Lot rent is $395/month, and purchase is subject to buyer approval by the mobile home park.
-
2026-03-27$45,000 Active 492-char remark
Show marketing remark (492 chars)
A wonderful opportunity to live in a highly desired area! This move-in-ready 3-bedroom, 2-bath home has been thoughtfully maintained and features recent updates to the water heater, central air, and furnace, offering comfort and peace of mind from day one. The property includes a 12×12 shed for extra storage and a spacious area ideal for adding a garage, giving you room to expand as you wish. Lot rent is $395/month, and purchase is subject to buyer approval by the mobile home park.
ⓘ Source: listings_history table (triggers on properties + properties_extension) + one-shot
backfill from property_details.listing_events for pre-trigger history.
Climate risk First Street
- Heat 1/10 Low
- Air quality 2/10 Low 1 unhealthy d/yr today · 1 by 30 yrs out
Nearby sold comps map
Loading sold comps map…
Walkable amenities ~0.75 mi
Loading nearby amenities…
Taxation est. · year 1
- Rental income
- $15,586
- − Mortgage interest
- −$2,521
- − Property taxes
- −$675
- − Insurance
- −$225
- − Repairs & maintenance
- −$1,247
- − Management
- −$1,247
- − HOA
- −$4,740
- − Depreciation
- −$1,309
- Taxable income
- $3,622
- Est. tax owed @ 24.0%
- −$869
- After-tax cash flow
- $2,972/yr
For passive investors: Depreciation is non-cash, so a rental often shows a tax loss while cash-flowing — sheltering income. Rental losses are passive: they offset passive income freely, and up to $25,000/yr can offset ordinary (W-2) income if you actively participate and your MAGI is under $100k (phasing out to $0 by $150k); unused losses carry forward. On sale, claimed depreciation is recaptured at up to 25%, and gains may owe capital-gains tax (a 1031 exchange can defer both). Figures are a year-1 estimate at your 24.0% rate — not tax advice; consult a CPA.
Schools (NCES district)
- District
- Watertown School District 14-4
- NCES district ID
- 4676620
- Math proficiency
- 45% ▼ -10.00%
- Reading proficiency
- 57% ▼ -7.00%
- Median HH income
- $46,575
- Composite
- 43.24/100
- National rank
- #3057
- State rank
- #28 of 59 in SD
Livability — Watertown
- Score
- 78/100
- State rank
- #11
- US rank
- #2681
Category grades
Schools grade is shown separately in the Schools card above.
Census & demographics
- Census place
- Watertown, SD
- County
- Codington County · 26,781 people
- City population
- 26,781
- Metro
- Watertown, SD
- Population (ZIP)
- 26,781
- Household income
- $72,878
- Rent vs Own
- Severe rent burden
- 613.0
Population outlook (Codington County) Hauer SSP2
- Today (2025)
- 29,752 people
- By 2030
- 30,627 · +2.9%
- By 2040
- 32,285 · +8.5%
- By 2050
- 33,812 · +13.6%
- By 2075
- 39,184 · +31.7%
- By 2100
- 46,673 · +56.9%
Race, ethnicity, and origin ACS 2023
- Neighborhood character
- Predominantly White (91%)
- Race & ethnicity
- White 91% Two or more races 5% Hispanic / Latino 3% Native American 2%
- Common ancestry
- Portuguese 15% Romanian 3% Iranian 3%
- Foreign-born
- 1% · Canada
- Languages at home
- 97% English-only · Spanish 2% German/W. Germanic 1%
Political lean MEDSL · Codington
- 2024 margin
- Solid R (+40.8) · D 28.4% · R 69.2% · Other 2.4%
- 2008→2024 swing
- -34.4pp toward R · 2008: -6.4pp · 2024: -40.8pp
- All cycles
- 2024: R+40.8 2020: R+38.9 2016: R+39.3 2012: R+18.3 2008: R+6.4
Not yet ingested
- Civics
- —
Market trends
- HPI YoY
- ▼ -161.04%
- Current HPI
- 165.8449
- Rent YoY
- —
- Metro
- Watertown, SD
- State GDP YoY
- ▲ 0.70%
- F500 in state
- 2
Industry mix (Fortune 500 HQ in SD)
| Industry | F500 HQs | Revenue |
|---|---|---|
| Utilities | 1 | $1B |
|
||
Price history
2 events — show timeline
- 2026-05-18 Pending — NESD
- 2026-03-27 Listed $45,000 NESD
Property tax history
-1.7%/yrLatest (2025): $86 · +1.1% YoY. Source: county tax records.
Cash-flow waterfall
monthlySold comps — $/sqft
last 12 mo · ≤1 miLoading sold comps…