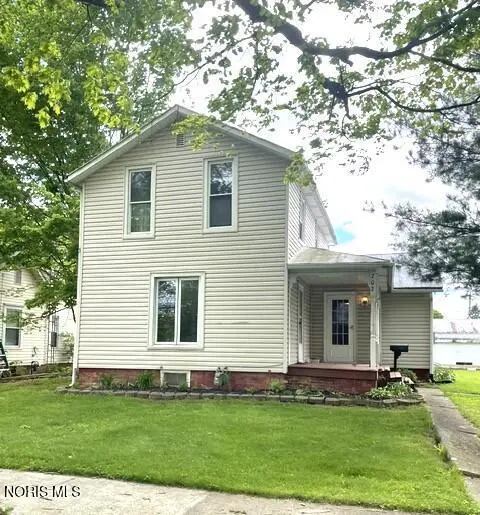
702 S 7th St · Upper Sandusky, OH
Flood risk 1/10 · Minimal
- FEMA flood zone
- —
- Chance of flooding over 30 yrs
- 0.0%
- Est. flood insurance / yr
- —
Fire risk 1/10 · Minimal
- Est. fire insurance / yr
- $713 – $1,323
Heat risk 3/10 · Minor
- Hot days now (above 99°F)
- 7 days/yr
- Hot days in 30 yrs
- 17 days/yr
Wind risk 2/10 · Minimal
- Chance of severe wind over 30 yrs
- —
Air-quality risk 2/10 · Minimal
- Unhealthy air days now
- 1 days/yr
- Unhealthy air days in 30 yrs
- 1 days/yr
Risk factors via First Street. Map © Google.
Why this score? — see what drove the B- grade
The composite is a weighted blend of 9 inputs, each scored 0–100. Each bar is that input's sub-score; the figure is the points it added to the 100-point composite (weight × sub-score).
- Cash flow +24.4/30.0
- DSCR +7.9/10.0
- ARV discount +7.5/15.0
- Appreciation +6.4/10.0
- 1% rule +6.3/10.0
- Schools +5.2/10.0
- Livability +3.8/5.0
- Rent growth +2.5/5.0
- Condition / age +2.5/5.0
$89,000
🖨 Deal sheet (PDF) 📄 Offer letter ✓ Due diligence
Listing remarks
This 3-bedroom home sits on a large lot with a detached garage, and it just needs your TLC! Priced to sell!
Key facts
- 9,148 sq ft lot
- 2 garage spots
- Built 1900
Property features AI
Exterior
- Parking: Off-street parking; 2-car garage
- Utilities: Electricity connected; Natural gas connected; Public sewer; Public water
- Home design: Single-family residence; Two levels (2 stories); Not attached to other structures; No shared/common walls; Living area approximately 1,456
- Construction: Vinyl siding; Other foundation details
- Exterior features: Metal roof
Interior
- Kitchen: Main-level kitchen
- Bedrooms: Bedroom 2 (Upper); Bedroom 3 (Upper)
- Flooring: Other flooring
- Bathrooms: 1 full bathroom; 1 half bathroom (1.5 total)
- Heating & cooling: Natural gas heating
- Interior features: 7 total rooms; Basement; Other interior features
- Laundry & utility: Laundry in basement
Neighborhood map
What this means for you Summary
Snapshot
- This is a 3-bed/2.0-bath single-family listed at $89k.
Deal economics
- At list price, monthly cash flow is $180 ($2k/yr) — positive.
- The deal already cash-flows at list — no discount required.
- Meets the 1% rule at list price ($1k rent vs $89k).
- Recommended offer: $86k (3.0% below list) — sets the bar for market timing.
- Cap rate 8.7% vs local median 3.6% in Upper Sandusky — top-decile yield for the area; either an underpriced asset or a hidden risk that comps aren't pricing in. Stress-test before assuming the spread holds.
Location & tenants
- Location reads 75/100 on livability (#248 in OH, #3,965 nationally) — a middle-class / working-renter tenant base. Strengths: cost of living A+, housing A+, health & safety A+; Watch: employment D+, amenities F, commute F.
- Upper Sandusky Exempted Village (town): math 60% / reading 64% proficiency, ranked #268 of 656 in OH (top 41%) — acceptable for families but not a draw, mixed tenant base, ~2y average lease.
- Zoned schools: South Elementary School (math 62% / reading 47%, grade C, #788 of 1,584 statewide, top 52%, 130 students, 40% FRL); Upper Sandusky Middle School (math 63% / reading 66%, grade A-, #205 of 654 statewide, top 34%, 526 students, 37% FRL); Upper Sandusky High School (math 42% / reading 62%, grade D+, #343 of 781 statewide, top 47%, 540 students, 23% FRL) — zoned schools at 33% FRL track the district average.
- Market conditions: 40 active listings in the ZIP; 20 units permitted in Wyandot County in 2024 (0 in 5+ unit buildings).
- This rent is only 17% of the median local income ($72k/yr) — well below the 30% rent-burden line; pricing power to push rent on renewal without tenant pushback.
Forward outlook
- In year one you build about $3k of equity ($615 loan paydown + $3k appreciation (2.9% local appreciation)).
- Wyandot County population projected at -17% by 2050 — secular population decline; favor cash flow + early exit over multi-decade hold.
- At projected returns (2.9% appreciation + 3.0% rent growth), your $25k cash investment doubles in ~5 years — after that, you're playing with house money.
- By year 10, paydown + projected appreciation supports a ~$31k cash-out refi (75% LTV) — recoverable capital for the next deal without selling this one.
Negotiation context
- It's been on market 34 days — a 3% lower offer ($86k) is reasonable based on typical stale-listing flexibility.
- Current owner paid $53k; list at $89k implies a 68% gain — meaningful room to come down on a strong offer.
Risks & watch-outs
- Watch-outs: built in 1900 — expect roof / HVAC / electrical / plumbing capex.
Questions for the listing agent
- It's been on market 34 days. Have you received any prior offers? Is the seller open to a 3% concession, seller financing, or rate buy-down credit?
- Built in 1900 — when were the roof, HVAC, electrical panel, plumbing, and water heater last replaced?
- Is there a deadline driving the sale (1031 exchange, divorce, estate, relocation)? That informs how much negotiation room exists.
- Schools are B-rated — typically a magnet for longer-tenancy family renters. What's the average tenant stay here, and is there a school-zone premium baked into asking?
- What's the average days-on-market for RENTAL listings here right now (not sales)? A rising rental-DOM trend means longer vacancies and softer asking-rent achievability than the comps imply.
- What's the recent tenant-quality profile in this submarket — average credit score on applications, eviction rate, late-payment / NSF rate, and stable-employment percentage? A property-management company in the area should have these aggregated.
- How much new for-sale + rental construction is in the pipeline within 1–3 miles? Heavy new supply typically softens prices + rents 12–24 months out; constrained supply supports both.
Investment metrics
- 1% rule
- 1.13% ✓
- Cap rate
- 8.72%
- Cash-on-cash
- 8.68%
- DSCR
- 1.39
- GRM
- 7.4
CMA / ARV
- ARV (on-the-fly)
- $190,736
- Comps found
- 9
Show comp detail 9 sales within ~0.75 mi
| Address | Dist | Beds/Ba | Sqft | Sold | Price | $/sf | Match |
|---|---|---|---|---|---|---|---|
| 456 S Hazel St | 0.36mi | 3/1.0 | 1,316 (-10%) | 1mo | $187,000 | $142 | 63 |
| 476 S Hazel St | 0.33mi | 2/1.0 (-1) | 1,564 (+7%) | 4mo | $205,000 | $131 | 60 |
| 410 Spring St | 0.41mi | 3/3.0 | 1,564 (+7%) | 10mo | $290,000 | $185 | 56 |
| 363 Spring St | 0.23mi | 3/1.0 | 1,318 (-10%) | 24mo | $130,000 | $99 | 50 |
| 348 S 8th St | 0.47mi | 3/1.5 | 1,248 (-14%) | 9mo | $194,000 | $155 | 45 |
| 510 S 8th St | 0.34mi | 3/2.0 | 1,670 (+15%) | 23mo | $205,000 | $123 | 41 |
| 213 E Johnson St | 0.68mi | 4/1.0 (+1) | 1,314 (-10%) | 5mo | $115,000 | $88 | 38 |
| 418 & 420 Mcconnell St | 0.46mi | 3/1.0 | 1,280 (-12%) | 23mo | $90,000 | $70 | 35 |
| 217 S 8th St | 0.62mi | 3/1.5 | 1,248 (-14%) | 20mo | $185,000 | $148 | 28 |
Match score weights: distance 35% · size 25% · config 20% · recency 20%. Top-matched comps best support the ARV.
Projected returns pro-forma
2.86% appreciation · 3.0% rent growth · sell at horizon
- IRR
- 15.3%
- Equity multiple
- 1.87×
- Total profit
- $21,563
- Equity at exit
- $39,319
- IRR
- 17.1%
- Equity multiple
- 3.47×
- Total profit
- $61,524
- Equity at exit
- $60,057
Cash invested: $24,920 (down + closing). Projections, not guarantees.
Landlord ↔ Tenant lean methodology
- Overall (STATE)
- 73 Landlord-Friendly
- State Ohio
- 73 Landlord-Friendly · R+6
- County
- — inherits STATE
- City
- — inherits STATE
ZIP-level market 43351
- Home prices YoY
- 0.8%
- Active inventory
- 40
- Price-to-rent
- 7.4×
Monthly cashflow live
- Estimated rent
- $1,007 medium interval (Pro) →
- Mortgage (P&I)
- −$467
- Tax from tax record
- −$111 /mo · $1,334/yr
- Insurance
- −$37
- HOA
- −$0
- Vacancy / Maint / Mgmt
- −$211
- Net cashflow
- $180
Break-even live
Sensitivity live
| Price | -10% $231 | -5% $205 | +0% $180 | +5% $155 | +10% $130 |
|---|---|---|---|---|---|
| Rent | -10% $101 | -5% $141 | +0% $180 | +5% $220 | +10% $260 |
| Rate | -1.0pp $225 | -0.5pp $203 | base $180 | +0.5pp $157 | +1.0pp $134 |
UW: 25.0% down · 7.5% · 30yr · 1.5% tax · 5.0% vac · 8.0% maint · 8.0% mgmt
Financing live
Cash to close
- Down payment
- $22,250
- Closing costs
- $2,670
- Reserves months
- —
- Total cash needed
- —
Loan-product check · same deal, 3 products live
Conventional
25% down · 7.5% · 30yr
- Down + closing
- —
- Monthly P&I
- —
- Monthly cashflow
- —
- DSCR
- —
- Eligible?
- —
Personal DTI + credit; lowest rate.
DSCR
20% down · 8.5% · 30yr
- Down + closing
- —
- Monthly P&I
- —
- Monthly cashflow
- —
- DSCR
- —
- Eligible?
- —
No personal income docs; deal must DSCR.
Hard money
10% down · 12.0% · 12mo
- Down + closing
- —
- Monthly P&I
- —
- Monthly cashflow
- —
- DSCR
- —
- Eligible?
- —
Short-term bridge; refi at stabilization.
Listing history 17 events
-
2026-06-21days on market $89,000 Active 34 DOM
-
2026-06-21days on market $89,000 Active 33 DOM
-
2026-06-18days on market $89,000 Active 31 DOM
-
2026-06-17days on market $89,000 Active 30 DOM
-
2026-06-16days on market $89,000 Active 29 DOM
-
2026-06-15days on market $89,000 Active 28 DOM
-
2026-06-13days on market $89,000 Active 26 DOM
-
2026-06-12days on market $89,000 Active 25 DOM
-
2026-06-09days on market $89,000 Active 22 DOM
-
2026-06-08days on market $89,000 Active 21 DOM
-
2026-06-08days on market $89,000 Active 20 DOM
-
2026-06-04days on market $89,000 Active 16 DOM
-
2026-06-02days on market $89,000 Active 15 DOM
-
2026-06-01days on market $89,000 Active 14 DOM
-
2026-05-31days on market $89,000 Active 13 DOM
-
2026-05-18$89,000 Active
-
1996-08-09soldstatus $53,000
ⓘ Source: listings_history table (triggers on properties + properties_extension) + one-shot
backfill from property_details.listing_events for pre-trigger history.
Tax reassessment forecast OH · Partial reset (capped growth)
- Current annual tax
- $1,334 · $111/mo
- Projected year-2 tax
- $1,361 · $113/mo
- Expected delta
- +$27/yr (+$2/mo · 2.0%)
ⓘ Screening estimate from a state-policy table — verify with the county assessor before closing.
Climate risk First Street
- Flood 1/10 Low 0% chance over 30 yrs
- Wildfire 1/10 Low
- Heat 3/10 Moderate 7 d/yr ≥99°F today · 17 d/yr by 30 yrs out
- Wind 2/10 Low
- Air quality 2/10 Low 1 unhealthy d/yr today · 1 by 30 yrs out
Nearby sold comps map
Loading sold comps map…
Walkable amenities ~0.75 mi
Loading nearby amenities…
Taxation est. · year 1
- Rental income
- $12,081
- − Mortgage interest
- −$4,985
- − Property taxes
- −$1,334
- − Insurance
- −$445
- − Repairs & maintenance
- −$966
- − Management
- −$966
- − Depreciation
- −$2,589
- Taxable income
- $794
- Est. tax owed @ 24.0%
- −$191
- After-tax cash flow
- $1,973/yr
For passive investors: Depreciation is non-cash, so a rental often shows a tax loss while cash-flowing — sheltering income. Rental losses are passive: they offset passive income freely, and up to $25,000/yr can offset ordinary (W-2) income if you actively participate and your MAGI is under $100k (phasing out to $0 by $150k); unused losses carry forward. On sale, claimed depreciation is recaptured at up to 25%, and gains may owe capital-gains tax (a 1031 exchange can defer both). Figures are a year-1 estimate at your 24.0% rate — not tax advice; consult a CPA.
Schools (NCES district)
- District
- Upper Sandusky Exempted Village
- NCES district ID
- 3910024
- Math proficiency
- 60% ▼ -7.00%
- Reading proficiency
- 64% ▼ -7.00%
- Median HH income
- $44,745
- Composite
- 52.22/100
- National rank
- #1603
- State rank
- #268 of 656 in OH
Livability — Upper Sandusky
- Score
- 75/100
- State rank
- #248
- US rank
- #3965
Category grades
Schools grade is shown separately in the Schools card above.
Census & demographics
- Census place
- Upper Sandusky, OH
- County
- Wyandot · 23,050 people
- Population (ZIP)
- 10,568
- Household income
- $71,748
- Rent vs Own
- Severe rent burden
- 3.6
Population outlook (Wyandot County) Hauer SSP2
- Today (2025)
- 21,485 people
- By 2030
- 20,883 · -2.8%
- By 2040
- 19,425 · -9.6%
- By 2050
- 17,815 · -17.1%
- By 2075
- 14,208 · -33.9%
- By 2100
- 10,744 · -50.0%
Race, ethnicity, and origin ACS 2023
- Neighborhood character
- Predominantly White (92%)
- Race & ethnicity
- White 92% Two or more races 5% Hispanic / Latino 5%
- Common ancestry
- Serbian 5% Slovak 2% Iranian 2%
- Foreign-born
- 1% · Canada
- Languages at home
- 98% English-only · Spanish 2%
Political lean MEDSL · Wyandot
- 2024 margin
- Solid R (+51.2) · D 24.0% · R 75.2%
- 2008→2024 swing
- -34.7pp toward R · 2008: -16.5pp · 2024: -51.2pp
- All cycles
- 2024: R+51.2 2020: R+50.3 2016: R+46.8 2012: R+20.4 2008: R+16.5
Not yet ingested
- Civics
- —
Market trends
- HPI YoY
- ▲ 2.86%
- Current HPI
- 343.75
- Rent YoY
- —
- Metro
- —
- State GDP YoY
- ▲ 1.98%
- F500 in state
- 48
Industry mix (Fortune 500 HQ in OH)
| Industry | F500 HQs | Revenue |
|---|---|---|
| Insurance | 3 | $145B |
|
||
| Industrial Machinery | 3 | $49B |
|
||
| Financial Services | 3 | $24B |
|
||
| Consumer Goods | 2 | $93B |
|
||
| Aerospace / Defense | 2 | $47B |
|
||
| Utilities | 2 | $33B |
|
||
Price history
+67.9% since first listed2 events — show timeline
- 2026-05-18 Listed $89,000 NORIS
- 1996-08-09 Sold (Public Records) $53,000 Public Records
Property tax history
+8.8%/yrLatest (2025): $1,334 · +22.0% YoY. Source: county tax records.
Cash-flow waterfall
monthlySold comps — $/sqft
last 12 mo · ≤1 miLoading sold comps…