 12-Plex
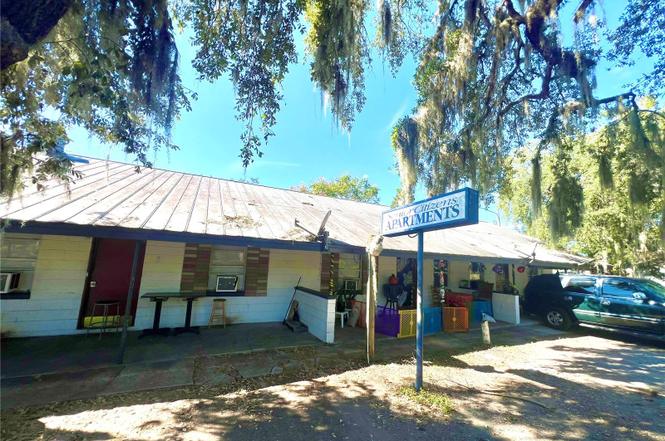
301 S East St · Leesburg, FL
Flood risk 6/10 · Moderate
- FEMA flood zone
- X (unshaded)
- Chance of flooding over 30 yrs
- 0.69%
- Est. flood insurance / yr
- $507 – $1,088
Fire risk 3/10 · Minor
- Est. fire insurance / yr
- $947 – $1,759
Heat risk 8/10 · Major
- Hot days now (above 107°F)
- 7 days/yr
- Hot days in 30 yrs
- 22 days/yr
Wind risk 9/10 · Severe
- Chance of severe wind over 30 yrs
- 99.0%
Air-quality risk 2/10 · Minimal
- Unhealthy air days now
- 1 days/yr
- Unhealthy air days in 30 yrs
- 1 days/yr
Risk factors via First Street. Map © Google.
Why this score? — see what drove the B- grade
The composite is a weighted blend of 9 inputs, each scored 0–100. Each bar is that input's sub-score; the figure is the points it added to the 100-point composite (weight × sub-score).
- Cash flow +30.0/30.0
- DSCR +10.0/10.0
- 1% rule +9.9/10.0
- ARV discount +7.5/15.0
- Schools +4.2/10.0
- Livability +3.1/5.0
- Condition / age +2.5/5.0
- Rent growth +2.3/5.0
- Appreciation +0.0/10.0
$1,000,000
🖨 Deal sheet (PDF) 📄 Offer letter ✓ Due diligence
Multi-family units
County records classify this as Multi-Family (5+ Unit). Listing-text estimate: 12 units. confirmed
5+ unit building — per-unit beds/baths from public records are typically unavailable; the breakdown below (if shown) is an estimate from the listing text.
Listing remarks MLS
This 12 unit apartment building is ready for a long term buyer looking to gain equity and add value after purchasing. Of the twelve units, nine have been gutted and renovated. Ten units are all rented at $700 per month, One unit is vacant and ready for remodeling and One unit is occupied on a month to month lease. The roof will need to be replaced at some point in the near future. Property management is currently in place and will be offered for any buyer after closing. Cost Analysis Performed as Rental Property is listed below. In: Rent - $97,500.00 Out: (Annual) Property Taxes - $6,115.00 (Annual) Estimated Insurance - $5,421.00 (Annual) Property Management (Optional) - $5,850.00 (Annual) Estimated Utilities/Lawn/Misc. $3,510.00 Total Costs - $20,896.00 Net: $76,604.00 Earn: Total yearly net equates to - $76,604.00 Total monthly gross equates to - $8,125.00 Price - $750,000.00 Net Cap Rate -10.21%
Key facts
- 0.48 acre lot
- Built 1957
- Listed 574 days
Tags
Property features AI
Finance
- Other: Total living area reported as 7,072 (source: public records)
- Financial info: Gross income reported at $115,200; Estimated annual market income $144,000; Annual net income reported at $115,200; Pro forma rent example: $800 for unit type
- HOA & community: No HOA/association; Street lights in the community
Exterior
- Parking: No attached garages for units
- Security: No security features provided
- Utilities: Water: Private and Public water available; Sewer: Public sewer; Utilities available: Electricity, Cable, Sewer, Public utilities
- Home design: Residential income property (multi-family 5+); Single building (1 building); Zoned R-3; Lot about 0.48 acres (quarter to less than half acre)
- Construction: Block construction; Metal roof; Slab foundation; Building constructed for multi-family use
- Exterior features: Fenced property; Asphalt road access
Interior
- Kitchen: No specific kitchen appliance details provided
- Bedrooms: Total of 24 bedrooms; Units are 2-bedroom layouts (12 total units)
- Flooring: No flooring details provided
- Bathrooms: Each 2-bedroom unit has 1 bathroom
- Heating & cooling: Electric heating; Ductless heating; Wall/window cooling units
- Interior features: Other interior features
- Laundry & utility: Laundry features listed as Other
Neighborhood map
What this means for you Summary
Snapshot
- This is a 12 × 2-bed/1.0-bath units multifamily listed at $1.00M.
Deal economics
- At list price, monthly cash flow is $5k ($61k/yr) — positive. Per door: $426/mo.
- The deal already cash-flows at list — no discount required.
- Meets the 1% rule at list price ($15k rent vs $1.00M).
- Recommended offer: $880k (12.0% below list) — sets the bar for market timing.
- Cap rate 12.4% vs local median 4.5% in Leesburg — top-decile yield for the area; either an underpriced asset or a hidden risk that comps aren't pricing in. Stress-test before assuming the spread holds.
Location & tenants
- Location reads 62/100 on livability (#751 in FL) — a middle-class / working-renter tenant base. Strengths: cost of living A+, housing A+; Watch: schools D+, crime D, amenities F.
- Lake (suburban): math 49% / reading 50% proficiency, ranked #37 of 73 in FL (top 51%) — families likely to look elsewhere, expect single-tenant / working-renter base with shorter leases.
- Market conditions: Rents soft (-0.9%/yr); 783 active listings in the ZIP; 4,799 units permitted in Lake County in 2024 (814 in 5+ unit buildings).
- At $14,888/mo this rent would consume 307% of the median local household income ($58k/yr) (locally 1745% of renters already pay >50% of income on rent) — very limited rent-growth headroom before tenants either downsize or default.
Forward outlook
- Local home prices are declining (-3.0%/yr); year-one equity from $7k of loan paydown is wiped out by about $30k of value loss. Plan a longer hold.
- Lake County population projected at +37% by 2050 — long-run rental-demand tailwind backs the buy-and-hold thesis.
- At projected returns (-3.0% appreciation + 0.0% rent growth), your $280k cash investment doubles in ~7 years — after that, you're playing with house money.
Negotiation context
- It's been on market 574 days — a 12% lower offer ($880k) is reasonable based on typical stale-listing flexibility.
- 13 sale attempts since 7y ago; this cycle's ask is 111011% above the opening price — seller raised mid-cycle; expect resistance to lowballs.
- Current owner paid $715k; 40% above their basis — modest negotiation headroom, anchor on the comps not their cost.
Risks & watch-outs
- Watch-outs: built in 1957 — expect roof / HVAC / electrical / plumbing capex.
- Climate carrying-cost: major flood risk; severe wind risk, 99% chance of damaging wind over 30y; extreme-heat days projected 7→22/yr by 2055 (HVAC capex compounding) — expect insurance premiums to compound above CPI over the hold.
Questions for the listing agent
- It's been on market 574 days. Have you received any prior offers? Is the seller open to a 12% concession, seller financing, or rate buy-down credit?
- Can we see the unit-by-unit rent roll, current vacancy, and any below-market leases? What's the average tenancy length?
- What capital expenditures (roof, boiler, parking lot, exteriors) have been made in the last 5 years, and what's planned in the next 2?
- Built in 1957 — when were the roof, HVAC, electrical panel, plumbing, and water heater last replaced?
- Why hasn't it sold? Are there any deal-killer items the seller is aware of (foundation, flood, title, zoning, code violations)?
- Is there a deadline driving the sale (1031 exchange, divorce, estate, relocation)? That informs how much negotiation room exists.
- Schools are D-rated, which usually means shorter tenancies and higher turnover. Who's the typical renter profile here, and what's been the actual vacancy rate?
- Crime grade is D in this area — have there been break-ins, vandalism, or insurance claims at this property in the last 3 years? What carrier currently insures it and at what premium?
- What's the average days-on-market for RENTAL listings here right now (not sales)? A rising rental-DOM trend means longer vacancies and softer asking-rent achievability than the comps imply.
- What's the recent tenant-quality profile in this submarket — average credit score on applications, eviction rate, late-payment / NSF rate, and stable-employment percentage? A property-management company in the area should have these aggregated.
- How much new apartment / multifamily construction is in the pipeline within 1–3 miles? Heavy new supply (>2% of stock underway) typically softens rents 12–24 months out; light construction supports rent growth.
Investment metrics
- 1% rule
- 1.49% ✓
- Cap rate
- 12.42%
- Cash-on-cash
- 21.90%
- DSCR
- 1.97
- GRM
- 5.6
CMA / ARV
No comps found within radius.
Projected returns pro-forma
-3.0% appreciation · 0.0% rent growth · sell at horizon
- IRR
- 11.2%
- Equity multiple
- 1.43×
- Total profit
- $119,809
- Equity at exit
- $149,103
- IRR
- 17.7%
- Equity multiple
- 2.27×
- Total profit
- $355,005
- Equity at exit
- $86,462
Cash invested: $280,000 (down + closing). Projections, not guarantees.
Landlord ↔ Tenant lean methodology
- Overall (STATE)
- 87 Strongly Landlord-Friendly
- State Florida
- 87 Strongly Landlord-Friendly · R+3
- County
- — inherits STATE
- City
- — inherits STATE
ZIP-level market 34748
- Home prices YoY
- -25.3%
- Rents YoY
- -0.9%
- Active inventory
- 783
- Price-to-rent
- 67.2×
Monthly cashflow live
- Estimated rent
- $14,888 medium interval (Pro) →
- Mortgage (P&I)
- −$5,244
- Tax from tax record
- −$991 /mo · $11,897/yr
- Insurance
- −$417
- HOA
- −$0
- Vacancy / Maint / Mgmt
- −$3,126
- Net cashflow
- $5,109
Break-even live
Sensitivity live
| Price | -10% $5,675 | -5% $5,392 | +0% $5,109 | +5% $4,826 | +10% $4,543 |
|---|---|---|---|---|---|
| Rent | -10% $3,933 | -5% $4,521 | +0% $5,109 | +5% $5,697 | +10% $6,285 |
| Rate | -1.0pp $5,613 | -0.5pp $5,364 | base $5,109 | +0.5pp $4,850 | +1.0pp $4,587 |
12-unit breakdown (identical units grouped — click to expand)
| Units | Beds | Baths | Est. rent |
|---|---|---|---|
| 12× units | 2 | 1 | $14,892 |
| #1 | 2 | 1 | $1,241 |
| #2 | 2 | 1 | $1,241 |
| #3 | 2 | 1 | $1,241 |
| #4 | 2 | 1 | $1,241 |
| #5 | 2 | 1 | $1,241 |
| #6 | 2 | 1 | $1,241 |
| #7 | 2 | 1 | $1,241 |
| #8 | 2 | 1 | $1,241 |
| #9 | 2 | 1 | $1,241 |
| #10 | 2 | 1 | $1,241 |
| #11 | 2 | 1 | $1,241 |
| #12 | 2 | 1 | $1,241 |
| Total (12 units) | $14,888 | ||
UW: 25.0% down · 7.5% · 30yr · 1.5% tax · 5.0% vac · 8.0% maint · 8.0% mgmt
Financing live
Cash to close
- Down payment
- $250,000
- Closing costs
- $30,000
- Reserves months
- —
- Total cash needed
- —
Loan-product check · same deal, 3 products live
Conventional
25% down · 7.5% · 30yr
- Down + closing
- —
- Monthly P&I
- —
- Monthly cashflow
- —
- DSCR
- —
- Eligible?
- —
Personal DTI + credit; lowest rate.
DSCR
20% down · 8.5% · 30yr
- Down + closing
- —
- Monthly P&I
- —
- Monthly cashflow
- —
- DSCR
- —
- Eligible?
- —
No personal income docs; deal must DSCR.
Hard money
10% down · 12.0% · 12mo
- Down + closing
- —
- Monthly P&I
- —
- Monthly cashflow
- —
- DSCR
- —
- Eligible?
- —
Short-term bridge; refi at stabilization.
Listing history 36 events
-
2026-04-30$900
-
2026-04-23historical $900
-
2026-04-02$900
-
2026-03-14historical $1,000
-
2026-03-01$1,000
-
2026-02-17historical $1,000
-
2026-02-06$1,000
-
2026-02-06historical $1,000
-
2026-01-16price $1,000,000
-
2025-12-23price $1,000
-
2025-12-21$1,025
-
2025-12-21historical $1,025
-
2025-11-20price $1,025
-
2025-10-08$1,205
-
2025-10-07historical $1,205
-
2025-10-07$1,205
-
2025-08-18historical $950
-
2025-08-08price $950
-
2025-07-31$975
-
2025-07-25historical $975
-
2025-07-18$975
-
2025-04-04historical $950
-
2025-04-03$950
-
2025-03-11price $1,200,000
-
2025-01-22price $1,250,000
-
2024-11-01$1,380,000 Active
-
2020-02-06soldstatus $715,000 Sold 937-char remark
Show marketing remark (937 chars)
This 12 unit apartment building is ready for a long term buyer looking to gain equity and add value after purchasing. Of the twelve units, nine have been gutted and renovated. Ten units are all rented at $700 per month, One unit is vacant and ready for remodeling and One unit is occupied on a month to month lease. The roof will need to be replaced at some point in the near future. Property management is currently in place and will be offered for any buyer after closing. Cost Analysis Performed as Rental Property is listed below. In: Rent - $97,500.00 Out: (Annual) Property Taxes - $6,115.00 (Annual) Estimated Insurance - $5,421.00 (Annual) Property Management (Optional) - $5,850.00 (Annual) Estimated Utilities/Lawn/Misc. $3,510.00 Total Costs - $20,896.00 Net: $76,604.00 Earn: Total yearly net equates to - $76,604.00 Total monthly gross equates to - $8,125.00 Price - $750,000.00 Net Cap Rate -10.21%
-
2020-02-06soldstatus $715,000
Show marketing remark (937 chars)
This 12 unit apartment building is ready for a long term buyer looking to gain equity and add value after purchasing. Of the twelve units, nine have been gutted and renovated. Ten units are all rented at $700 per month, One unit is vacant and ready for remodeling and One unit is occupied on a month to month lease. The roof will need to be replaced at some point in the near future. Property management is currently in place and will be offered for any buyer after closing. Cost Analysis Performed as Rental Property is listed below. In: Rent - $97,500.00 Out: (Annual) Property Taxes - $6,115.00 (Annual) Estimated Insurance - $5,421.00 (Annual) Property Management (Optional) - $5,850.00 (Annual) Estimated Utilities/Lawn/Misc. $3,510.00 Total Costs - $20,896.00 Net: $76,604.00 Earn: Total yearly net equates to - $76,604.00 Total monthly gross equates to - $8,125.00 Price - $750,000.00 Net Cap Rate -10.21%
-
2019-12-20status Pending 937-char remark
Show marketing remark (937 chars)
This 12 unit apartment building is ready for a long term buyer looking to gain equity and add value after purchasing. Of the twelve units, nine have been gutted and renovated. Ten units are all rented at $700 per month, One unit is vacant and ready for remodeling and One unit is occupied on a month to month lease. The roof will need to be replaced at some point in the near future. Property management is currently in place and will be offered for any buyer after closing. Cost Analysis Performed as Rental Property is listed below. In: Rent - $97,500.00 Out: (Annual) Property Taxes - $6,115.00 (Annual) Estimated Insurance - $5,421.00 (Annual) Property Management (Optional) - $5,850.00 (Annual) Estimated Utilities/Lawn/Misc. $3,510.00 Total Costs - $20,896.00 Net: $76,604.00 Earn: Total yearly net equates to - $76,604.00 Total monthly gross equates to - $8,125.00 Price - $750,000.00 Net Cap Rate -10.21%
-
2019-12-12$750,000 Active 937-char remark
Show marketing remark (937 chars)
This 12 unit apartment building is ready for a long term buyer looking to gain equity and add value after purchasing. Of the twelve units, nine have been gutted and renovated. Ten units are all rented at $700 per month, One unit is vacant and ready for remodeling and One unit is occupied on a month to month lease. The roof will need to be replaced at some point in the near future. Property management is currently in place and will be offered for any buyer after closing. Cost Analysis Performed as Rental Property is listed below. In: Rent - $97,500.00 Out: (Annual) Property Taxes - $6,115.00 (Annual) Estimated Insurance - $5,421.00 (Annual) Property Management (Optional) - $5,850.00 (Annual) Estimated Utilities/Lawn/Misc. $3,510.00 Total Costs - $20,896.00 Net: $76,604.00 Earn: Total yearly net equates to - $76,604.00 Total monthly gross equates to - $8,125.00 Price - $750,000.00 Net Cap Rate -10.21%
-
2019-06-24historical
-
2019-06-19$650,000 Active
-
1999-04-01soldstatus $268,000
-
1998-08-13soldstatus $279,000
-
1997-07-01soldstatus $75,000
-
1995-07-24soldstatus $295,000
ⓘ Source: listings_history table (triggers on properties + properties_extension) + one-shot
backfill from property_details.listing_events for pre-trigger history.
Tax reassessment forecast FL · Resets to sale price
- Current annual tax
- $11,897 · $991/mo
- Projected year-2 tax
- $11,897 · $991/mo
- Expected delta
- $0/yr ($0/mo · 0.0%)
ⓘ Screening estimate from a state-policy table — verify with the county assessor before closing.
Climate risk First Street
- Flood 6/10 Major FEMA zone X (unshaded) · 69% chance over 30 yrs
- Wildfire 3/10 Moderate
- Heat 8/10 Severe 7 d/yr ≥107°F today · 22 d/yr by 30 yrs out
- Wind 9/10 Extreme 99% chance of damaging wind over 30 yrs
- Air quality 2/10 Low 1 unhealthy d/yr today · 1 by 30 yrs out
Nearby sold comps map
Loading sold comps map…
Walkable amenities ~0.75 mi
Loading nearby amenities…
Taxation est. · year 1
- Rental income
- $178,656
- − Mortgage interest
- −$56,016
- − Property taxes
- −$11,897
- − Insurance
- −$5,000
- − Repairs & maintenance
- −$14,292
- − Management
- −$14,292
- − Depreciation
- −$29,091
- Taxable income
- $48,068
- Est. tax owed @ 24.0%
- −$11,536
- After-tax cash flow
- $49,776/yr
For passive investors: Depreciation is non-cash, so a rental often shows a tax loss while cash-flowing — sheltering income. Rental losses are passive: they offset passive income freely, and up to $25,000/yr can offset ordinary (W-2) income if you actively participate and your MAGI is under $100k (phasing out to $0 by $150k); unused losses carry forward. On sale, claimed depreciation is recaptured at up to 25%, and gains may owe capital-gains tax (a 1031 exchange can defer both). Figures are a year-1 estimate at your 24.0% rate — not tax advice; consult a CPA.
Schools (NCES district)
- District
- Lake
- NCES district ID
- 1201050
- Math proficiency
- 49% ▼ -7.00%
- Reading proficiency
- 50% ▼ -4.00%
- Median HH income
- $46,632
- Composite
- 42.05/100
- National rank
- #3327
- State rank
- #37 of 73 in FL
Livability — Leesburg
- Score
- 62/100
- State rank
- #751
- US rank
- #16429
Category grades
Schools grade is shown separately in the Schools card above.
Census & demographics
- Census place
- Leesburg, FL
- County
- Lake County · 364,602 people
- City population
- 70,232
- Metro
- Orlando-Kissimmee-Sanford, FL
- Population (ZIP)
- 48,095
- Household income
- $58,192
- Rent vs Own
- Severe rent burden
- 1745.0
Population outlook (Lake County) Hauer SSP2
- Today (2025)
- 386,640 people
- By 2030
- 417,107 · +7.9%
- By 2040
- 476,676 · +23.3%
- By 2050
- 531,296 · +37.4%
- By 2075
- 648,303 · +67.7%
- By 2100
- 698,530 · +80.7%
Race, ethnicity, and origin ACS 2023
- Neighborhood character
- Majority White (64%)
- Race & ethnicity
- White 64% Black 16% Hispanic / Latino 15% Two or more races 9% Asian 1%
- Hispanic origin (detail)
- Mexican 4% Puerto Rican 5% Cuban 3%
- Common ancestry
- Romanian 3% Lithuanian 3% Slovak 2%
- Foreign-born
- 9% · Canada, Vietnam, Jamaica
- Languages at home
- 88% English-only · Spanish 10% French/Haitian/Cajun 1%
Political lean MEDSL · Lake
- 2024 margin
- Strong R (+24.7) · D 37.3% · R 62.0%
- 2008→2024 swing
- -11.2pp toward R · 2008: -13.5pp · 2024: -24.7pp
- All cycles
- 2024: R+24.7 2020: R+20.0 2016: R+23.1 2012: R+17.1 2008: R+13.5
Not yet ingested
- Civics
- —
Market trends
- HPI YoY
- ▼ -88.97%
- Current HPI
- 262.1766
- Rent YoY
- ▼ -0.95%
- Metro
- Orlando-Kissimmee-Sanford, FL
- State GDP YoY
- ▲ 3.28%
- F500 in state
- 36
Industry mix (Fortune 500 HQ in FL)
| Industry | F500 HQs | Revenue |
|---|---|---|
| Industrial Technology | 2 | $29B |
|
||
| Insurance | 2 | $17B |
|
||
| Retail | 1 | $60B |
|
||
| Technology Distribution | 1 | $58B |
|
||
| Homebuilding | 1 | $35B |
|
||
| Technology Manufacturing | 1 | $35B |
|
||
Price history
-99.7% since first listed36 events — show timeline
- 2026-04-30 Listed for Rent $900 RENTALBEAST
- 2026-04-23 Rental Removed $900 RENTALBEAST
- 2026-04-02 Listed for Rent $900 RENTALBEAST
- 2026-03-14 Rental Removed $1,000 RENTALBEAST
- 2026-03-01 Listed for Rent $1,000 RENTALBEAST
- 2026-02-17 Rental Removed $1,000 RENTALBEAST
- 2026-02-06 Listed for Rent $1,000 RENTALBEAST
- 2026-02-06 Rental Removed $1,000 RENTALBEAST
- 2026-01-16 Price Changed $1,000,000 Stellar MLS as Distributed by MLS Grid
- 2025-12-23 Price Changed $1,000 RENTALBEAST
- 2025-12-21 Listed for Rent $1,025 RENTALBEAST
- 2025-12-21 Rental Removed $1,025 RENTALBEAST
- 2025-11-20 Price Changed $1,025 RENTALBEAST
- 2025-10-08 Listed for Rent $1,205 RENTALBEAST
- 2025-10-07 Rental Removed $1,205 RENTALBEAST
- 2025-10-07 Listed for Rent $1,205 RENTALBEAST
- 2025-08-18 Rental Removed $950 RENTALBEAST
- 2025-08-08 Price Changed $950 RENTALBEAST
- 2025-07-31 Listed for Rent $975 RENTALBEAST
- 2025-07-25 Rental Removed $975 RENTALBEAST
- 2025-07-18 Listed for Rent $975 RENTALBEAST
- 2025-04-04 Rental Removed $950 LEASESTAR
- 2025-04-03 Listed for Rent $950 LEASESTAR
- 2025-03-11 Price Changed $1,200,000 Stellar MLS as Distributed by MLS Grid
- 2025-01-22 Price Changed $1,250,000 Stellar MLS as Distributed by MLS Grid
- 2024-11-01 Listed $1,380,000 Stellar MLS as Distributed by MLS Grid
- 2020-02-06 Sold (Public Records) $715,000 Public Records
- 2020-02-06 Sold (MLS) $715,000 Stellar MLS as Distributed by MLS Grid
- 2019-12-20 Pending — Stellar MLS as Distributed by MLS Grid
- 2019-12-12 Listed $750,000 Stellar MLS as Distributed by MLS Grid
- 2019-06-24 Listing Removed — Stellar MLS as Distributed by MLS Grid
- 2019-06-19 Listed $650,000 Stellar MLS as Distributed by MLS Grid
- 1999-04-01 Sold (Public Records) $268,000 Public Records
- 1998-08-13 Sold (Public Records) $279,000 Public Records
- 1997-07-01 Sold (Public Records) $75,000 Public Records
- 1995-07-24 Sold (Public Records) $295,000 Public Records
Property tax history
+16.0%/yrLatest (2025): $11,897 · +6.7% YoY. Source: county tax records.
Cash-flow waterfall
monthlySold comps — $/sqft
last 12 mo · ≤1 miLoading sold comps…