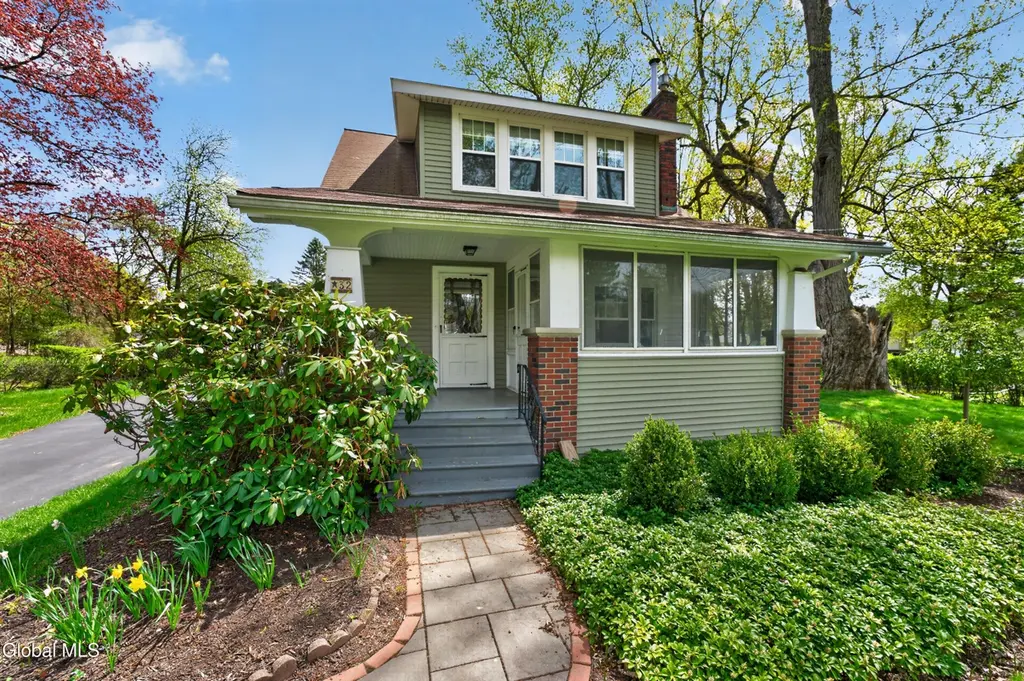
32 Old Troy Rd · East Greenbush, NY
Flood risk 1/10 · Minimal
- FEMA flood zone
- X
- Chance of flooding over 30 yrs
- 0.0%
- Est. flood insurance / yr
- $473 – $860
Fire risk 3/10 · Minor
- Est. fire insurance / yr
- $691 – $1,283
Heat risk 4/10 · Minor
- Hot days now (above 96°F)
- 7 days/yr
- Hot days in 30 yrs
- 16 days/yr
Wind risk 3/10 · Minor
- Chance of severe wind over 30 yrs
- 6.0%
Air-quality risk 2/10 · Minimal
- Unhealthy air days now
- 0 days/yr
- Unhealthy air days in 30 yrs
- 1 days/yr
Risk factors via First Street. Map © Google.
Why this score? — see what drove the D grade
The composite is a weighted blend of 9 inputs, each scored 0–100. Each bar is that input's sub-score; the figure is the points it added to the 100-point composite (weight × sub-score).
- ARV discount +12.8/15.0
- Cash flow +8.3/30.0
- Schools +6.1/10.0
- Livability +3.8/5.0
- 1% rule +3.1/10.0
- Rent growth +2.5/5.0
- Condition / age +2.5/5.0
- DSCR +2.3/10.0
- Appreciation +0.0/10.0
$309,000
🖨 Deal sheet 📄 Offer letter ✓ Due diligence
Listing remarks
MULTIPLE OFFERS RECEIVED FOR THIS HOME. THE SELLER IS ASKING FOR BEST AND FINAL OFFERS TO BE IN BY MONDAY MORNING AT 12 NOON. Adorable home in the heart of East Greenbush! This prime location offers easy access to shopping, major highways, the library, and is just minutes from Albany. This well-cared-for home is full of charm and features beautiful hardwood flooring throughout, along with an inviting enclosed front porch--perfect for your morning coffee. The first floor offers a welcoming living room with a cozy gas fireplace, a formal dining room, a kitchen with plenty of cabinet space, and a convenient first-floor laundry room. Upstairs, you'll find two generously sized bedrooms. The par
Key facts
- Hardwood flooring
- Flat backyard
- Deck
Tags
Property features AI
Exterior
- Parking: Detached garage (1 car); Paved parking with room for 6 total vehicles
- Utilities: 100 Amp electric service; Public water; Public sewer; Cable available
- Home design: Single family residence; Combination foundation
- Construction: Vinyl siding; Shingle/asphalt roof; Combination foundation; Below-grade finished area
- Exterior features: Rear enclosed porch; Front porch; Deck; Porch; Garden; Landscaped, cleared lot
Interior
- Kitchen: Dishwasher; Electric oven; Refrigerator
- Bedrooms: Two bedrooms on the second floor
- Flooring: Tile; Hardwood
- Bathrooms: One full bathroom on the second floor; One half bathroom on the first floor
- Heating & cooling: Hot water heating; Radiant heating
- Interior features: High-speed internet; Walk-in closet(s); Built-in features; Double pane windows; 12 total rooms; Full basement
- Laundry & utility: Main level laundry room; Washer/Dryer included
Neighborhood map
What this means for you Summary
Snapshot
- This is a 2-bed/1.5-bath single-family listed at $309k.
Deal economics
- At list price, monthly cash flow is $-281 ($-3k/yr) — negative.
- To cash-flow at today's rent, offer at most $259k (16.1% below list).
- To meet the 1% rule (rent ≥ 1% of price), the offer needs to be $249k (19.4% below list).
- Recommended offer: $249k (19.4% below list) — sets the bar for 1% rule.
- Cap rate 5.2% vs local median 3.0% in East Greenbush — top-decile yield for the area; either an underpriced asset or a hidden risk that comps aren't pricing in. Stress-test before assuming the spread holds.
Location & tenants
- Location reads 76/100 on livability (#233 in NY, #3,674 nationally) — a middle-class / working-renter tenant base. Strengths: employment A+, housing A+, health & safety A+; Watch: amenities F, commute F, cost of living D-.
- East Greenbush Central School District (suburban): math 68% / reading 71% proficiency, ranked #132 of 590 in NY (top 22%) — acceptable for families but not a draw, mixed tenant base, ~2y average lease; only 15% free/reduced lunch — higher-income household profile.
- Zoned schools: Columbia High School (math 97% / reading 87%, grade A+, #171 of 1,100 statewide, top 18%, 1,252 students, 27% FRL).
- Zoned-school proficiency averages 92% at this address vs 70% district-wide (+22 pts) — the actual schools serving this property are materially stronger than the East Greenbush Central School District average implies; a family-tenant draw the district grade alone would hide.
- Market conditions: 44 active listings in the ZIP; 5 comparable units currently listed for rent nearby; rentals at typical pace (median 24d on market — plan ~3-4 weeks tenant-placement turnaround); 405 units permitted in Rensselaer County in 2024 (224 in 5+ unit buildings).
Forward outlook
- Local home prices are declining (-3.0%/yr); year-one equity from $2k of loan paydown is wiped out by about $9k of value loss. Plan a longer hold.
- Rensselaer County population projected to shrink 6% by 2050 — rents likely to lag national; underwrite the cash flow, not the appreciation.
Negotiation context
- Only 6 days on market — expect competitive offers; lowballing is unlikely to land.
Risks & watch-outs
- Watch-outs: built in 1938 — expect roof / HVAC / electrical / plumbing capex.
Questions for the listing agent
- What do current leases actually rent for vs. the listed asking? Can we see a recent rent roll and the last 12 months of T-12 income?
- Built in 1938 — when were the roof, HVAC, electrical panel, plumbing, and water heater last replaced?
- Is there a deadline driving the sale (1031 exchange, divorce, estate, relocation)? That informs how much negotiation room exists.
- Schools are A-rated — typically a magnet for longer-tenancy family renters. What's the average tenant stay here, and is there a school-zone premium baked into asking?
- The area grade is low — what's the realistic commute time and amenity access for the typical tenant pool here? Any planned neighborhood developments (good or bad) we should know about?
- What's the average days-on-market for RENTAL listings here right now (not sales)? A rising rental-DOM trend means longer vacancies and softer asking-rent achievability than the comps imply.
- What's the recent tenant-quality profile in this submarket — average credit score on applications, eviction rate, late-payment / NSF rate, and stable-employment percentage? A property-management company in the area should have these aggregated.
- How much new for-sale + rental construction is in the pipeline within 1–3 miles? Heavy new supply typically softens prices + rents 12–24 months out; constrained supply supports both.
Investment metrics
- 1% rule
- 0.81% ✗
- Cap rate
- 5.20%
- Cash-on-cash
- -3.90%
- DSCR
- 0.83
- GRM
- 10.3
CMA / ARV
- ARV (median comp)
- $350,428
- List price
- $309,000
- Delta
- -11.82%
- Verdict
- UNDERPRICED
- Comps
- 20 within 1.0 mi
Show comp detail 9 sales within ~0.75 mi
| Address | Dist | Beds/Ba | Sqft | Sold | Price | $/sf | Match |
|---|---|---|---|---|---|---|---|
| 34 Troy Rd | 0.13mi | 3/2.0 (+1) | 1,392 (-4%) | 10mo | $340,000 | $244 | 72 |
| 7 Greenbush Ave | 0.11mi | 3/2.0 (+1) | 1,444 (-0%) | 19mo | $275,000 | $190 | 72 |
| 51 Rockrose Dr | 0.64mi | 2/2.0 | 1,524 (+5%) | 1mo | $408,500 | $268 | 59 |
| 11 Englewood Ave | 0.61mi | 2/1.0 | 1,362 (-6%) | 4mo | $86,200 | $63 | 56 |
| 50 Troy Rd | 0.28mi | 3/2.0 (+1) | 1,632 (+13%) | 15mo | $355,000 | $218 | 47 |
| 52 Rockrose Dr | 0.61mi | 2/2.0 | 1,524 (+5%) | 19mo | $360,000 | $236 | 45 |
| 7 Forrest Dr | 0.54mi | 3/1.5 (+1) | 1,575 (+9%) | 13mo | $272,507 | $173 | 45 |
| 8 Adams Ave | 0.73mi | 2/3.0 | 1,649 (+14%) | 9mo | $280,000 | $170 | 29 |
| 4 Corliss Ave | 0.70mi | 3/1.0 (+1) | 1,248 (-14%) | 15mo | $279,900 | $224 | 25 |
Match score weights: distance 35% · size 25% · config 20% · recency 20%. Top-matched comps best support the ARV.
Projected returns pro-forma
-3.0% appreciation · 3.0% rent growth · sell at horizon
- IRR
- -22.8%
- Equity multiple
- 0.22×
- Total profit
- $-67,869
- Equity at exit
- $46,073
- IRR
- -17.1%
- Equity multiple
- 0.06×
- Total profit
- $-81,718
- Equity at exit
- $26,717
Cash invested: $86,520 (down + closing). Projections, not guarantees.
Landlord ↔ Tenant lean methodology
- Overall (STATE)
- 15 Strongly Tenant-Friendly
- State New York
- 15 Strongly Tenant-Friendly · D+10
- County
- — inherits STATE
- City
- — inherits STATE
ZIP-level market 12061
- Home prices YoY
- -22.2%
- Active inventory
- 44
- Price-to-rent
- 10.3×
Monthly cashflow live
- Estimated rent
- $2,491 high interval (Pro) →
- Mortgage (P&I)
- −$1,620
- Tax from tax record
- −$500 /mo · $6,003/yr
- Insurance
- −$129
- HOA
- −$0
- Vacancy / Maint / Mgmt
- −$523
- Net cashflow
- $-281
Break-even live
UW: 25.0% down · 7.5% · 30yr · 1.5% tax · 5.0% vac · 8.0% maint · 8.0% mgmt
Financing live
Cash to close
- Down payment
- $77,250
- Closing costs
- $9,270
- Reserves months
- —
- Total cash needed
- —
Loan-product check · same deal, 3 products live
Conventional
25% down · 7.5% · 30yr
- Down + closing
- —
- Monthly P&I
- —
- Monthly cashflow
- —
- DSCR
- —
- Eligible?
- —
Personal DTI + credit; lowest rate.
DSCR
20% down · 8.5% · 30yr
- Down + closing
- —
- Monthly P&I
- —
- Monthly cashflow
- —
- DSCR
- —
- Eligible?
- —
No personal income docs; deal must DSCR.
Hard money
10% down · 12.0% · 12mo
- Down + closing
- —
- Monthly P&I
- —
- Monthly cashflow
- —
- DSCR
- —
- Eligible?
- —
Short-term bridge; refi at stabilization.
Rent comps 5 comps
| Address | Beds | Baths | Sqft | Rent | $/sqft | DOM | Units | Dist |
|---|---|---|---|---|---|---|---|---|
| 1 Forrest Pointe Dr East Greenbush, NY | 1.0–2.0 | 1.0–2.0 | 1193 | $2,889 | $2.42 | 14d | 1 | 0.52mi |
| 580 Columbia Tpke East Greenbush, NY | 2.0 | 2.0 | 1264 | $2,495 | $1.97 | 23d | 1 | 0.61mi |
| 578 Columbia Tpke East Greenbush, NY | 2.0 | 2.0 | 1210 | $2,495 | $2.06 | 23d | 1 | 0.63mi |
| 1 Town Center Dr East Greenbush, NY | 2.0 | 2.0 | 1210 | $2,555 | $2.11 | 23d | 1 | 0.64mi |
| 95 Gilligan Rd East Greenbush, NY | 2.0 | 2.0 | 1140 | $1,595 | $1.40 | 14d | 1 | 0.97mi |
Listing history 2 events
-
2026-05-06status Pending 1020-char remark
-
2026-04-29$309,000 Active 1020-char remark
ⓘ Source: listings_history table (triggers on properties + properties_extension) + one-shot
backfill from property_details.listing_events for pre-trigger history.
Tax reassessment forecast NY · Partial reset (capped growth)
- Current annual tax
- $6,003 · $500/mo
- Projected year-2 tax
- $6,003 · $500/mo
- Expected delta
- $0/yr ($0/mo · 0.0%)
ⓘ Screening estimate from a state-policy table — verify with the county assessor before closing.
Climate risk First Street
- Flood 1/10 Low FEMA zone X · 0% chance over 30 yrs
- Wildfire 3/10 Moderate
- Heat 4/10 Moderate 7 d/yr ≥96°F today · 16 d/yr by 30 yrs out
- Wind 3/10 Moderate 6% chance of damaging wind over 30 yrs
- Air quality 2/10 Low 0 unhealthy d/yr today · 1 by 30 yrs out
Nearby sold comps map
Loading sold comps map…
Walkable amenities ~0.75 mi
Loading nearby amenities…
Taxation est. · year 1
- Rental income
- $29,898
- − Mortgage interest
- −$17,309
- − Property taxes
- −$6,003
- − Insurance
- −$1,545
- − Repairs & maintenance
- −$2,392
- − Management
- −$2,392
- − Depreciation
- −$8,989
- Taxable loss
- −$8,731
- Est. tax savings @ 24.0%
- +$2,096
- After-tax cash flow
- $-1,278/yr
For passive investors: Depreciation is non-cash, so a rental often shows a tax loss while cash-flowing — sheltering income. Rental losses are passive: they offset passive income freely, and up to $25,000/yr can offset ordinary (W-2) income if you actively participate and your MAGI is under $100k (phasing out to $0 by $150k); unused losses carry forward. On sale, claimed depreciation is recaptured at up to 25%, and gains may owe capital-gains tax (a 1031 exchange can defer both). Figures are a year-1 estimate at your 24.0% rate — not tax advice; consult a CPA.
Schools (NCES district)
- District
- East Greenbush Central School District
- NCES district ID
- 3609630
- Math proficiency
- 68% ▼ -5.00%
- Reading proficiency
- 71% ▲ 2.00%
- Median HH income
- $73,174
- Composite
- 61.16/100
- National rank
- #783
- State rank
- #132 of 590 in NY
Livability — East Greenbush
- Score
- 76/100
- State rank
- #233
- US rank
- #3674
Category grades
Schools grade is shown separately in the Schools card above.
Census & demographics
- Population (ZIP)
- 9,778
Population outlook (Rensselaer County) Hauer SSP2
- Today (2025)
- 162,400 people
- By 2030
- 161,746 · -0.4%
- By 2040
- 158,095 · -2.7%
- By 2050
- 152,966 · -5.8%
- By 2075
- 140,767 · -13.3%
- By 2100
- 124,727 · -23.2%
Race, ethnicity, and origin ACS 2023
- Neighborhood character
- Predominantly White (84%)
- Race & ethnicity
- White 84% Hispanic / Latino 8% Two or more races 5% Asian 5% Black 3%
- Hispanic origin (detail)
- Puerto Rican 4% Dominican 2%
- Common ancestry
- Romanian 6% Lithuanian 5% Iranian 4%
- Foreign-born
- 9% · Canada, China
- Languages at home
- 89% English-only · Spanish 4% Other Indo-European 3% Other Asian/Pacific 2%
Political lean MEDSL · Rensselaer
- 2024 margin
- Toss-up / Even · D 50.7% · R 49.3%
- 2008→2024 swing
- -8.0pp toward R · 2008: 9.3pp · 2024: 1.4pp
- All cycles
- 2024: D+1.4 2020: D+5.6 2016: R+2.9 2012: D+11.8 2008: D+9.3
Not yet ingested
- Civics
- —
Market trends
- HPI YoY
- ▼ -75.49%
- Current HPI
- 265.2112
- Rent YoY
- —
- Metro
- —
- State GDP YoY
- ▲ 2.60%
- F500 in state
- 92
Industry mix (Fortune 500 HQ in NY)
| Industry | F500 HQs | Revenue |
|---|---|---|
| Financial Services | 10 | $950B |
|
||
| Consumer Goods | 9 | $162B |
|
||
| Insurance | 4 | $225B |
|
||
| Telecommunications | 2 | $144B |
|
||
| Pharmaceuticals | 2 | $112B |
|
||
| Media / Entertainment | 2 | $69B |
|
||
Price history
2 events — show timeline
- 2026-05-06 Pending — Global MLS
- 2026-04-29 Listed $309,000 Global MLS
Property tax history
+1.9%/yrLatest (2025): $6,003 · -8.9% YoY. Source: county tax records.
Cash-flow waterfall
monthlySold comps — $/sqft
last 12 mo · ≤1 miLoading sold comps…