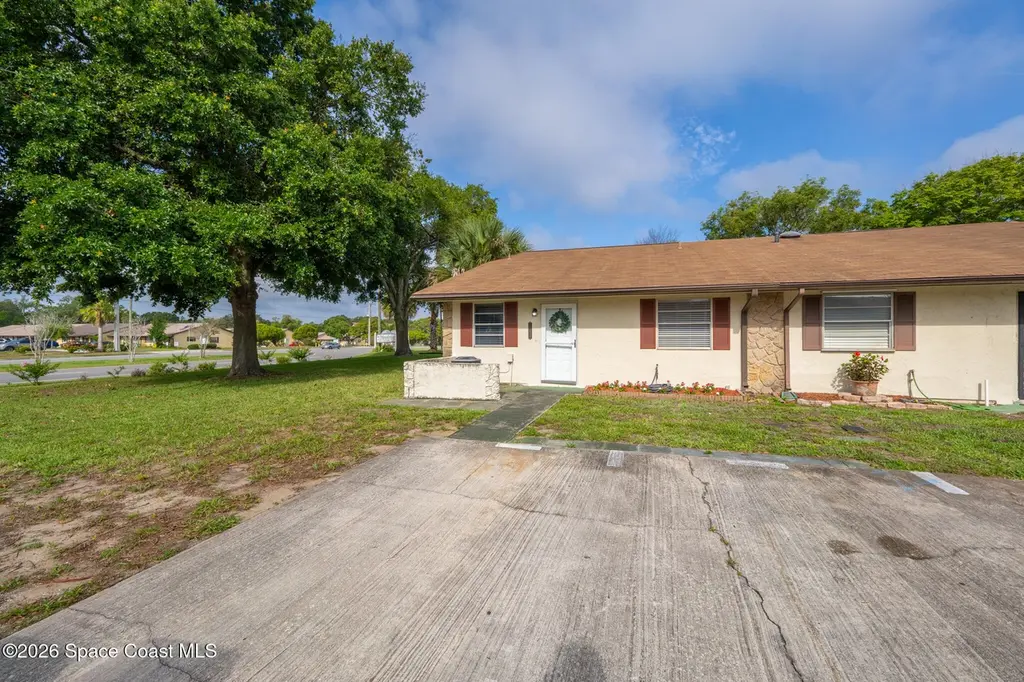
1140 Cheney Hwy Unit H · Titusville, FL
Flood risk 1/10 · Minimal
- FEMA flood zone
- X (unshaded)
- Chance of flooding over 30 yrs
- 0.0%
- Est. flood insurance / yr
- $507 – $1,088
Fire risk 4/10 · Minor
- Est. fire insurance / yr
- $947 – $1,759
Heat risk 10/10 · Severe
- Hot days now (above 108°F)
- 7 days/yr
- Hot days in 30 yrs
- 23 days/yr
Wind risk 10/10 · Severe
- Chance of severe wind over 30 yrs
- 99.0%
Air-quality risk 1/10 · Minimal
- Unhealthy air days now
- 0 days/yr
- Unhealthy air days in 30 yrs
- 0 days/yr
Risk factors via First Street. Map © Google.
Why this score? — see what drove the D grade
The composite is a weighted blend of 9 inputs, each scored 0–100. Each bar is that input's sub-score; the figure is the points it added to the 100-point composite (weight × sub-score).
- Cash flow +12.3/30.0
- ARV discount +7.5/15.0
- Schools +4.7/10.0
- Livability +4.2/5.0
- DSCR +3.7/10.0
- 1% rule +3.0/10.0
- Rent growth +2.8/5.0
- Condition / age +2.5/5.0
- Appreciation +0.0/10.0
$185,000
🖨 Deal sheet 📄 Offer letter ✓ Due diligence
Listing remarks MLS
* Property is under contract and only accepting backup offers at this time. * Corner townhouse in Titusville, located on the Space Coast! Featuring a cozy patio room and off-street parking, this home offers both comfort and convenience. Perfectly positioned near Playalinda Beach and Kennedy Space Center, you'll have jaw-dropping rocket launch views right from your doorstep. Priced below market value for a quick sale, this move-in ready home presents a fantastic opportunity to add your personal touch. With some minor cosmetic upgrades, this home can truly shine and reflect your style. Whether you're looking for a new home or a savvy investment, this townhouse offers unbeatable location and value!
Key facts
- Enclosed back porch
- Updated townhouse
- Laundry room
Tags
Property features AI
Finance
- Other: No private pool
- HOA & community: Community association with a $90 monthly fee
Exterior
- Parking: Assigned parking
- Utilities: Public sewer; Cable available
- Home design: Townhouse; Faces east
- Construction: Frame and stucco construction
- Exterior features: Lot features: Other
Interior
- Kitchen: Electric range; Refrigerator
- Bedrooms: 2 bedrooms
- Bathrooms: 2 full bathrooms
- Heating & cooling: Central heating; Central air conditioning
- Interior features: Unfurnished unit; Residential use
- Laundry & utility: Cable available
Neighborhood map
What this means for you Summary
Snapshot
- This is a 2-bed/2.0-bath townhouse listed at $185k.
Deal economics
- At list price, monthly cash flow is $-34 ($-406/yr) — negative.
- To cash-flow at today's rent, offer at most $179k (3.2% below list).
- To meet the 1% rule (rent ≥ 1% of price), the offer needs to be $148k (19.9% below list).
- Recommended offer: $148k (19.9% below list) — sets the bar for 1% rule.
Location & tenants
- Location reads 84/100 on livability (#42 in FL, #668 nationally) — a professional / high-income tenant draw. Strengths: commute A+, cost of living A+, housing A+; Watch: crime D, employment D.
- Brevard (suburban): math 53% / reading 57% proficiency, ranked #19 of 73 in FL (top 26%) — acceptable for families but not a draw, mixed tenant base, ~2y average lease.
- Zoned schools: Coquina Elementary School (math 38% / reading 45%, grade F, #1,437 of 2,144 statewide, top 68%, 557 students, 75% FRL); Andrew Jackson Middle School (math 52% / reading 47%, grade C, #259 of 571 statewide, top 46%, 551 students, 58% FRL); Titusville High School (math 33% / reading 52%, grade F, #264 of 667 statewide, top 41%, 1,314 students, 55% FRL) — zoned schools average 63% FRL vs 43% district-wide (20 pts higher); higher-poverty schools than district average — tighter screening recommended.
- Market conditions: Rents rising (+1.3%/yr); 462 active listings in the ZIP; 34 comparable units currently listed for rent nearby; rentals at typical pace (median 23d on market — plan ~3-4 weeks tenant-placement turnaround); 4,602 units permitted in Brevard County in 2024 (702 in 5+ unit buildings).
Forward outlook
- Local home prices are declining (-3.0%/yr); year-one equity from $1k of loan paydown is wiped out by about $6k of value loss. Plan a longer hold.
- Brevard County population projected at +15% by 2050 — modest demand growth; plan on rents tracking national, not racing it.
Negotiation context
- Only 11 days on market — expect competitive offers; lowballing is unlikely to land.
- 6 sale attempts since 21y ago with the ask held roughly flat each time — persistent listings suggest the price (not the market) is what's stuck; bring a comps-based counter.
- Current owner paid $159k; 16% above their basis — modest negotiation headroom, anchor on the comps not their cost.
Risks & watch-outs
- Climate carrying-cost: severe wind risk, 99% chance of damaging wind over 30y; extreme-heat days projected 7→23/yr by 2055 (HVAC capex compounding) — expect insurance premiums to compound above CPI over the hold.
Questions for the listing agent
- What do current leases actually rent for vs. the listed asking? Can we see a recent rent roll and the last 12 months of T-12 income?
- What does the HOA fee cover, when was the last increase, and are there any pending special assessments or reserve-fund shortfalls?
- Is there a deadline driving the sale (1031 exchange, divorce, estate, relocation)? That informs how much negotiation room exists.
- Crime grade is D in this area — have there been break-ins, vandalism, or insurance claims at this property in the last 3 years? What carrier currently insures it and at what premium?
- The area grade is low — what's the realistic commute time and amenity access for the typical tenant pool here? Any planned neighborhood developments (good or bad) we should know about?
- What's the average days-on-market for RENTAL listings here right now (not sales)? A rising rental-DOM trend means longer vacancies and softer asking-rent achievability than the comps imply.
- What's the recent tenant-quality profile in this submarket — average credit score on applications, eviction rate, late-payment / NSF rate, and stable-employment percentage? A property-management company in the area should have these aggregated.
- How much new for-sale + rental construction is in the pipeline within 1–3 miles? Heavy new supply typically softens prices + rents 12–24 months out; constrained supply supports both.
Investment metrics
- 1% rule
- 0.80% ✗
- Cap rate
- 6.07%
- Cash-on-cash
- -0.78%
- DSCR
- 0.97
- GRM
- 10.4
CMA / ARV
No comps found within radius.
Projected returns pro-forma
-3.0% appreciation · 1.29% rent growth · sell at horizon
- IRR
- -19.4%
- Equity multiple
- 0.33×
- Total profit
- $-34,661
- Equity at exit
- $27,584
- IRR
- -15.9%
- Equity multiple
- 0.17×
- Total profit
- $-42,987
- Equity at exit
- $15,995
Cash invested: $51,800 (down + closing). Projections, not guarantees.
Landlord ↔ Tenant lean methodology
- Overall (STATE)
- 87 Strongly Landlord-Friendly
- State Florida
- 87 Strongly Landlord-Friendly · R+3
- County
- — inherits STATE
- City
- — inherits STATE
ZIP-level market 32780
- Rents YoY
- 1.3%
- Active inventory
- 462
- Price-to-rent
- 10.4×
Monthly cashflow live
- Estimated rent
- $1,482 high interval (Pro) →
- Mortgage (P&I)
- −$970
- Tax from tax record
- −$67 /mo · $806/yr
- Insurance
- −$77
- HOA
- −$90
- Vacancy / Maint / Mgmt
- −$311
- Net cashflow
- $-34
Break-even live
UW: 25.0% down · 7.5% · 30yr · 1.5% tax · 5.0% vac · 8.0% maint · 8.0% mgmt
Financing live
Cash to close
- Down payment
- $46,250
- Closing costs
- $5,550
- Reserves months
- —
- Total cash needed
- —
Loan-product check · same deal, 3 products live
Conventional
25% down · 7.5% · 30yr
- Down + closing
- —
- Monthly P&I
- —
- Monthly cashflow
- —
- DSCR
- —
- Eligible?
- —
Personal DTI + credit; lowest rate.
DSCR
20% down · 8.5% · 30yr
- Down + closing
- —
- Monthly P&I
- —
- Monthly cashflow
- —
- DSCR
- —
- Eligible?
- —
No personal income docs; deal must DSCR.
Hard money
10% down · 12.0% · 12mo
- Down + closing
- —
- Monthly P&I
- —
- Monthly cashflow
- —
- DSCR
- —
- Eligible?
- —
Short-term bridge; refi at stabilization.
Rent comps 34 comps
| Address | Beds | Baths | Sqft | Rent | $/sqft | DOM | Units | Dist |
|---|---|---|---|---|---|---|---|---|
| 1281 Cheney Hwy Unit E Titusville, FL | 2.0 | 2.0 | 962 | $1,450 | $1.51 | 23d | 1 | 0.09mi |
| 1321 Cheney Hwy Unit F Titusville, FL | 2.0 | 2.5 | 962 | $1,500 | $1.56 | 23d | 1 | 0.12mi |
| 1321 Cheney Hwy Titusville, FL | 2.0 | 2.0 | 962 | $1,600 | $1.66 | 23d | 1 | 0.12mi |
| 1293 Cheney Hwy Unit G Titusville, FL | 2.0 | 2.0 | 962 | $1,389 | $1.44 | 13d | 1 | 0.14mi |
| 1700 Chaucer Rd Titusville, FL | 3.0 | 1.5 | 897 | $1,600 | $1.78 | 23d | 1 | 0.32mi |
| 4487 Barna Ave #4487 Titusville, FL | 2.0 | 1.0 | 800 | $1,450 | $1.81 | 14d | 1 | 0.44mi |
| 4700 Barna Ave Titusville, FL | 2.0 | 1.0 | 825 | $1,298 | $1.57 | 13d | 3 | 0.46mi |
| 4171 David Dr Titusville, FL | 2.0 | 1.0 | 900 | $1,075 | $1.19 | 23d | 1 | 0.59mi |
| 3645 Barna Ave Titusville, FL | 1.0–2.0 | 1.0 | 895 | $1,350 | $1.51 | 23d | 4 | 1.02mi |
| 628 Timber Trace Ln Titusville, FL | 2.0–3.0 | 2.0 | 1104 | $1,267 | $1.15 | 23d | 1 | 1.06mi |
| 4050 Mount Sterling Ave Titusville, FL | 3.0 | 1.0 | 960 | $1,700 | $1.77 | 14d | 1 | 1.08mi |
| 4124 Mount Vernon Ave Titusville, FL | 2.0 | 1.0 | 901 | $1,200 | $1.33 | 13d | 1 | 1.15mi |
| 3805 S Hopkins Ave Titusville, FL | 1.0–2.0 | 1.0 | 720 | $1,790 | $2.49 | 13d | 7 | 1.15mi |
| 2205 Knox McRae Dr Unit 14 Titusville, FL | 2.0 | 2.0 | 840 | $1,125 | $1.34 | 23d | 1 | 1.18mi |
| 2170 Knox Mc Rae Dr #5 Titusville, FL | 2.0 | 2.0 | 831 | $1,100 | $1.32 | 21d | 1 | 1.20mi |
| 2170 Knox Mc Rae Dr #39 Titusville, FL | 1.0 | 1.0 | 550 | $1,000 | $1.82 | 14d | 1 | 1.20mi |
| 2170 Knox Mc Rae Dr #38 Titusville, FL | 1.0 | 1.0 | 550 | $1,050 | $1.91 | 23d | 1 | 1.20mi |
| 3590 Sable Palm Ln Unit G Titusville, FL | 1.0 | 1.0 | 695 | $1,125 | $1.62 | 23d | 1 | 1.21mi |
| 2190 Knox McRae Dr Unit D Titusville, FL | 2.0 | 1.0 | 820 | $1,100 | $1.34 | 18d | 1 | 1.25mi |
| 2192 Knox McRae Dr Unit 1 Titusville, FL | 2.0 | 1.0 | 817 | $1,100 | $1.35 | 23d | 1 | 1.25mi |
| 2190 Knox McRae Dr Unit F Titusville, FL | 2.0 | 1.0 | 820 | $1,050 | $1.28 | 23d | 1 | 1.25mi |
| 3570 Sable Palm Ln Titusville, FL | 1.0–2.0 | 1.0–2.0 | 779 | $1,350 | $1.73 | 21d | 3 | 1.26mi |
| 3550 Sable Palm Ln Unit L Titusville, FL | 1.0 | 1.0 | 695 | $1,150 | $1.65 | 23d | 1 | 1.29mi |
| 3555 Sable Palm Ln Unit 7K Titusville, FL | 2.0 | 2.0 | 864 | $1,300 | $1.50 | 23d | 1 | 1.32mi |
| 3555 Sable Palm Ln Unit F Titusville, FL | 2.0 | 2.0 | 864 | $1,350 | $1.56 | 23d | 1 | 1.32mi |
| 190 E Olmstead Dr Unit M1 Titusville, FL | 2.0 | 2.0 | 1023 | $1,800 | $1.76 | 23d | 1 | 1.35mi |
| 190 E Olmstead Dr Titusville, FL | 2.0–3.0 | 1.0–2.0 | 1091 | $1,350 | $1.24 | 23d | 5 | 1.37mi |
| 1039 Country Club Dr Titusville, FL | 2.0 | 2.0 | 1020 | $1,800 | $1.76 | 23d | 1 | 1.42mi |
| 1041 Country Club Dr #426 Titusville, FL | 2.0 | 2.0 | 1020 | $1,800 | $1.76 | 23d | 1 | 1.43mi |
| 1041 Country Club Dr Titusville, FL | 2.0 | 2.0 | 1020 | $1,900 | $1.86 | 23d | 1 | 1.43mi |
| 1099 Country Club Dr #811 Titusville, FL | 2.0 | 2.0 | 940 | $1,800 | $1.91 | 23d | 1 | 1.43mi |
| 1209 Country Club Dr Titusville, FL | 2.0 | 2.0 | 935 | $1,700 | $1.82 | 23d | 1 | 1.43mi |
| 1237 Country Club Dr Titusville, FL | 2.0 | 2.0 | 970 | $1,600 | $1.65 | 23d | 1 | 1.43mi |
| 2605 Columbia Blvd Titusville, FL | 1.0–2.0 | 1.0 | 716 | $1,562 | $2.18 | 13d | 4 | 1.45mi |
HOA detail
- Monthly dues
- $90 · $1,080/yr
Listing history 10 events
-
2026-06-18days on market $185,000 Active 11 DOM
-
2026-06-17days on market $185,000 Active 10 DOM
-
2026-06-16days on market $185,000 Active 9 DOM
-
2026-06-15status $185,000 Active 8 DOM
-
2026-06-14statusdays on market $185,000 Pending 8 DOM
-
2026-06-10days on market $185,000 Active 7 DOM
-
2026-06-08days on market $185,000 Active 5 DOM
-
2026-06-07days on market $185,000 Active 4 DOM
-
2026-06-05remarks 654-char remark
-
2026-06-05$185,000 Active 1 DOM
ⓘ Source: listings_history table (triggers on properties + properties_extension) + one-shot
backfill from property_details.listing_events for pre-trigger history.
Tax reassessment forecast FL · Resets to sale price
- Current annual tax
- $806 · $67/mo
- Projected year-2 tax
- $1,536 · $128/mo
- Expected delta
- +$730/yr (+$61/mo · 90.6%)
ⓘ Screening estimate from a state-policy table — verify with the county assessor before closing.
Climate risk First Street
- Flood 1/10 Low FEMA zone X (unshaded) · 0% chance over 30 yrs
- Wildfire 4/10 Moderate
- Heat 10/10 Extreme 7 d/yr ≥108°F today · 23 d/yr by 30 yrs out
- Wind 10/10 Extreme 99% chance of damaging wind over 30 yrs
- Air quality 1/10 Low 0 unhealthy d/yr today · 0 by 30 yrs out
Nearby sold comps map
Loading sold comps map…
Walkable amenities ~0.75 mi
Loading nearby amenities…
Taxation est. · year 1
- Rental income
- $17,781
- − Mortgage interest
- −$10,363
- − Property taxes
- −$806
- − Insurance
- −$925
- − Repairs & maintenance
- −$1,422
- − Management
- −$1,422
- − HOA
- −$1,080
- − Depreciation
- −$5,382
- Taxable loss
- −$3,619
- Est. tax savings @ 24.0%
- +$869
- After-tax cash flow
- $463/yr
For passive investors: Depreciation is non-cash, so a rental often shows a tax loss while cash-flowing — sheltering income. Rental losses are passive: they offset passive income freely, and up to $25,000/yr can offset ordinary (W-2) income if you actively participate and your MAGI is under $100k (phasing out to $0 by $150k); unused losses carry forward. On sale, claimed depreciation is recaptured at up to 25%, and gains may owe capital-gains tax (a 1031 exchange can defer both). Figures are a year-1 estimate at your 24.0% rate — not tax advice; consult a CPA.
Schools (NCES district)
- District
- Brevard
- NCES district ID
- 1200150
- Math proficiency
- 53% ▼ -9.00%
- Reading proficiency
- 57% ▼ -4.00%
- Median HH income
- $49,426
- Composite
- 46.86/100
- National rank
- #2370
- State rank
- #19 of 73 in FL
Livability — Titusville
- Score
- 84/100
- State rank
- #42
- US rank
- #668
Category grades
Schools grade is shown separately in the Schools card above.
Census & demographics
- Census place
- Titusville, FL
- County
- Brevard County · 602,871 people
- City population
- 60,286
- Metro
- Palm Bay-Melbourne-Titusville, FL
- Population (ZIP)
- 40,064
- Household income
- $67,690
- Rent vs Own
- Severe rent burden
- 1141.0
Population outlook (Brevard County) Hauer SSP2
- Today (2025)
- 623,254 people
- By 2030
- 648,420 · +4.0%
- By 2040
- 690,009 · +10.7%
- By 2050
- 715,669 · +14.8%
- By 2075
- 775,744 · +24.5%
- By 2100
- 776,687 · +24.6%
Race, ethnicity, and origin ACS 2023
- Neighborhood character
- Predominantly White (70%)
- Race & ethnicity
- White 70% Black 13% Hispanic / Latino 8% Two or more races 8% Asian 3%
- Hispanic origin (detail)
- Mexican 1% Puerto Rican 4% Cuban 1%
- Common ancestry
- Romanian 2% Slovak 2% Lithuanian 2%
- Foreign-born
- 8% · Canada, China
- Languages at home
- 89% English-only · Spanish 6% Other Indo-European 1% German/W. Germanic 1%
Political lean MEDSL · Brevard
- 2024 margin
- Strong R (+20.8) · D 39.1% · R 59.9% · Other 1.0%
- 2008→2024 swing
- -10.4pp toward R · 2008: -10.4pp · 2024: -20.8pp
- All cycles
- 2024: R+20.8 2020: R+16.4 2016: R+19.8 2012: R+12.7 2008: R+10.4
Not yet ingested
- Civics
- —
Market trends
- HPI YoY
- ▼ -162.54%
- Current HPI
- 297.151
- Rent YoY
- ▲ 1.29%
- Metro
- Palm Bay-Melbourne-Titusville, FL
- State GDP YoY
- ▲ 3.28%
- F500 in state
- 36
Industry mix (Fortune 500 HQ in FL)
| Industry | F500 HQs | Revenue |
|---|---|---|
| Industrial Technology | 2 | $29B |
|
||
| Insurance | 2 | $17B |
|
||
| Retail | 1 | $60B |
|
||
| Technology Distribution | 1 | $58B |
|
||
| Homebuilding | 1 | $35B |
|
||
| Technology Manufacturing | 1 | $35B |
|
||
Price history
+413.9% since first listed18 events — show timeline
- 2026-06-04 Listed $185,000 SCMLS
- 2025-03-21 Sold (Public Records) $159,000 Public Records
- 2025-03-19 Sold (MLS) $159,000 SCMLS
- 2025-03-11 Pending — SCMLS
- 2025-02-21 Contingent — SCMLS
- 2025-02-14 Relisted — SCMLS
- 2025-02-12 Pending — SCMLS
- 2025-02-07 Listed $159,000 SCMLS
- 2018-10-17 Sold (Public Records) $82,000 Public Records
- 2018-10-12 Sold (MLS) $82,000 SCMLS
- 2018-08-17 Listed $80,000 SCMLS
- 2011-04-01 Sold (MLS) $36,500 SCMLS
- 2010-12-06 Listed $37,000 SCMLS
- 2006-03-14 Sold (Public Records) $122,000 Public Records
- 2006-03-10 Sold (MLS) $122,000 SCMLS
- 2005-11-01 Listed $132,000 SCMLS
- 1998-02-23 Sold (Public Records) $41,000 Public Records
- 1981-02-01 Sold (Public Records) $36,000 Public Records
Property tax history
-0.6%/yrLatest (2025): $806 · +4.0% YoY. Source: county tax records.
Cash-flow waterfall
monthlySold comps — $/sqft
last 12 mo · ≤1 miLoading sold comps…