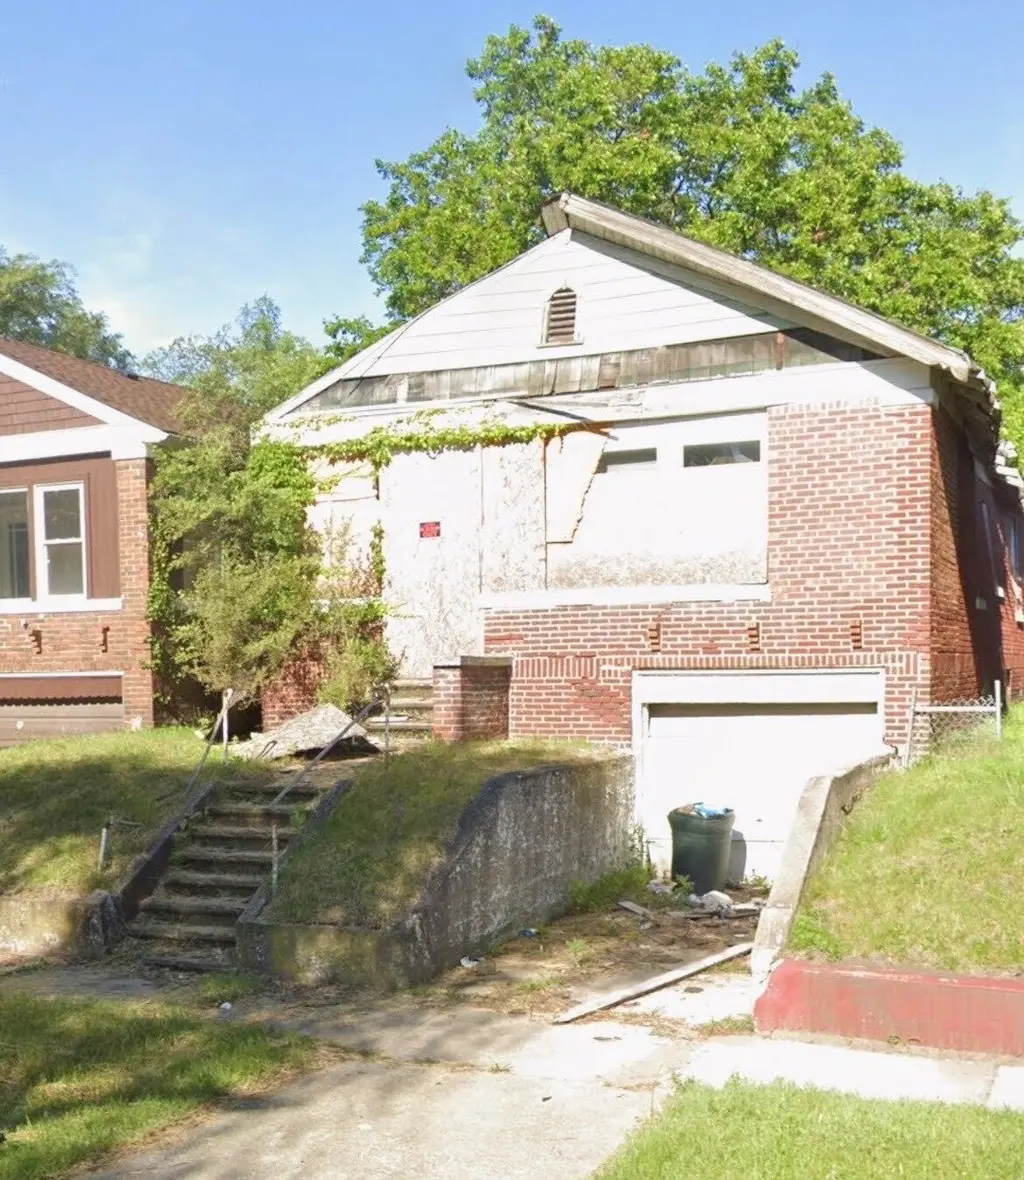
3838 Adams St · Gary, IN
Flood risk 1/10 · Minimal
- FEMA flood zone
- X (unshaded)
- Chance of flooding over 30 yrs
- 0.0%
- Est. flood insurance / yr
- $473 – $860
Fire risk 1/10 · Minimal
- Est. fire insurance / yr
- $717 – $1,331
Heat risk 3/10 · Minor
- Hot days now (above 102°F)
- 7 days/yr
- Hot days in 30 yrs
- 15 days/yr
Wind risk 2/10 · Minimal
- Chance of severe wind over 30 yrs
- 1.0%
Air-quality risk 3/10 · Minor
- Unhealthy air days now
- 2 days/yr
- Unhealthy air days in 30 yrs
- 3 days/yr
Risk factors via First Street. Map © Google.
Why this score? — see what drove the D grade
The composite is a weighted blend of 9 inputs, each scored 0–100. Each bar is that input's sub-score; the figure is the points it added to the 100-point composite (weight × sub-score).
- Cash flow +15.0/30.0
- ARV discount +7.5/15.0
- 1% rule +5.0/10.0
- DSCR +5.0/10.0
- Livability +3.7/5.0
- Rent growth +2.5/5.0
- Condition / age +2.5/5.0
- Schools +0.5/10.0
- Appreciation +0.0/10.0
$9,900
🖨 Deal sheet 📄 Offer letter ✓ Due diligence
Listing remarks MLS
GET STARTED! Calling All EXPERIENCED CONTRACTORS ! You will be done by Summer, to flip this one. Great Price, good location, for this Brick home, with an Abundance of potential. New investors this will suit your budget also. Located in Gary 's Historic West Side. The convenient access to Broadway, leading to the US 30 Corridor, providing a mecca of shopping and eateries. A major University blocks away . , New Hard Rock Casino , and Miller Beach for summer fun, Make your move. before it's gone.
Key facts
- Access to broadway
- Historic west side
- Us 30 corridor
Tags
Neighborhood map
What this means for you Summary
Snapshot
- This is a 2-bed/1.0-bath single-family listed at $10k.
Deal economics
- At list price, monthly cash flow is $877 ($11k/yr) — positive.
- The deal already cash-flows at list — no discount required.
- Meets the 1% rule at list price ($1k rent vs $10k).
- Recommended offer: $9k (9.0% below list) — sets the bar for market timing.
- Cap rate 112.6% vs local median 9.1% in Gary — top-decile yield for the area; either an underpriced asset or a hidden risk that comps aren't pricing in. Stress-test before assuming the spread holds.
Location & tenants
- Location reads 73/100 on livability (#105 in IN) — a middle-class / working-renter tenant base. Strengths: commute A+, cost of living A+, housing A+; Watch: schools F, crime F, employment F.
- Gary Community School Corporation (urban): math 3% / reading 11% proficiency, ranked #299 of 301 in IN (top 99%) — low school quality limits family demand, transient renter base, plan for 1-2y turnover; 80% free/reduced lunch — lower-income household profile, screen leases tightly.
- Market conditions: 102 active listings in the ZIP; 18 comparable units currently listed for rent nearby; rentals leasing fast (median 1d on market — plan ~1-2 weeks tenant-placement turnaround); 1,642 units permitted in Lake County in 2024 (14 in 5+ unit buildings).
- This rent runs 31% of the median local income ($47k/yr) — at the standard rent-burdened threshold; future hikes will face affordability resistance.
Forward outlook
- Local home prices are declining (-3.0%/yr); year-one equity from $68 of loan paydown is wiped out by about $297 of value loss. Plan a longer hold.
- Lake County population projected to shrink 7% by 2050 — rents likely to lag national; underwrite the cash flow, not the appreciation.
- At projected returns (-3.0% appreciation + 3.0% rent growth), your $3k cash investment doubles in ~1 year — after that, you're playing with house money.
Negotiation context
- It's been on market 94 days — a 9% lower offer ($9k) is reasonable based on typical stale-listing flexibility.
Risks & watch-outs
- Watch-outs: built in 1921 — expect roof / HVAC / electrical / plumbing capex.
Questions for the listing agent
- It's been on market 94 days. Have you received any prior offers? Is the seller open to a 9% concession, seller financing, or rate buy-down credit?
- Built in 1921 — when were the roof, HVAC, electrical panel, plumbing, and water heater last replaced?
- Why hasn't it sold? Are there any deal-killer items the seller is aware of (foundation, flood, title, zoning, code violations)?
- Is there a deadline driving the sale (1031 exchange, divorce, estate, relocation)? That informs how much negotiation room exists.
- Schools are F-rated, which usually means shorter tenancies and higher turnover. Who's the typical renter profile here, and what's been the actual vacancy rate?
- Crime grade is F in this area — have there been break-ins, vandalism, or insurance claims at this property in the last 3 years? What carrier currently insures it and at what premium?
- The area grade is low — what's the realistic commute time and amenity access for the typical tenant pool here? Any planned neighborhood developments (good or bad) we should know about?
- What's the average days-on-market for RENTAL listings here right now (not sales)? A rising rental-DOM trend means longer vacancies and softer asking-rent achievability than the comps imply.
- What's the recent tenant-quality profile in this submarket — average credit score on applications, eviction rate, late-payment / NSF rate, and stable-employment percentage? A property-management company in the area should have these aggregated.
- How much new for-sale + rental construction is in the pipeline within 1–3 miles? Heavy new supply typically softens prices + rents 12–24 months out; constrained supply supports both.
Investment metrics
- 1% rule
- 12.19% ✓
- Cap rate
- 112.63%
- Cash-on-cash
- 379.78%
- DSCR
- 17.90
- GRM
- 0.7
CMA / ARV
- ARV (median comp)
- $49,466
- List price
- $9,900
- Delta
- -79.99%
- Verdict
- UNDERPRICED
- Comps
- 20 within 1.0 mi
Show comp detail 12 sales within ~0.75 mi
| Address | Dist | Beds/Ba | Sqft | Sold | Price | $/sf | Match |
|---|---|---|---|---|---|---|---|
| 4016 Connecticut St | 0.34mi | 2/1.0 | 920 (-8%) | 4mo | $25,000 | $27 | 68 |
| 3540 Pennsylvania St | 0.48mi | 3/1.5 (+1) | 1,035 (+4%) | 3mo | $68,000 | $66 | 62 |
| 3980 Tyler St | 0.47mi | 3/1.0 (+1) | 1,042 (+5%) | 5mo | $128,000 | $123 | 61 |
| 4115 Fillmore St | 0.63mi | 2/1.0 | 950 (-4%) | 6mo | $51,000 | $54 | 58 |
| 4019 Pennsylvania St | 0.42mi | 2/— | 856 (-14%) | 4mo | $36,500 | $43 | 54 |
| 3724 Tyler St | 0.47mi | 2/1.0 | 870 (-13%) | 4mo | $48,000 | $55 | 54 |
| 3608 Virginia St | 0.57mi | 2/1.0 | 1,115 (+12%) | 1mo | $36,500 | $33 | 53 |
| 4181 Fillmore St | 0.68mi | 2/1.0 | 1,080 (+8%) | 3mo | $22,000 | $20 | 52 |
| 3737 Fillmore St | 0.56mi | 3/1.0 (+1) | 1,080 (+8%) | 5mo | $175,500 | $163 | 51 |
| 3679 Buchanan St | 0.69mi | 3/1.0 (+1) | 918 (-8%) | 0mo | $112,000 | $122 | 49 |
| 4217 Maryland St | 0.68mi | 2/1.0 | 864 (-13%) | 3mo | $49,900 | $58 | 44 |
| 3326 Delaware St | 0.74mi | 3/1.0 (+1) | 896 (-10%) | 1mo | $77,000 | $86 | 43 |
Match score weights: distance 35% · size 25% · config 20% · recency 20%. Top-matched comps best support the ARV.
Projected returns pro-forma
-3.0% appreciation · 3.0% rent growth · sell at horizon
- IRR
- —
- Equity multiple
- 20.59×
- Total profit
- $54,294
- Equity at exit
- $1,476
- IRR
- —
- Equity multiple
- 44.04×
- Total profit
- $119,320
- Equity at exit
- $856
Cash invested: $2,772 (down + closing). Projections, not guarantees.
Landlord ↔ Tenant lean methodology
- Overall (STATE)
- 90 Strongly Landlord-Friendly
- State Indiana
- 90 Strongly Landlord-Friendly · R+11
- County
- — inherits STATE
- City
- — inherits STATE
ZIP-level market 46408
- Home prices YoY
- -31.6%
- Active inventory
- 102
- Price-to-rent
- 0.7×
Monthly cashflow live
- Estimated rent
- $1,207 high interval (Pro) →
- Mortgage (P&I)
- −$52
- Tax from tax record
- −$20 /mo · $238/yr
- Insurance
- −$4
- HOA
- −$0
- Vacancy / Maint / Mgmt
- −$253
- Net cashflow
- $877
Break-even live
UW: 25.0% down · 7.5% · 30yr · 1.5% tax · 5.0% vac · 8.0% maint · 8.0% mgmt
Financing live
Cash to close
- Down payment
- $2,475
- Closing costs
- $297
- Reserves months
- —
- Total cash needed
- —
Loan-product check · same deal, 3 products live
Conventional
25% down · 7.5% · 30yr
- Down + closing
- —
- Monthly P&I
- —
- Monthly cashflow
- —
- DSCR
- —
- Eligible?
- —
Personal DTI + credit; lowest rate.
DSCR
20% down · 8.5% · 30yr
- Down + closing
- —
- Monthly P&I
- —
- Monthly cashflow
- —
- DSCR
- —
- Eligible?
- —
No personal income docs; deal must DSCR.
Hard money
10% down · 12.0% · 12mo
- Down + closing
- —
- Monthly P&I
- —
- Monthly cashflow
- —
- DSCR
- —
- Eligible?
- —
Short-term bridge; refi at stabilization.
Rent comps 18 comps
| Address | Beds | Baths | Sqft | Rent | $/sqft | DOM | Units | Dist |
|---|---|---|---|---|---|---|---|---|
| 3708 Harrison St Gary, IN | 3.0 | 1.5 | 904 | $1,400 | $1.55 | 2d | 1 | 0.41mi |
| 4018 Tyler St Gary, IN | 3.0 | 1.0 | 880 | $1,350 | $1.53 | 1d | 1 | 0.51mi |
| 4040 Fillmore St Gary, IN | 2.0 | 1.0 | 1000 | $1,000 | $1.00 | 10d | 1 | 0.63mi |
| 1005 W 35th Ave Apt 202 Gary, IN | 2.0 | 1.0 | 617 | $795 | $1.29 | 1d | 1 | 0.64mi |
| 1005 W 35th Ave Apt 105 Gary, IN | 2.0 | 1.0 | 601 | $795 | $1.32 | 18d | 1 | 0.64mi |
| 4327 Monroe St Unit 1st front Gary, IN | 1.0 | 1.0 | 600 | $1,095 | $1.82 | 1d | 1 | 0.65mi |
| 1015 W 35th Ave Apt 206 Gary, IN | 2.0 | 1.0 | 601 | $795 | $1.32 | 43d | 1 | 0.66mi |
| 4170 Fillmore St Gary, IN | 2.0 | 1.0 | 720 | $950 | $1.32 | 19d | 1 | 0.71mi |
| 3777 Lincoln St Gary, IN | 2.0 | 1.0 | 800 | $1,150 | $1.44 | 1d | 1 | 0.74mi |
| 816 E 35th Ct Gary, IN | 2.0 | 1.0 | 810 | $1,075 | $1.33 | 1d | 1 | 0.76mi |
| 624 W 44th Pl Gary, IN | 3.0 | 1.0 | 836 | $1,250 | $1.50 | 7d | 1 | 0.81mi |
| 4456 Connecticut St Gary, IN | 3.0 | 1.0 | 1044 | $1,300 | $1.25 | 3d | 1 | 0.83mi |
| 4364 Buchanan St Gary, IN | 3.0 | 1.0 | 900 | $1,500 | $1.67 | 1d | 1 | 0.97mi |
| 801 E 32nd Ave Unit 2 Gary, IN | 2.0 | 1.0 | 850 | $1,300 | $1.53 | 1d | 1 | 0.98mi |
| 4748 Monroe St Gary, IN | 3.0 | 1.0 | 1074 | $1,695 | $1.58 | 1d | 1 | 1.18mi |
| 4816 Massachusetts St Gary, IN | 3.0 | 1.0 | 1024 | $1,350 | $1.32 | 15d | 1 | 1.26mi |
| 837 W 27th Ave Unit B Gary, IN | 1.0 | 1.0 | 750 | $950 | $1.27 | 1d | 1 | 1.46mi |
| 837 W 27th Ave Unit A Gary, IN | 2.0 | 1.0 | 750 | $1,150 | $1.53 | 1d | 1 | 1.46mi |
Listing history 17 events
-
2026-06-18days on market $9,900 Active 94 DOM
-
2026-06-17days on market $9,900 Active 93 DOM
-
2026-06-16days on market $9,900 Active 92 DOM
-
2026-06-15days on market $9,900 Active 91 DOM
-
2026-06-13days on market $9,900 Active 89 DOM
-
2026-06-13days on market $9,900 Active 88 DOM
-
2026-06-09days on market $9,900 Active 85 DOM
-
2026-06-08pricedays on market $9,900 Active 84 DOM
-
2026-06-07days on market $11,500 Active 83 DOM
-
2026-06-04days on market $11,500 Active 80 DOM
-
2026-06-03days on market $11,500 Active 79 DOM
-
2026-06-02days on market $11,500 Active 78 DOM
-
2026-06-01days on market $11,500 Active 77 DOM
-
2026-05-31days on market $11,500 Active 76 DOM
-
2026-04-23price $13,000 501-char remark
Show marketing remark (501 chars)
GET STARTED! Calling All EXPERIENCED CONTRACTORS ! You will be done by Summer, to flip this one. Great Price, good location, for this Brick home, with an Abundance of potential. New investors this will suit your budget also. Located in Gary 's Historic West Side. The convenient access to Broadway, leading to the US 30 Corridor, providing a mecca of shopping and eateries. A major University blocks away . , New Hard Rock Casino , and Miller Beach for summer fun, Make your move. before it's gone.
-
2026-04-03price $15,000 501-char remark
Show marketing remark (501 chars)
GET STARTED! Calling All EXPERIENCED CONTRACTORS ! You will be done by Summer, to flip this one. Great Price, good location, for this Brick home, with an Abundance of potential. New investors this will suit your budget also. Located in Gary 's Historic West Side. The convenient access to Broadway, leading to the US 30 Corridor, providing a mecca of shopping and eateries. A major University blocks away . , New Hard Rock Casino , and Miller Beach for summer fun, Make your move. before it's gone.
-
2026-03-16$19,000 Active 501-char remark
Show marketing remark (501 chars)
GET STARTED! Calling All EXPERIENCED CONTRACTORS ! You will be done by Summer, to flip this one. Great Price, good location, for this Brick home, with an Abundance of potential. New investors this will suit your budget also. Located in Gary 's Historic West Side. The convenient access to Broadway, leading to the US 30 Corridor, providing a mecca of shopping and eateries. A major University blocks away . , New Hard Rock Casino , and Miller Beach for summer fun, Make your move. before it's gone.
ⓘ Source: listings_history table (triggers on properties + properties_extension) + one-shot
backfill from property_details.listing_events for pre-trigger history.
Tax reassessment forecast IN · Partial reset (capped growth)
- Current annual tax
- $238 · $20/mo
- Projected year-2 tax
- $238 · $20/mo
- Expected delta
- $0/yr ($0/mo · 0.0%)
ⓘ Screening estimate from a state-policy table — verify with the county assessor before closing.
Climate risk First Street
- Flood 1/10 Low FEMA zone X (unshaded) · 0% chance over 30 yrs
- Wildfire 1/10 Low
- Heat 3/10 Moderate 7 d/yr ≥102°F today · 15 d/yr by 30 yrs out
- Wind 2/10 Low 100% chance of damaging wind over 30 yrs
- Air quality 3/10 Moderate 2 unhealthy d/yr today · 3 by 30 yrs out
Nearby sold comps map
Loading sold comps map…
Walkable amenities ~0.75 mi
Loading nearby amenities…
Taxation est. · year 1
- Rental income
- $14,479
- − Mortgage interest
- −$555
- − Property taxes
- −$238
- − Insurance
- −$50
- − Repairs & maintenance
- −$1,158
- − Management
- −$1,158
- − Depreciation
- −$288
- Taxable income
- $11,032
- Est. tax owed @ 24.0%
- −$2,648
- After-tax cash flow
- $7,880/yr
For passive investors: Depreciation is non-cash, so a rental often shows a tax loss while cash-flowing — sheltering income. Rental losses are passive: they offset passive income freely, and up to $25,000/yr can offset ordinary (W-2) income if you actively participate and your MAGI is under $100k (phasing out to $0 by $150k); unused losses carry forward. On sale, claimed depreciation is recaptured at up to 25%, and gains may owe capital-gains tax (a 1031 exchange can defer both). Figures are a year-1 estimate at your 24.0% rate — not tax advice; consult a CPA.
Schools (NCES district)
- District
- Gary Community School Corporation
- NCES district ID
- 1803870
- Math proficiency
- 3% ▼ -10.00%
- Reading proficiency
- 11% ▼ -6.00%
- Median HH income
- $27,739
- Composite
- 4.98/100
- National rank
- #10039
- State rank
- #299 of 301 in IN
Livability — Gary
- Score
- 73/100
- State rank
- #105
- US rank
- #5592
Category grades
Schools grade is shown separately in the Schools card above.
Census & demographics
- Census place
- Gary, IN
- County
- Lake County · 422,878 people
- City population
- 63,701
- Metro
- Chicago-Naperville-Elgin, IL-IN-WI
- Population (ZIP)
- 15,747
- Household income
- $47,453
- Rent vs Own
- Severe rent burden
- 619.0
Population outlook (Lake County) Hauer SSP2
- Today (2025)
- 484,026 people
- By 2030
- 478,091 · -1.2%
- By 2040
- 462,974 · -4.3%
- By 2050
- 449,894 · -7.1%
- By 2075
- 436,169 · -9.9%
- By 2100
- 426,607 · -11.9%
Race, ethnicity, and origin ACS 2023
- Neighborhood character
- Diverse neighborhood (Simpson 0.68)
- Race & ethnicity
- Black 41% White 32% Hispanic / Latino 22% Two or more races 12%
- Hispanic origin (detail)
- Mexican 14% Puerto Rican 7%
- Common ancestry
- Romanian 5% Iranian 1% Slovak 1%
- Foreign-born
- 4% · Canada, China
- Languages at home
- 87% English-only · Spanish 12% Chinese 1%
Political lean MEDSL · Lake
- 2024 margin
- Lean D (+5.6) · D 52.1% · R 46.5% · Other 1.5%
- 2008→2024 swing
- -28.6pp toward R · 2008: 34.3pp · 2024: 5.6pp
- All cycles
- 2024: D+5.6 2020: D+15.1 2016: D+20.6 2012: D+31.0 2008: D+34.3
Not yet ingested
- Civics
- —
Market trends
- HPI YoY
- ▼ -72.08%
- Current HPI
- 155.6238
- Rent YoY
- —
- Metro
- Chicago-Naperville-Elgin, IL-IN-WI
- State GDP YoY
- ▲ 2.90%
- F500 in state
- 18
Industry mix (Fortune 500 HQ in IN)
| Industry | F500 HQs | Revenue |
|---|---|---|
| Industrial Machinery | 2 | $37B |
|
||
| Healthcare | 1 | $177B |
|
||
| Pharmaceuticals | 1 | $45B |
|
||
| Metals / Steel | 1 | $18B |
|
||
| Agriculture | 1 | $17B |
|
||
| Packaging | 1 | $12B |
|
||
Price history
-31.6% since first listed3 events — show timeline
- 2026-04-23 Price Changed $13,000 NIRA MLS as Distributed by MLS Grid
- 2026-04-03 Price Changed $15,000 NIRA MLS as Distributed by MLS Grid
- 2026-03-16 Listed $19,000 NIRA MLS as Distributed by MLS Grid
Property tax history
-14.2%/yrLatest (2024): $238 · +3.9% YoY. Source: county tax records.
Cash-flow waterfall
monthlySold comps — $/sqft
last 12 mo · ≤1 miLoading sold comps…