124 Starpacker Ln · Sonterra, TX
Flood risk No data
- FEMA flood zone
- —
- Chance of flooding over 30 yrs
- —
- Est. flood insurance / yr
- —
Fire risk No data
- Est. fire insurance / yr
- —
Heat risk No data
- Hot days now (above threshold)
- —
- Hot days in 30 yrs
- —
Wind risk No data
- Chance of severe wind over 30 yrs
- —
Air-quality risk No data
- Unhealthy air days now
- —
- Unhealthy air days in 30 yrs
- —
Risk factors via First Street. Map © Google.
Why this score? — see what drove the D+ grade
The composite is a weighted blend of 9 inputs, each scored 0–100. Each bar is that input's sub-score; the figure is the points it added to the 100-point composite (weight × sub-score).
- Cash flow +17.7/30.0
- ARV discount +11.1/15.0
- DSCR +5.5/10.0
- 1% rule +4.1/10.0
- Livability +2.5/5.0
- Condition / age +2.5/5.0
- Rent growth +2.1/5.0
- Schools +2.1/10.0
- Appreciation +0.0/10.0
$209,999
🖨 Deal sheet 📄 Offer letter ✓ Due diligence
Listing remarks MLS
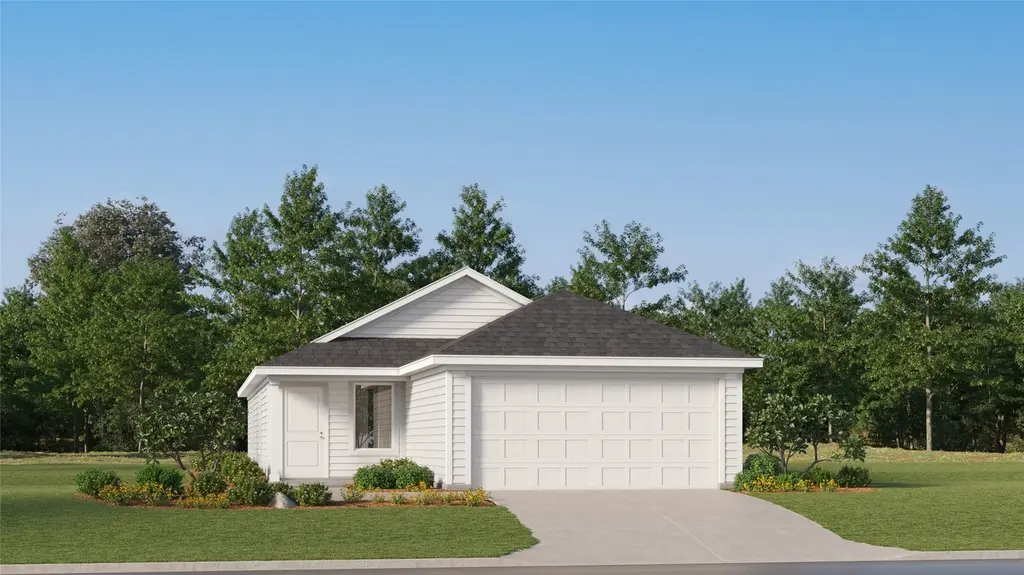
The Idlewood - This single-level home showcases a spacious open floorplan shared between the kitchen, dining area and family room for easy entertaining, along with access to an outdoor space. An owner’s suite enjoys a private location in a rear corner of the home, complemented by an en-suite bathroom and walk-in closet. There are two secondary bedrooms at the front of the home, ideal for household members and overnight guests. Photos are for illustrative purposes only. Estimated Completion June 2026. The completion date, prices and features may vary and are subject to change. Please verify with Lennar directly.
Key facts
- Walk-in closet
- Open floorplan
- Secondary bedrooms
Tags
Neighborhood map
What this means for you Summary
Snapshot
- This is a 3-bed/2.0-bath other listed at $210k.
Deal economics
- At list price, monthly cash flow is $170 ($2k/yr) — positive.
- The deal already cash-flows at list — no discount required.
- To meet the 1% rule (rent ≥ 1% of price), the offer needs to be $190k (9.3% below list).
- Recommended offer: $190k (9.3% below list) — sets the bar for 1% rule.
- Cap rate 7.3% vs local median 4.5% in Sonterra — top-decile yield for the area; either an underpriced asset or a hidden risk that comps aren't pricing in. Stress-test before assuming the spread holds.
Location & tenants
- Location reads: area grade D — affects rentability + tenant quality, not the cash-flow math above.
- Jarrell ISD (rural): math 19% / reading 28% proficiency, ranked #713 of 826 in TX (top 86%) — low school quality limits family demand, transient renter base, plan for 1-2y turnover.
- Market conditions: Rents soft (-1.7%/yr); 761 active listings in the ZIP; 24 comparable units currently listed for rent nearby; rentals at typical pace (median 18d on market — plan ~3-4 weeks tenant-placement turnaround); solid renter incomes; 7,543 units permitted in Williamson County in 2024 (1,425 in 5+ unit buildings).
Forward outlook
- Local home prices are declining (-3.0%/yr); year-one equity from $1k of loan paydown is wiped out by about $6k of value loss. Plan a longer hold.
- Williamson County population projected at +69% by 2050 — long-run rental-demand tailwind backs the buy-and-hold thesis.
Negotiation context
- It's been on market 44 days — a 3% lower offer ($204k) is reasonable based on typical stale-listing flexibility.
Questions for the listing agent
- It's been on market 44 days. Have you received any prior offers? Is the seller open to a 9% concession, seller financing, or rate buy-down credit?
- What does the HOA fee cover, when was the last increase, and are there any pending special assessments or reserve-fund shortfalls?
- Is there a deadline driving the sale (1031 exchange, divorce, estate, relocation)? That informs how much negotiation room exists.
- The area grade is low — what's the realistic commute time and amenity access for the typical tenant pool here? Any planned neighborhood developments (good or bad) we should know about?
- What's the average days-on-market for RENTAL listings here right now (not sales)? A rising rental-DOM trend means longer vacancies and softer asking-rent achievability than the comps imply.
- What's the recent tenant-quality profile in this submarket — average credit score on applications, eviction rate, late-payment / NSF rate, and stable-employment percentage? A property-management company in the area should have these aggregated.
- How much new for-sale + rental construction is in the pipeline within 1–3 miles? Heavy new supply typically softens prices + rents 12–24 months out; constrained supply supports both.
Investment metrics
- 1% rule
- 0.91% ✗
- Cap rate
- 7.27%
- Cash-on-cash
- 3.48%
- DSCR
- 1.15
- GRM
- 9.2
CMA / ARV
- ARV (median comp)
- $228,490
- List price
- $209,999
- Delta
- -8.09%
- Verdict
- FAIR
- Comps
- 20 within 1.0 mi
Projected returns pro-forma
-3.0% appreciation · 0.0% rent growth · sell at horizon
- IRR
- -14.0%
- Equity multiple
- 0.51×
- Total profit
- $-28,808
- Equity at exit
- $31,312
- IRR
- -10.5%
- Equity multiple
- 0.44×
- Total profit
- $-32,865
- Equity at exit
- $18,157
Cash invested: $58,800 (down + closing). Projections, not guarantees.
Landlord ↔ Tenant lean methodology
- Overall (STATE)
- 87 Strongly Landlord-Friendly
- State Texas
- 87 Strongly Landlord-Friendly · R+5
- County
- — inherits STATE
- City
- — inherits STATE
ZIP-level market 76537
- Home prices YoY
- -14.4%
- Rents YoY
- -1.7%
- Active inventory
- 761
- Price-to-rent
- 9.2×
Monthly cashflow live
- Estimated rent
- $1,905 high interval (Pro) →
- Mortgage (P&I)
- −$1,101
- Tax from tax record
- −$121 /mo · $1,447/yr
- Insurance
- −$87
- HOA
- −$25
- Vacancy / Maint / Mgmt
- −$400
- Net cashflow
- $170
Break-even live
UW: 25.0% down · 7.5% · 30yr · 1.5% tax · 5.0% vac · 8.0% maint · 8.0% mgmt
Financing live
Cash to close
- Down payment
- $52,500
- Closing costs
- $6,300
- Reserves months
- —
- Total cash needed
- —
Loan-product check · same deal, 3 products live
Conventional
25% down · 7.5% · 30yr
- Down + closing
- —
- Monthly P&I
- —
- Monthly cashflow
- —
- DSCR
- —
- Eligible?
- —
Personal DTI + credit; lowest rate.
DSCR
20% down · 8.5% · 30yr
- Down + closing
- —
- Monthly P&I
- —
- Monthly cashflow
- —
- DSCR
- —
- Eligible?
- —
No personal income docs; deal must DSCR.
Hard money
10% down · 12.0% · 12mo
- Down + closing
- —
- Monthly P&I
- —
- Monthly cashflow
- —
- DSCR
- —
- Eligible?
- —
Short-term bridge; refi at stabilization.
Rent comps 24 comps
| Address | Beds | Baths | Sqft | Rent | $/sqft | DOM | Units | Dist |
|---|---|---|---|---|---|---|---|---|
| 360 Brannigan Dr Jarrell, TX | 3.0 | 2.0 | 1409 | $1,700 | $1.21 | 1d | 1 | 0.10mi |
| 201 Fighting Seabees Run Jarrell, TX | 4.0 | 2.0 | 1667 | $1,900 | $1.14 | 7d | 1 | 0.13mi |
| 104 Fighting Seabees Run Unit NA Jarrell, TX | 2.0 | 1.0 | 900 | $1,500 | $1.67 | 2d | 1 | 0.15mi |
| 313 McLintock Rd Jarrell, TX | 4.0 | 2.0 | 1855 | $2,000 | $1.08 | 2d | 1 | 0.19mi |
| 221 Barbary Coast Ln Jarrell, TX | 3.0 | 2.0 | 1450 | $1,750 | $1.21 | 1d | 1 | 0.23mi |
| 105 McLintock Rd Jarrell, TX | 3.0–5.0 | 2.0–3.5 | 1773 | $2,055 | $1.16 | 1d | 1 | 0.24mi |
| 121 Old Stagecoach Rd Jarrell, TX | 4.0 | 2.0 | 1531 | $1,800 | $1.18 | 43d | 1 | 0.25mi |
| 120 Morrison Dr Jarrell, TX | 3.0 | 2.0 | 1580 | $2,210 | $1.40 | 16d | 1 | 0.28mi |
| 252 Wild Wind Trl Jarrell, TX | 3.0 | 2.0 | 1243 | $1,650 | $1.33 | 17d | 1 | 0.83mi |
| 107 Wild Wind Cv Jarrell, TX | 3.0 | 2.0 | 1214 | $1,700 | $1.40 | 43d | 1 | 0.85mi |
| 154 Hammond Jarrell, TX | 3.0 | 2.0 | 1500 | $1,900 | $1.27 | 3d | 1 | 0.95mi |
| 112 Ragnar Jarrell, TX | 3.0 | 2.0 | 1251 | $1,495 | $1.20 | 19d | 1 | 0.98mi |
| 112 Ragnar Jarrell, TX | 3.0 | 2.0 | 1251 | $1,495 | $1.20 | 16d | 1 | 0.98mi |
| 104 Hellfighters Way Jarrell, TX | 3.0 | 2.5 | 1619 | $2,000 | $1.24 | 43d | 1 | 1.07mi |
| 449 Stone Water Ln Jarrell, TX | 3.0 | 2.5 | 1674 | $1,900 | $1.14 | 43d | 1 | 1.12mi |
| 241 Alcatraz Loop Jarrell, TX | 3.0 | 2.0 | 1288 | $1,895 | $1.47 | 17d | 1 | 1.30mi |
| 621 Xanadu Dr Jarrell, TX | 3.0 | 2.0 | 1586 | $1,750 | $1.10 | 4d | 1 | 1.31mi |
| 504 Wyatt Way Jarrell, TX | 4.0 | 2.0 | 1612 | $1,895 | $1.18 | 17d | 1 | 1.41mi |
| 137 Kellys Heroes Way Jarrell, TX | 3.0 | 2.0 | 1214 | $1,695 | $1.40 | 43d | 1 | 1.42mi |
| 508 Wyatt Way Jarrell, TX | 3.0 | 2.0 | 1500 | $1,800 | $1.20 | 43d | 1 | 1.42mi |
| 125 Kellys Heroes Way Jarrell, TX | 3.0 | 2.0 | 1641 | $1,650 | $1.01 | 43d | 1 | 1.42mi |
| 149 Vulcan Dr Jarrell, TX | 3.0 | 2.0 | 1450 | $1,799 | $1.24 | 23d | 1 | 1.45mi |
| 600 Shimek St Unit 19A Jarrell, TX | 3.0 | 2.0 | 1357 | $1,650 | $1.22 | 17d | 1 | 1.46mi |
| 117 Galaxy Way Jarrell, TX | 3.0 | 2.0 | 1276 | $1,650 | $1.29 | 20d | 1 | 1.48mi |
HOA detail
- Monthly dues
- $25 · $300/yr
Listing history 10 events
-
2026-06-07status $209,999 Pending 44 DOM
-
2026-06-04days on market $209,999 Active 44 DOM
-
2026-06-03days on market $209,999 Active 43 DOM
-
2026-06-02days on market $209,999 Active 42 DOM
-
2026-06-01days on market $209,999 Active 41 DOM
-
2026-05-31days on market $209,999 Active 40 DOM
-
2026-05-14price $212,999 624-char remark
Show marketing remark (624 chars)
The Idlewood - This single-level home showcases a spacious open floorplan shared between the kitchen, dining area and family room for easy entertaining, along with access to an outdoor space. An owner’s suite enjoys a private location in a rear corner of the home, complemented by an en-suite bathroom and walk-in closet. There are two secondary bedrooms at the front of the home, ideal for household members and overnight guests. Photos are for illustrative purposes only. Estimated Completion June 2026. The completion date, prices and features may vary and are subject to change. Please verify with Lennar directly.
-
2026-05-11price $215,999 624-char remark
Show marketing remark (624 chars)
The Idlewood - This single-level home showcases a spacious open floorplan shared between the kitchen, dining area and family room for easy entertaining, along with access to an outdoor space. An owner’s suite enjoys a private location in a rear corner of the home, complemented by an en-suite bathroom and walk-in closet. There are two secondary bedrooms at the front of the home, ideal for household members and overnight guests. Photos are for illustrative purposes only. Estimated Completion June 2026. The completion date, prices and features may vary and are subject to change. Please verify with Lennar directly.
-
2026-04-30price $218,999 624-char remark
Show marketing remark (624 chars)
The Idlewood - This single-level home showcases a spacious open floorplan shared between the kitchen, dining area and family room for easy entertaining, along with access to an outdoor space. An owner’s suite enjoys a private location in a rear corner of the home, complemented by an en-suite bathroom and walk-in closet. There are two secondary bedrooms at the front of the home, ideal for household members and overnight guests. Photos are for illustrative purposes only. Estimated Completion June 2026. The completion date, prices and features may vary and are subject to change. Please verify with Lennar directly.
-
2026-04-21$238,999 Active 624-char remark
Show marketing remark (624 chars)
The Idlewood - This single-level home showcases a spacious open floorplan shared between the kitchen, dining area and family room for easy entertaining, along with access to an outdoor space. An owner’s suite enjoys a private location in a rear corner of the home, complemented by an en-suite bathroom and walk-in closet. There are two secondary bedrooms at the front of the home, ideal for household members and overnight guests. Photos are for illustrative purposes only. Estimated Completion June 2026. The completion date, prices and features may vary and are subject to change. Please verify with Lennar directly.
ⓘ Source: listings_history table (triggers on properties + properties_extension) + one-shot
backfill from property_details.listing_events for pre-trigger history.
Tax reassessment forecast TX · Resets to sale price
- Current annual tax
- $1,447 · $121/mo
- Projected year-2 tax
- $3,843 · $320/mo
- Expected delta
- +$2,396/yr (+$200/mo · 165.6%)
ⓘ Screening estimate from a state-policy table — verify with the county assessor before closing.
Nearby sold comps map
Loading sold comps map…
Walkable amenities ~0.75 mi
Loading nearby amenities…
Taxation est. · year 1
- Rental income
- $22,855
- − Mortgage interest
- −$11,763
- − Property taxes
- −$1,447
- − Insurance
- −$1,050
- − Repairs & maintenance
- −$1,828
- − Management
- −$1,828
- − HOA
- −$300
- − Depreciation
- −$6,109
- Taxable loss
- −$1,471
- Est. tax savings @ 24.0%
- +$353
- After-tax cash flow
- $2,397/yr
For passive investors: Depreciation is non-cash, so a rental often shows a tax loss while cash-flowing — sheltering income. Rental losses are passive: they offset passive income freely, and up to $25,000/yr can offset ordinary (W-2) income if you actively participate and your MAGI is under $100k (phasing out to $0 by $150k); unused losses carry forward. On sale, claimed depreciation is recaptured at up to 25%, and gains may owe capital-gains tax (a 1031 exchange can defer both). Figures are a year-1 estimate at your 24.0% rate — not tax advice; consult a CPA.
Schools (NCES district)
- District
- Jarrell ISD
- NCES district ID
- 4824600
- Math proficiency
- 19% ▼ -18.00%
- Reading proficiency
- 28% ▼ -5.00%
- Median HH income
- $57,132
- Composite
- 21.47/100
- National rank
- #8335
- State rank
- #713 of 826 in TX
Livability — Sonterra
No livability data for this city. (Only ~50 U.S. cities are tracked.)
Census & demographics
- County
- Williamson County · 680,029 people
- City population
- 12,526
- Metro
- Austin-Round Rock-Georgetown, TX
- Population (ZIP)
- 16,272
- Household income
- $98,199
- Rent vs Own
- Severe rent burden
- 225.0
Population outlook (Williamson County) Hauer SSP2
- Today (2025)
- 699,027 people
- By 2030
- 795,537 · +13.8%
- By 2040
- 990,683 · +41.7%
- By 2050
- 1,184,292 · +69.4%
- By 2075
- 1,623,825 · +132.3%
- By 2100
- 1,924,153 · +175.3%
Race, ethnicity, and origin ACS 2023
- Neighborhood character
- Diverse neighborhood (Simpson 0.63)
- Race & ethnicity
- White 48% Hispanic / Latino 36% Two or more races 14% Black 7% Asian 4%
- Hispanic origin (detail)
- Mexican 30% Puerto Rican 5%
- Common ancestry
- Romanian 3% Italian 2% Slovak 1%
- Foreign-born
- 13% · Canada, Vietnam
- Languages at home
- 69% English-only · Spanish 26% Chinese 2% French/Haitian/Cajun 1%
Political lean MEDSL · Williamson
- 2024 margin
- Toss-up / Even · D 48.0% · R 50.4% · Other 1.6%
- 2008→2024 swing
- +10.6pp toward D · 2008: -13.0pp · 2024: -2.5pp
- All cycles
- 2024: R+2.5 2020: D+1.4 2016: R+9.9 2012: R+21.5 2008: R+13.0
Not yet ingested
- Civics
- —
Market trends
- HPI YoY
- ▼ -31.03%
- Current HPI
- 184.8935
- Rent YoY
- ▼ -1.73%
- Metro
- Austin-Round Rock-Georgetown, TX
- State GDP YoY
- ▲ 3.95%
- F500 in state
- 110
Industry mix (Fortune 500 HQ in TX)
| Industry | F500 HQs | Revenue |
|---|---|---|
| Energy | 16 | $1,198B |
|
||
| Technology | 5 | $198B |
|
||
| Engineering / Construction | 4 | $72B |
|
||
| Energy Services | 3 | $60B |
|
||
| Utilities | 3 | $41B |
|
||
| Healthcare | 2 | $330B |
|
||
Price history
-10.9% since first listed4 events — show timeline
- 2026-05-14 Price Changed $212,999 Unlock MLS
- 2026-05-11 Price Changed $215,999 Unlock MLS
- 2026-04-30 Price Changed $218,999 Unlock MLS
- 2026-04-21 Listed $238,999 Unlock MLS
Property tax history
-15.4%/yrLatest (2026): $1,447 · -15.4% YoY. Source: county tax records.
Cash-flow waterfall
monthlySold comps — $/sqft
last 12 mo · ≤1 miLoading sold comps…