3547 Horner Dr · Indianapolis city (balance), IN
Flood risk 1/10 · Minimal
- FEMA flood zone
- X (unshaded)
- Chance of flooding over 30 yrs
- 0.0%
- Est. flood insurance / yr
- $507 – $1,088
Fire risk 1/10 · Minimal
- Est. fire insurance / yr
- $717 – $1,331
Heat risk 3/10 · Minor
- Hot days now (above 102°F)
- 7 days/yr
- Hot days in 30 yrs
- 19 days/yr
Wind risk 2/10 · Minimal
- Chance of severe wind over 30 yrs
- 1.0%
Air-quality risk 2/10 · Minimal
- Unhealthy air days now
- 1 days/yr
- Unhealthy air days in 30 yrs
- 2 days/yr
Risk factors via First Street. Map © Google.
Why this score? — see what drove the D+ grade
The composite is a weighted blend of 9 inputs, each scored 0–100. Each bar is that input's sub-score; the figure is the points it added to the 100-point composite (weight × sub-score).
- Cash flow +14.8/30.0
- ARV discount +9.8/15.0
- DSCR +4.5/10.0
- Rent growth +4.0/5.0
- Schools +4.0/10.0
- 1% rule +3.6/10.0
- Livability +2.5/5.0
- Condition / age +2.5/5.0
- Appreciation +0.0/10.0
$229,000
🖨 Deal sheet (PDF) 📄 Offer letter ✓ Due diligence
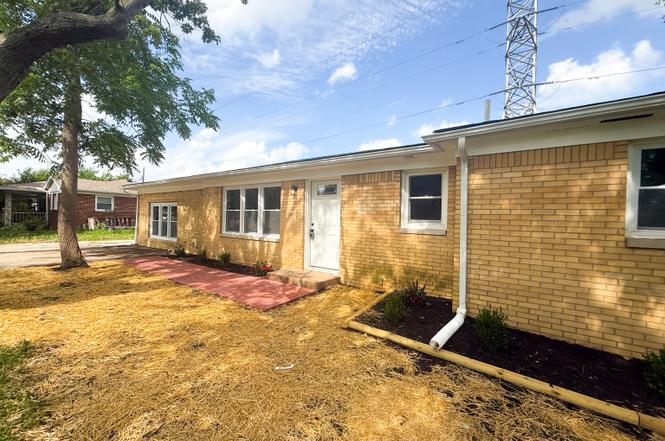
Listing remarks
Welcome home to 3547 Horner Drive! This beautifully renovated 3-bedroom, 2-bathroom home blends modern luxury with everyday comfort. Step inside and be greeted by stylish updates throughout, featuring contemporary finishes, upgraded fixtures, and a fresh, move-in-ready design. The spacious family room provides the perfect setting for entertaining guests, hosting family gatherings, or simply relaxing after a long day. The thoughtfully updated interior offers both functionality and elegance, creating a warm and inviting atmosphere in every room. Situated in a desirable Indianapolis location, this home combines convenience, comfort, and exceptional value. Whether you're a first-time buyer, gro
Key facts
- 0.39 acre lot
- Built 1959
- Listed 8 days
Property features AI
Exterior
- Utilities: Private water; Septic system; Municipal solid waste service
- Home design: Single-family residence; One story
- Construction: Vinyl with brick exterior; Crawl space foundation
- Exterior features: Approximately 0.39-acre lot (about 1/4–1/2 acre)
Interior
- Kitchen: Dishwasher; Microwave; Electric oven; Refrigerator
- Bedrooms: Three bedrooms on the main level (approx. 12 x 10, 12 x 10, 14 x 12)
- Bathrooms: Two full bathrooms (both on the main level)
- Heating & cooling: Forced air heating; Central air conditioning
- Interior features: Attic access; Living room (20 x 18)
Neighborhood map
What this means for you Summary
Snapshot
- This is a 3-bed/1.5-bath single-family listed at $229k.
Deal economics
- At list price, monthly cash flow is $61 ($735/yr) — positive.
- The deal already cash-flows at list — no discount required.
- To meet the 1% rule (rent ≥ 1% of price), the offer needs to be $197k (13.8% below list).
- Recommended offer: $197k (13.8% below list) — sets the bar for 1% rule.
- Cap rate 6.6% vs local median 4.4% in Indianapolis city (balance) — top-decile yield for the area; either an underpriced asset or a hidden risk that comps aren't pricing in. Stress-test before assuming the spread holds.
Location & tenants
- Location reads: area grade D — affects rentability + tenant quality, not the cash-flow math above.
- Franklin Township Community School Corporation (urban): math 42% / reading 47% proficiency, ranked #87 of 301 in IN (top 29%) — families likely to look elsewhere, expect single-tenant / working-renter base with shorter leases.
- Zoned schools: Franklin Central Junior High (math 31% / reading 40%, grade F, #162 of 330 statewide, top 49%, 1,711 students, 51% FRL); Franklin Central High School (math 41% / reading 69%, grade C, #77 of 369 statewide, top 21%, 3,319 students, 46% FRL) — zoned schools average 48% FRL vs 29% district-wide (20 pts higher); higher-poverty schools than district average — tighter screening recommended.
- Market conditions: Rents rising fast (+6.1%/yr); 337 active listings in the ZIP; 16 comparable units currently listed for rent nearby; rentals leasing fast (median 10d on market — plan ~1-2 weeks tenant-placement turnaround); solid renter incomes; 1,906 units permitted in Marion County in 2024 (621 in 5+ unit buildings).
Forward outlook
- Local home prices are declining (-3.0%/yr); year-one equity from $2k of loan paydown is wiped out by about $7k of value loss. Plan a longer hold.
- Marion County population projected at +18% by 2050 — long-run rental-demand tailwind backs the buy-and-hold thesis.
Negotiation context
- Only 8 days on market — expect competitive offers; lowballing is unlikely to land.
- Current owner paid $53k; list at $229k implies a 332% gain — meaningful room to come down on a strong offer.
Risks & watch-outs
- Watch-outs: built in 1959 — expect roof / HVAC / electrical / plumbing capex.
Questions for the listing agent
- Built in 1959 — when were the roof, HVAC, electrical panel, plumbing, and water heater last replaced?
- Is there a deadline driving the sale (1031 exchange, divorce, estate, relocation)? That informs how much negotiation room exists.
- The area grade is low — what's the realistic commute time and amenity access for the typical tenant pool here? Any planned neighborhood developments (good or bad) we should know about?
- What's the average days-on-market for RENTAL listings here right now (not sales)? A rising rental-DOM trend means longer vacancies and softer asking-rent achievability than the comps imply.
- What's the recent tenant-quality profile in this submarket — average credit score on applications, eviction rate, late-payment / NSF rate, and stable-employment percentage? A property-management company in the area should have these aggregated.
- How much new for-sale + rental construction is in the pipeline within 1–3 miles? Heavy new supply typically softens prices + rents 12–24 months out; constrained supply supports both.
Investment metrics
- 1% rule
- 0.86% ✗
- Cap rate
- 6.61%
- Cash-on-cash
- 1.15%
- DSCR
- 1.05
- GRM
- 9.7
CMA / ARV
- ARV (on-the-fly)
- $241,231
- Comps found
- 12
Show comp detail 12 sales within ~0.75 mi
| Address | Dist | Beds/Ba | Sqft | Sold | Price | $/sf | Match |
|---|---|---|---|---|---|---|---|
| 3538 Fisher Rd | 0.14mi | 3/1.0 | 1,515 (-6%) | 1mo | $200,000 | $132 | 80 |
| 3923 Wildwood Dr | 0.42mi | 3/1.5 | 1,625 (+0%) | 2mo | $235,000 | $145 | 78 |
| 3442 Cork Bend Dr | 0.32mi | 3/2.0 | 1,502 (-7%) | 4mo | $225,000 | $150 | 68 |
| 3456 S Sadlier Dr S | 0.25mi | 4/2.0 (+1) | 1,730 (+7%) | 7mo | $250,000 | $145 | 64 |
| 3139 S Hartman Dr | 0.51mi | 4/2.0 (+1) | 1,594 (-2%) | 6mo | $244,000 | $153 | 62 |
| 3422 Brandenburg Blvd | 0.30mi | 3/2.5 | 1,792 (+11%) | 7mo | $210,000 | $117 | 59 |
| 8052 Grove Berry Dr | 0.56mi | 4/2.5 (+1) | 1,603 (-1%) | 6mo | $249,000 | $155 | 58 |
| 3638 Laurel Cherry Ln | 0.48mi | 3/2.0 | 1,422 (-12%) | 2mo | $225,000 | $158 | 53 |
| 3060 S Shortridge Rd | 0.66mi | 3/1.0 | 1,464 (-10%) | 0mo | $218,000 | $149 | 51 |
| 8304 Weathervane Cir | 0.68mi | 3/2.0 | 1,516 (-6%) | 6mo | $209,000 | $138 | 51 |
| 8036 States Bend Dr | 0.55mi | 3/2.5 | 1,494 (-8%) | 8mo | $210,000 | $141 | 50 |
| 3053 Black Forest Ln | 0.57mi | 4/2.5 (+1) | 1,516 (-6%) | 6mo | $235,000 | $155 | 48 |
Match score weights: distance 35% · size 25% · config 20% · recency 20%. Top-matched comps best support the ARV.
Projected returns pro-forma
-3.0% appreciation · 6.11% rent growth · sell at horizon
- IRR
- -11.2%
- Equity multiple
- 0.58×
- Total profit
- $-26,861
- Equity at exit
- $34,145
- IRR
- 1.8%
- Equity multiple
- 1.15×
- Total profit
- $9,397
- Equity at exit
- $19,800
Cash invested: $64,120 (down + closing). Projections, not guarantees.
Landlord ↔ Tenant lean methodology
- Overall (STATE)
- 90 Strongly Landlord-Friendly
- State Indiana
- 90 Strongly Landlord-Friendly · R+11
- County
- — inherits STATE
- City
- — inherits STATE
ZIP-level market 46239
- Home prices YoY
- -29.2%
- Rents YoY
- 6.1%
- Active inventory
- 337
- Price-to-rent
- 9.7×
Monthly cashflow live
- Estimated rent
- $1,973 high interval (Pro) →
- Mortgage (P&I)
- −$1,201
- Tax from tax record
- −$201 /mo · $2,416/yr
- Insurance
- −$95
- HOA
- −$0
- Vacancy / Maint / Mgmt
- −$414
- Net cashflow
- $61
Break-even live
Sensitivity live
| Price | -10% $191 | -5% $126 | +0% $61 | +5% $-4 | +10% $-68 |
|---|---|---|---|---|---|
| Rent | -10% $-95 | -5% $-17 | +0% $61 | +5% $139 | +10% $217 |
| Rate | -1.0pp $177 | -0.5pp $120 | base $61 | +0.5pp $2 | +1.0pp $-58 |
UW: 25.0% down · 7.5% · 30yr · 1.5% tax · 5.0% vac · 8.0% maint · 8.0% mgmt
Financing live
Cash to close
- Down payment
- $57,250
- Closing costs
- $6,870
- Reserves months
- —
- Total cash needed
- —
Loan-product check · same deal, 3 products live
Conventional
25% down · 7.5% · 30yr
- Down + closing
- —
- Monthly P&I
- —
- Monthly cashflow
- —
- DSCR
- —
- Eligible?
- —
Personal DTI + credit; lowest rate.
DSCR
20% down · 8.5% · 30yr
- Down + closing
- —
- Monthly P&I
- —
- Monthly cashflow
- —
- DSCR
- —
- Eligible?
- —
No personal income docs; deal must DSCR.
Hard money
10% down · 12.0% · 12mo
- Down + closing
- —
- Monthly P&I
- —
- Monthly cashflow
- —
- DSCR
- —
- Eligible?
- —
Short-term bridge; refi at stabilization.
Rent comps 16 comps
| Address | Beds | Baths | Sqft | Rent | $/sqft | DOM | Units | Dist |
|---|---|---|---|---|---|---|---|---|
| 7939 Wildwood Farms Ln Indianapolis, IN | 4.0 | 2.5 | 2126 | $1,695 | $0.80 | 14d | 1 | 0.40mi |
| 3203 Brandenburg Dr Indianapolis, IN | 4.0 | 2.5 | 1486 | $1,869 | $1.26 | 5d | 1 | 0.51mi |
| 3143 Danube Way Indianapolis, IN | 3.0 | 2.5 | 1792 | $2,050 | $1.14 | 3d | 1 | 0.51mi |
| 3718 Laurel Cherry Ln Indianapolis, IN | 3.0 | 2.0 | 1368 | $1,695 | $1.24 | 25d | 1 | 0.51mi |
| 3146 Brandenburg Dr Indianapolis, IN | 3.0 | 2.0 | 1200 | $1,689 | $1.41 | 5d | 1 | 0.51mi |
| 3149 Brandenburg Dr Indianapolis, IN | 4.0 | 2.5 | 1486 | $1,885 | $1.27 | 6d | 1 | 0.51mi |
| 7650 Lara Lee Dr Indianapolis, IN | 4.0 | 2.0 | 1696 | $2,039 | $1.20 | 25d | 1 | 0.60mi |
| 8123 Fisher Bend Dr Indianapolis, IN | 4.0 | 2.5 | 1633 | $1,856 | $1.14 | 0d | 1 | 0.68mi |
| 4225 Tiana Cir Indianapolis, IN | 3.0 | 2.0 | 1946 | $2,071 | $1.06 | 14d | 1 | 0.77mi |
| 8520 Sierra Ridge Dr Indianapolis, IN | 2.0–3.0 | 2.0 | 1091 | $1,775 | $1.63 | 0d | 17 | 0.88mi |
| 2825 Ludwig Dr Indianapolis, IN | 4.0 | 2.0 | 1500 | $2,056 | $1.37 | 25d | 1 | 0.92mi |
| 8544 Sweet Birch Dr Indianapolis, IN | 3.0 | 2.0 | 1209 | $1,670 | $1.38 | 0d | 1 | 1.00mi |
| 6543 E Hanna Ave Indianapolis, IN | 2.0–4.0 | 2.0 | 1312 | $1,479 | $1.13 | 0d | 1 | 1.14mi |
| 3256 Abaca Ct Indianapolis, IN | 3.0 | 2.5 | 2035 | $1,741 | $0.86 | 25d | 1 | 1.38mi |
| 4127 S Post Rd Indianapolis, IN | 3.0 | 2.0 | 1460 | $1,585 | $1.09 | 25d | 1 | 1.42mi |
| 8017 Grand Gulch Dr Indianapolis, IN | 3.0 | 2.5 | 2128 | $2,120 | $1.00 | 9d | 1 | 1.45mi |
Listing history 6 events
-
2026-06-21days on market $229,000 Active 8 DOM
-
2026-06-18days on market $229,000 Active 5 DOM
-
2026-06-17days on market $229,000 Active 4 DOM
-
2026-06-16days on market $229,000 Active 3 DOM
-
2026-06-15remarks 699-char remark
-
2026-06-15$229,000 Active 2 DOM
ⓘ Source: listings_history table (triggers on properties + properties_extension) + one-shot
backfill from property_details.listing_events for pre-trigger history.
Tax reassessment forecast IN · Partial reset (capped growth)
- Current annual tax
- $2,416 · $201/mo
- Projected year-2 tax
- $2,416 · $201/mo
- Expected delta
- $0/yr ($0/mo · 0.0%)
ⓘ Screening estimate from a state-policy table — verify with the county assessor before closing.
Climate risk First Street
- Flood 1/10 Low FEMA zone X (unshaded) · 0% chance over 30 yrs
- Wildfire 1/10 Low
- Heat 3/10 Moderate 7 d/yr ≥102°F today · 19 d/yr by 30 yrs out
- Wind 2/10 Low 100% chance of damaging wind over 30 yrs
- Air quality 2/10 Low 1 unhealthy d/yr today · 2 by 30 yrs out
Nearby sold comps map
Loading sold comps map…
Walkable amenities ~0.75 mi
Loading nearby amenities…
Taxation est. · year 1
- Rental income
- $23,680
- − Mortgage interest
- −$12,828
- − Property taxes
- −$2,416
- − Insurance
- −$1,145
- − Repairs & maintenance
- −$1,894
- − Management
- −$1,894
- − Depreciation
- −$6,662
- Taxable loss
- −$3,159
- Est. tax savings @ 24.0%
- +$758
- After-tax cash flow
- $1,493/yr
For passive investors: Depreciation is non-cash, so a rental often shows a tax loss while cash-flowing — sheltering income. Rental losses are passive: they offset passive income freely, and up to $25,000/yr can offset ordinary (W-2) income if you actively participate and your MAGI is under $100k (phasing out to $0 by $150k); unused losses carry forward. On sale, claimed depreciation is recaptured at up to 25%, and gains may owe capital-gains tax (a 1031 exchange can defer both). Figures are a year-1 estimate at your 24.0% rate — not tax advice; consult a CPA.
Schools (NCES district)
- District
- Franklin Township Community School Corporation
- NCES district ID
- 1803750
- Math proficiency
- 42% ▼ -12.00%
- Reading proficiency
- 47% ▼ -6.00%
- Median HH income
- $67,825
- Composite
- 39.91/100
- National rank
- #3852
- State rank
- #87 of 301 in IN
Livability — Indianapolis city (balance)
No livability data for this city. (Only ~50 U.S. cities are tracked.)
Census & demographics
- Census place
- Indianapolis city (balance), IN
- County
- Marion County · 998,460 people
- City population
- 881,119
- Metro
- Indianapolis-Carmel-Anderson, IN
- Population (ZIP)
- 33,931
- Household income
- $100,331
- Rent vs Own
- Severe rent burden
- 567.0
Population outlook (Marion County) Hauer SSP2
- Today (2025)
- 1,025,572 people
- By 2030
- 1,065,727 · +3.9%
- By 2040
- 1,141,577 · +11.3%
- By 2050
- 1,208,920 · +17.9%
- By 2075
- 1,367,288 · +33.3%
- By 2100
- 1,438,201 · +40.2%
Race, ethnicity, and origin ACS 2023
- Neighborhood character
- Diverse neighborhood (Simpson 0.61)
- Race & ethnicity
- White 57% Black 24% Hispanic / Latino 9% Two or more races 9% Asian 4%
- Hispanic origin (detail)
- Mexican 6%
- Common ancestry
- Lithuanian 2% Slovak 2% Romanian 1%
- Foreign-born
- 7% · Canada, Philippines, China
- Languages at home
- 89% English-only · Spanish 6% Other Indo-European 2% Chinese 1%
Political lean MEDSL · Marion
- 2024 margin
- Strong D (+27.7) · D 63.0% · R 35.3% · Other 1.7%
- 2008→2024 swing
- -0.7pp no change · 2008: 28.4pp · 2024: 27.7pp
- All cycles
- 2024: D+27.7 2020: D+29.1 2016: D+22.8 2012: D+22.2 2008: D+28.4
Not yet ingested
- Civics
- —
Market trends
- HPI YoY
- ▼ -93.15%
- Current HPI
- 226.1965
- Rent YoY
- ▲ 6.11%
- Metro
- Indianapolis-Carmel-Anderson, IN
- State GDP YoY
- ▲ 2.90%
- F500 in state
- 18
Industry mix (Fortune 500 HQ in IN)
| Industry | F500 HQs | Revenue |
|---|---|---|
| Industrial Machinery | 2 | $37B |
|
||
| Healthcare | 1 | $177B |
|
||
| Pharmaceuticals | 1 | $45B |
|
||
| Metals / Steel | 1 | $18B |
|
||
| Agriculture | 1 | $17B |
|
||
| Packaging | 1 | $12B |
|
||
Price history
+332.1% since first listed2 events — show timeline
- 2026-06-11 Listed $229,000 MIBOR as Distributed by MLS Grid
- 2025-08-20 Sold (Public Records) $53,000 Public Records
Property tax history
+6.8%/yrLatest (2025): $2,416 · +50.6% YoY. Source: county tax records.
Cash-flow waterfall
monthlySold comps — $/sqft
last 12 mo · ≤1 miLoading sold comps…