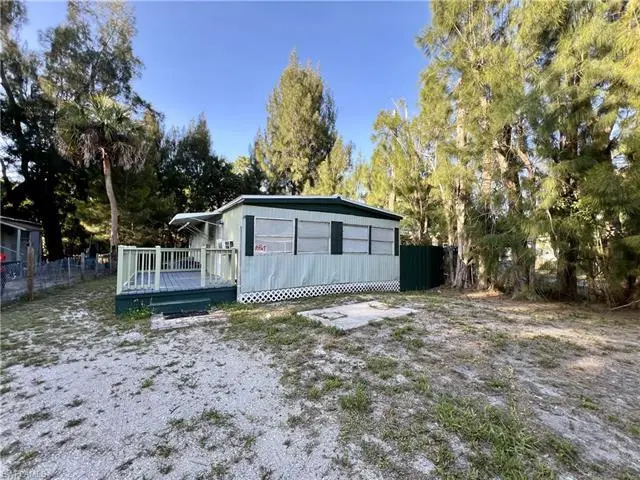
334 Capitol St · Palmona Park, FL
Flood risk 3/10 · Minor
- FEMA flood zone
- X (unshaded)
- Chance of flooding over 30 yrs
- 0.1%
- Est. flood insurance / yr
- $507 – $1,088
Fire risk 3/10 · Minor
- Est. fire insurance / yr
- $947 – $1,759
Heat risk 10/10 · Severe
- Hot days now (above 106°F)
- 7 days/yr
- Hot days in 30 yrs
- 29 days/yr
Wind risk 10/10 · Severe
- Chance of severe wind over 30 yrs
- 99.0%
Air-quality risk 2/10 · Minimal
- Unhealthy air days now
- 1 days/yr
- Unhealthy air days in 30 yrs
- 1 days/yr
Risk factors via First Street. Map © Google.
Why this score? — see what drove the C+ grade
The composite is a weighted blend of 9 inputs, each scored 0–100. Each bar is that input's sub-score; the figure is the points it added to the 100-point composite (weight × sub-score).
- Cash flow +28.0/30.0
- DSCR +9.9/10.0
- ARV discount +7.5/15.0
- 1% rule +7.1/10.0
- Schools +4.1/10.0
- Livability +2.8/5.0
- Condition / age +2.5/5.0
- Rent growth +2.0/5.0
- Appreciation +0.0/10.0
$125,000
🖨 Deal sheet (PDF) 📄 Offer letter ✓ Due diligence
Listing remarks
Seller Financing Available! This Manufactured Double Wide Home offers 2-bedrooms, 1 Bathroom, plus a den which could be used as a third bedroom or home office. Enjoy the convenience of city water, septic, laundry connections, and a brand new 2025 roof. This home is not located in a flood zone — no flood insurance required! No HOA, no restrictions. This property has the option of being lived in and also to rent out for income. Near Schools, Restaurants, Shops, Walmart, Home Depot, and only a few miles to Downtown Fort Myers. Owner Financing available with a minimum of 20% down.
Key facts
- Laundry connections
- Brand new roof
- Septic
Tags
Property features AI
Finance
- Other: Property located in PALMONA PARK (Subdivision 02); Lot is regular and measures approximately 0.1169 acres; Lot dimensions reported by Property Appraiser Office
- HOA & community: No HOA maintenance or amenities; Community type: See remarks
Exterior
- Utilities: Central water; Septic sewage; Cable available
- Home design: Manufactured residential home; Built in 1973; Single story; Rear faces north
- Construction: Manufactured construction; Metal roof
- Exterior features: Deck; Landscaped area view; Single hung windows; Aluminum siding
Interior
- Kitchen: Range; Refrigerator/Freezer
- Bedrooms: 2 bedrooms
- Flooring: Carpet; Vinyl
- Bathrooms: 1 full bathroom; No master bath
- Heating & cooling: Window unit cooling
- Interior features: Smoke detectors; Den / study; Unfurnished
- Laundry & utility: Washer/dryer hookup
Neighborhood map
What this means for you Summary
Snapshot
- This is a 2-bed/1.0-bath manufactured listed at $125k.
Deal economics
- At list price, monthly cash flow is $388 ($5k/yr) — positive.
- The deal already cash-flows at list — no discount required.
- Meets the 1% rule at list price ($2k rent vs $125k).
Location & tenants
- Location reads 55/100 on livability (#875 in FL) — a working-class tenant base; expect higher turnover. Strengths: cost of living A+, crime A, health & safety A; Watch: schools F, amenities F, commute F.
- Lee (suburban): math 47% / reading 50% proficiency, ranked #42 of 73 in FL (top 58%) — families likely to look elsewhere, expect single-tenant / working-renter base with shorter leases.
- Market conditions: Rents soft (-1.9%/yr); 472 active listings in the ZIP; 28 comparable units currently listed for rent nearby; rentals at typical pace (median 25d on market — plan ~3-4 weeks tenant-placement turnaround); 15,411 units permitted in Lee County in 2024 (4,686 in 5+ unit buildings).
- This rent runs 32% of the median local income ($57k/yr) — at the standard rent-burdened threshold; future hikes will face affordability resistance.
Forward outlook
- Local home prices are declining (-3.0%/yr); year-one equity from $864 of loan paydown is wiped out by about $4k of value loss. Plan a longer hold.
- Lee County population projected at +44% by 2050 — long-run rental-demand tailwind backs the buy-and-hold thesis.
Negotiation context
- Only 13 days on market — expect competitive offers; lowballing is unlikely to land.
- Current owner paid $2k; list at $125k implies a 6150% gain — meaningful room to come down on a strong offer.
Risks & watch-outs
- Climate carrying-cost: severe wind risk, 99% chance of damaging wind over 30y; extreme-heat days projected 7→29/yr by 2055 (HVAC capex compounding) — expect insurance premiums to compound above CPI over the hold.
Questions for the listing agent
- Built in 1973 — when were the roof, HVAC, electrical panel, plumbing, and water heater last replaced?
- Is there a deadline driving the sale (1031 exchange, divorce, estate, relocation)? That informs how much negotiation room exists.
- Schools are F-rated, which usually means shorter tenancies and higher turnover. Who's the typical renter profile here, and what's been the actual vacancy rate?
- What's the average days-on-market for RENTAL listings here right now (not sales)? A rising rental-DOM trend means longer vacancies and softer asking-rent achievability than the comps imply.
- What's the recent tenant-quality profile in this submarket — average credit score on applications, eviction rate, late-payment / NSF rate, and stable-employment percentage? A property-management company in the area should have these aggregated.
- How much new for-sale + rental construction is in the pipeline within 1–3 miles? Heavy new supply typically softens prices + rents 12–24 months out; constrained supply supports both.
Investment metrics
- 1% rule
- 1.21% ✓
- Cap rate
- 10.02%
- Cash-on-cash
- 13.30%
- DSCR
- 1.59
- GRM
- 6.9
CMA / ARV
No comps found within radius.
Projected returns pro-forma
-3.0% appreciation · 0.0% rent growth · sell at horizon
- IRR
- -0.0%
- Equity multiple
- 1.00×
- Total profit
- $-1
- Equity at exit
- $18,638
- IRR
- 6.4%
- Equity multiple
- 1.42×
- Total profit
- $14,610
- Equity at exit
- $10,808
Cash invested: $35,000 (down + closing). Projections, not guarantees.
Landlord ↔ Tenant lean methodology
- Overall (STATE)
- 87 Strongly Landlord-Friendly
- State Florida
- 87 Strongly Landlord-Friendly · R+3
- County
- — inherits STATE
- City
- — inherits STATE
ZIP-level market 33903
- Rents YoY
- -1.9%
- Active inventory
- 472
- Price-to-rent
- 6.9×
Monthly cashflow live
- Estimated rent
- $1,515 high interval (Pro) →
- Mortgage (P&I)
- −$656
- Tax from tax record
- −$101 /mo · $1,214/yr
- Insurance
- −$52
- HOA
- −$0
- Vacancy / Maint / Mgmt
- −$318
- Net cashflow
- $388
Break-even live
Sensitivity live
| Price | -10% $459 | -5% $423 | +0% $388 | +5% $353 | +10% $317 |
|---|---|---|---|---|---|
| Rent | -10% $268 | -5% $328 | +0% $388 | +5% $448 | +10% $508 |
| Rate | -1.0pp $451 | -0.5pp $420 | base $388 | +0.5pp $355 | +1.0pp $323 |
UW: 25.0% down · 7.5% · 30yr · 1.5% tax · 5.0% vac · 8.0% maint · 8.0% mgmt
Financing live
Cash to close
- Down payment
- $31,250
- Closing costs
- $3,750
- Reserves months
- —
- Total cash needed
- —
Loan-product check · same deal, 3 products live
Conventional
25% down · 7.5% · 30yr
- Down + closing
- —
- Monthly P&I
- —
- Monthly cashflow
- —
- DSCR
- —
- Eligible?
- —
Personal DTI + credit; lowest rate.
DSCR
20% down · 8.5% · 30yr
- Down + closing
- —
- Monthly P&I
- —
- Monthly cashflow
- —
- DSCR
- —
- Eligible?
- —
No personal income docs; deal must DSCR.
Hard money
10% down · 12.0% · 12mo
- Down + closing
- —
- Monthly P&I
- —
- Monthly cashflow
- —
- DSCR
- —
- Eligible?
- —
Short-term bridge; refi at stabilization.
Rent comps 28 comps
| Address | Beds | Baths | Sqft | Rent | $/sqft | DOM | Units | Dist |
|---|---|---|---|---|---|---|---|---|
| 260 Stockton St North Fort Myers, FL | 2.0 | 2.0 | 924 | $1,200 | $1.30 | 4d | 1 | 0.15mi |
| 248 Stockton St North Fort Myers, FL | 3.0 | 2.0 | 924 | $1,300 | $1.41 | 24d | 1 | 0.15mi |
| 247 Stockton St North Fort Myers, FL | 3.0 | 2.0 | 924 | $1,325 | $1.43 | 24d | 1 | 0.17mi |
| 538 State St North Fort Myers, FL | 3.0 | 1.5 | 1000 | $1,199 | $1.20 | 24d | 1 | 0.34mi |
| 446 San Bernardino St North Fort Myers, FL | 2.0 | 1.0 | 1104 | $1,590 | $1.44 | 11d | 1 | 0.40mi |
| 3260 Stockton St North Fort Myers, FL | 3.0 | 1.0–2.0 | 976 | $2,371 | $2.43 | 2d | 27 | 0.51mi |
| 240 W Mariana Ave Apt B North Fort Myers, FL | 1.0 | 1.0 | 600 | $1,295 | $2.16 | 24d | 1 | 0.69mi |
| 8791 Littleton Rd North Fort Myers, FL | 2.0 | 2.0 | 1074 | $1,549 | $1.44 | 24d | 1 | 0.77mi |
| 1846 Powell Dr Unit 28 North Fort Myers, FL | 1.0 | 1.0 | 850 | $1,500 | $1.76 | 4d | 1 | 0.79mi |
| 28 Nyborg Ave North Fort Myers, FL | 3.0 | 2.0 | 1042 | $1,299 | $1.25 | 15d | 1 | 0.86mi |
| 3050 Steeple Cir Cape Coral, FL | 1.0–3.0 | 1.0–2.0 | 1003 | $1,668 | $1.66 | 3d | 27 | 0.96mi |
| 947 Strongbox Ln North Fort Myers, FL | 2.0 | 2.0 | 1000 | $1,300 | $1.30 | 24d | 1 | 0.97mi |
| 112 Crescent Lake Dr North Fort Myers, FL | 2.0 | 1.0 | 980 | $1,700 | $1.73 | 24d | 1 | 1.06mi |
| 2700 Diplomat Pkwy E Cape Coral, FL | 1.0–3.0 | 1.0–2.0 | 1116 | $2,382 | $2.13 | 4d | 41 | 1.11mi |
| 1526 Wood Rd North Fort Myers, FL | 1.0 | 1.0 | 912 | $1,500 | $1.64 | 4d | 1 | 1.13mi |
| 69 E Mariana Ave Unit B North Fort Myers, FL | 3.0 | 1.0 | 1000 | $1,795 | $1.79 | 4d | 1 | 1.14mi |
| 16363 Teresa Ln North Fort Myers, FL | 2.0 | 1.0 | 1000 | $1,000 | $1.00 | 24d | 1 | 1.16mi |
| 2774 Wedgewood Dr North Fort Myers, FL | 2.0 | 2.0 | 880 | $1,300 | $1.48 | 24d | 1 | 1.21mi |
| 21 Crescent Lake Dr Unit 21 North Fort Myers, FL | 2.0 | 1.0 | 900 | $1,550 | $1.72 | 24d | 1 | 1.22mi |
| 4120 Pine Drop Ln North Fort Myers, FL | 3.0 | 2.0 | 957 | $1,895 | $1.98 | 24d | 1 | 1.25mi |
| 3404 Rainbow Ln North Fort Myers, FL | 2.0 | 2.0 | 1056 | $1,800 | $1.70 | 4d | 1 | 1.27mi |
| 571 Sunrise Ln North Fort Myers, FL | 2.0 | 2.0 | 1004 | $1,400 | $1.39 | 24d | 1 | 1.43mi |
| 1288 Waite Dr North Fort Myers, FL | 2.0 | 2.0 | 972 | $2,200 | $2.26 | 24d | 1 | 1.44mi |
| 2027 Eloise Cir North Fort Myers, FL | 2.0 | 1.0 | 822 | $1,300 | $1.58 | 4d | 1 | 1.46mi |
| 1275 Gramac Dr North Fort Myers, FL | 3.0 | 2.0 | 1013 | $1,575 | $1.55 | 24d | 1 | 1.46mi |
| 1275 Gramac Dr North Fort Myers, FL | 3.0 | 2.0 | 1013 | $1,550 | $1.53 | 4d | 1 | 1.46mi |
| 1260 Joerin Ave North Fort Myers, FL | 1.0 | 1.0 | 936 | $1,105 | $1.18 | 24d | 1 | 1.48mi |
| 2095 Eloise Cir North Fort Myers, FL | 2.0 | 1.0 | 840 | $1,295 | $1.54 | 24d | 1 | 1.48mi |
Listing history 10 events
-
2026-06-18days on market $125,000 Active 13 DOM
-
2026-06-17days on market $125,000 Active 12 DOM
-
2026-06-16days on market $125,000 Active 11 DOM
-
2026-06-15days on market $125,000 Active 10 DOM
-
2026-06-13days on market $125,000 Active 8 DOM
-
2026-06-10days on market $125,000 Active 5 DOM
-
2026-06-09days on market $125,000 Active 4 DOM
-
2026-06-08days on market $125,000 Active 3 DOM
-
2026-06-07remarks 583-char remark
-
2026-06-07$125,000 Active 2 DOM
ⓘ Source: listings_history table (triggers on properties + properties_extension) + one-shot
backfill from property_details.listing_events for pre-trigger history.
Tax reassessment forecast FL · Resets to sale price
- Current annual tax
- $1,214 · $101/mo
- Projected year-2 tax
- $1,214 · $101/mo
- Expected delta
- $0/yr ($0/mo · 0.0%)
ⓘ Screening estimate from a state-policy table — verify with the county assessor before closing.
Climate risk First Street
- Flood 3/10 Moderate FEMA zone X (unshaded) · 10% chance over 30 yrs
- Wildfire 3/10 Moderate
- Heat 10/10 Extreme 7 d/yr ≥106°F today · 29 d/yr by 30 yrs out
- Wind 10/10 Extreme 99% chance of damaging wind over 30 yrs
- Air quality 2/10 Low 1 unhealthy d/yr today · 1 by 30 yrs out
Nearby sold comps map
Loading sold comps map…
Walkable amenities ~0.75 mi
Loading nearby amenities…
Taxation est. · year 1
- Rental income
- $18,177
- − Mortgage interest
- −$7,002
- − Property taxes
- −$1,214
- − Insurance
- −$625
- − Repairs & maintenance
- −$1,454
- − Management
- −$1,454
- − Depreciation
- −$3,636
- Taxable income
- $2,791
- Est. tax owed @ 24.0%
- −$670
- After-tax cash flow
- $3,985/yr
For passive investors: Depreciation is non-cash, so a rental often shows a tax loss while cash-flowing — sheltering income. Rental losses are passive: they offset passive income freely, and up to $25,000/yr can offset ordinary (W-2) income if you actively participate and your MAGI is under $100k (phasing out to $0 by $150k); unused losses carry forward. On sale, claimed depreciation is recaptured at up to 25%, and gains may owe capital-gains tax (a 1031 exchange can defer both). Figures are a year-1 estimate at your 24.0% rate — not tax advice; consult a CPA.
Schools (NCES district)
- District
- Lee
- NCES district ID
- 1201080
- Math proficiency
- 47% ▼ -11.00%
- Reading proficiency
- 50% ▼ -4.00%
- Median HH income
- $49,518
- Composite
- 41.49/100
- National rank
- #3458
- State rank
- #42 of 73 in FL
Livability — Palmona Park
- Score
- 55/100
- State rank
- #875
- US rank
- #23153
Category grades
Schools grade is shown separately in the Schools card above.
Census & demographics
- Census place
- Palmona Park, FL
- County
- Lee County · 788,662 people
- Metro
- Cape Coral-Fort Myers, FL
- Population (ZIP)
- 23,655
- Household income
- $56,993
- Rent vs Own
- Severe rent burden
- 468.0
Population outlook (Lee County) Hauer SSP2
- Today (2025)
- 871,946 people
- By 2030
- 955,468 · +9.6%
- By 2040
- 1,113,587 · +27.7%
- By 2050
- 1,256,891 · +44.1%
- By 2075
- 1,560,270 · +78.9%
- By 2100
- 1,726,848 · +98.0%
Race, ethnicity, and origin ACS 2023
- Neighborhood character
- Predominantly White (81%)
- Race & ethnicity
- White 81% Hispanic / Latino 14% Two or more races 8% Black 2%
- Hispanic origin (detail)
- Mexican 3% Puerto Rican 3% Cuban 3%
- Common ancestry
- Lithuanian 4% Romanian 4% Italian 3%
- Foreign-born
- 11% · Canada
- Languages at home
- 88% English-only · Spanish 9% Other Indo-European 1%
Political lean MEDSL · Lee
- 2024 margin
- Strong R (+28.4) · D 35.5% · R 63.9%
- 2008→2024 swing
- -18.0pp toward R · 2008: -10.4pp · 2024: -28.4pp
- All cycles
- 2024: R+28.4 2020: R+19.2 2016: R+20.4 2012: R+16.6 2008: R+10.4
Not yet ingested
- Civics
- —
Market trends
- HPI YoY
- ▼ -172.26%
- Current HPI
- 256.773
- Rent YoY
- ▼ -1.94%
- Metro
- Cape Coral-Fort Myers, FL
- State GDP YoY
- ▲ 3.28%
- F500 in state
- 36
Industry mix (Fortune 500 HQ in FL)
| Industry | F500 HQs | Revenue |
|---|---|---|
| Industrial Technology | 2 | $29B |
|
||
| Insurance | 2 | $17B |
|
||
| Retail | 1 | $60B |
|
||
| Technology Distribution | 1 | $58B |
|
||
| Homebuilding | 1 | $35B |
|
||
| Technology Manufacturing | 1 | $35B |
|
||
Price history
+6150.0% since first listed2 events — show timeline
- 2026-06-05 Listed $125,000 NAPLESMLS
- 2001-11-07 Sold (Public Records) $2,000 Public Records
Property tax history
+12.0%/yrLatest (2025): $1,214 · +4.1% YoY. Source: county tax records.
Cash-flow waterfall
monthlySold comps — $/sqft
last 12 mo · ≤1 miLoading sold comps…