 Duplex
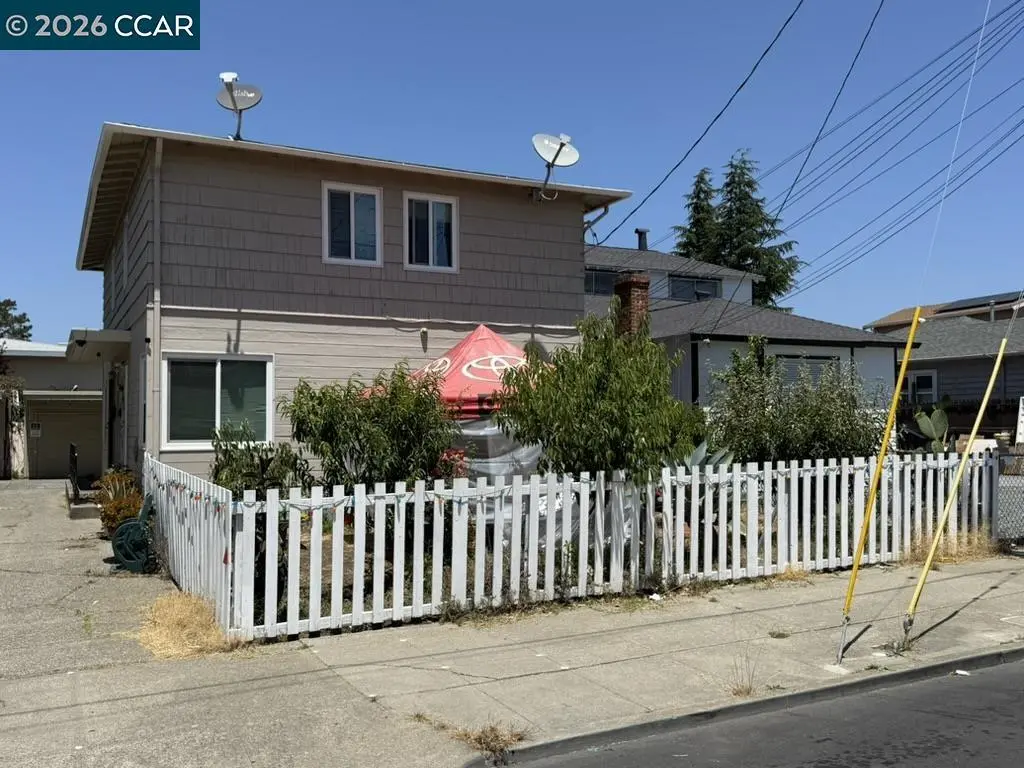
2227 Warner Ave · Oakland, CA
Flood risk 1/10 · Minimal
- FEMA flood zone
- X (unshaded)
- Chance of flooding over 30 yrs
- 0.0%
- Est. flood insurance / yr
- $507 – $1,088
Fire risk 4/10 · Minor
- Est. fire insurance / yr
- $659 – $1,223
Heat risk 4/10 · Minor
- Hot days now (above 84°F)
- 7 days/yr
- Hot days in 30 yrs
- 15 days/yr
Wind risk 1/10 · Minimal
- Chance of severe wind over 30 yrs
- —
Air-quality risk 8/10 · Major
- Unhealthy air days now
- 14 days/yr
- Unhealthy air days in 30 yrs
- 14 days/yr
Risk factors via First Street. Map © Google.
Why this score? — see what drove the D+ grade
The composite is a weighted blend of 9 inputs, each scored 0–100. Each bar is that input's sub-score; the figure is the points it added to the 100-point composite (weight × sub-score).
- ARV discount +15.0/15.0
- Cash flow +14.3/30.0
- DSCR +4.4/10.0
- 1% rule +3.7/10.0
- Livability +3.6/5.0
- Schools +3.0/10.0
- Rent growth +2.9/5.0
- Condition / age +2.5/5.0
- Appreciation +0.0/10.0
$549,000
🖨 Deal sheet (PDF) 📄 Offer letter ✓ Due diligence
Multi-family units
County records classify this as Multi-Family (2-4 Unit). Listing-text estimate: 2 units. confirmed
Listing remarks MLS
Good investment property and great rents.
Key facts
- Both units rented
- 4,280 sq ft lot
- Garage
Tags
Property features AI
Exterior
- Parking: Detached garage with 2 parking spaces
- Utilities: Public water; Public sewer; Individual electric meter; Individual gas meter
- Home design: Residential income property; Duplex; Built in 1951
- Construction: Wood shingles and wood siding
- Exterior features: Front yard; Yard space; Rectangular lot
Interior
- Flooring: Laminate
- Heating & cooling: Wall furnace heating; No air conditioning
- Interior features: Laminate flooring
Neighborhood map
What this means for you Summary
Snapshot
- This is a 2 × 2-bed/1.0-bath units multifamily listed at $549k.
Deal economics
- At list price, monthly cash flow is $102 ($1k/yr) — positive. Per door: $51/mo.
- The deal already cash-flows at list — no discount required.
- To meet the 1% rule (rent ≥ 1% of price), the offer needs to be $475k (13.4% below list).
- Recommended offer: $475k (13.4% below list) — sets the bar for 1% rule.
- Cap rate 6.5% vs local median 2.4% in Oakland — top-decile yield for the area; either an underpriced asset or a hidden risk that comps aren't pricing in. Stress-test before assuming the spread holds.
Location & tenants
- Location reads 71/100 on livability (#224 in CA) — a middle-class / working-renter tenant base. Strengths: amenities A+, commute A+, employment A+; Watch: schools C-, crime F, cost of living F.
- Oakland Unified (urban): math 27% / reading 33% proficiency, ranked #1,007 of 1,400 in CA (top 72%) — families likely to look elsewhere, expect single-tenant / working-renter base with shorter leases; 68% free/reduced lunch — lower-income household profile, screen leases tightly.
- Market conditions: Rents rising (+1.6%/yr); 98 active listings in the ZIP; 18 comparable units currently listed for rent nearby; rentals lingering (median 45d on market — plan ~5-8 weeks vacancy on turnover, expect pricing pressure); 56% of comp listings sitting > 30 days — soft ceiling on asking rent; solid renter incomes; 1,742 units permitted in Alameda County in 2024 (856 in 5+ unit buildings).
- At $4,752/mo this rent would consume 74% of the median local household income ($77k/yr) (locally 2061% of renters already pay >50% of income on rent) — very limited rent-growth headroom before tenants either downsize or default.
Forward outlook
- Local home prices are declining (-3.0%/yr); year-one equity from $4k of loan paydown is wiped out by about $16k of value loss. Plan a longer hold.
- Alameda County population projected at +34% by 2050 — long-run rental-demand tailwind backs the buy-and-hold thesis.
Negotiation context
- It's been on market 15 days — a 2% lower offer ($541k) is reasonable based on typical stale-listing flexibility.
- 2 sale attempts since 13y ago with the ask held roughly flat each time — persistent listings suggest the price (not the market) is what's stuck; bring a comps-based counter.
- Current owner paid $258k; list at $549k implies a 113% gain — meaningful room to come down on a strong offer.
Risks & watch-outs
- Watch-outs: built in 1951 — expect roof / HVAC / electrical / plumbing capex.
Questions for the listing agent
- Can we see the unit-by-unit rent roll, current vacancy, and any below-market leases? What's the average tenancy length?
- What capital expenditures (roof, boiler, parking lot, exteriors) have been made in the last 5 years, and what's planned in the next 2?
- Built in 1951 — when were the roof, HVAC, electrical panel, plumbing, and water heater last replaced?
- Is there a deadline driving the sale (1031 exchange, divorce, estate, relocation)? That informs how much negotiation room exists.
- Crime grade is F in this area — have there been break-ins, vandalism, or insurance claims at this property in the last 3 years? What carrier currently insures it and at what premium?
- The area grade is low — what's the realistic commute time and amenity access for the typical tenant pool here? Any planned neighborhood developments (good or bad) we should know about?
- What's the average days-on-market for RENTAL listings here right now (not sales)? A rising rental-DOM trend means longer vacancies and softer asking-rent achievability than the comps imply.
- What's the recent tenant-quality profile in this submarket — average credit score on applications, eviction rate, late-payment / NSF rate, and stable-employment percentage? A property-management company in the area should have these aggregated.
- How much new apartment / multifamily construction is in the pipeline within 1–3 miles? Heavy new supply (>2% of stock underway) typically softens rents 12–24 months out; light construction supports rent growth.
Investment metrics
- 1% rule
- 0.87% ✗
- Cap rate
- 6.52%
- Cash-on-cash
- 0.80%
- DSCR
- 1.04
- GRM
- 9.6
CMA / ARV
- ARV (on-the-fly)
- $879,168
- Comps found
- 2
Show comp detail 2 sales within ~0.75 mi
| Address | Dist | Beds/Ba | Sqft | Sold | Price | $/sf | Match |
|---|---|---|---|---|---|---|---|
| 1288 100th Ave | 0.68mi | 4/2.0 | 1,628 (-11%) | 10mo | $553,500 | $340 | 42 |
| 2224 107th Ave | 0.53mi | 4/3.0 | 1,555 (-15%) | 8mo | $750,000 | $482 | 40 |
Match score weights: distance 35% · size 25% · config 20% · recency 20%. Top-matched comps best support the ARV.
Projected returns pro-forma
-3.0% appreciation · 1.58% rent growth · sell at horizon
- IRR
- -16.6%
- Equity multiple
- 0.42×
- Total profit
- $-89,184
- Equity at exit
- $81,858
- IRR
- -11.0%
- Equity multiple
- 0.38×
- Total profit
- $-96,066
- Equity at exit
- $47,467
Cash invested: $153,720 (down + closing). Projections, not guarantees.
Landlord ↔ Tenant lean methodology
- Overall (CITY)
- 0 Strongly Tenant-Friendly
- State California
- 18 Strongly Tenant-Friendly · D+13
- County
- — inherits STATE
- City Oakland
- 0 Strongly Tenant-Friendly · D+62
ZIP-level market 94603
- Rents YoY
- 1.6%
- Active inventory
- 98
- Price-to-rent
- 19.3×
Monthly cashflow live
- Estimated rent
- $4,752 high interval (Pro) →
- Mortgage (P&I)
- −$2,879
- Tax from tax record
- −$544 /mo · $6,533/yr
- Insurance
- −$229
- HOA
- −$0
- Vacancy / Maint / Mgmt
- −$998
- Net cashflow
- $102
Break-even live
Sensitivity live
| Price | -10% $413 | -5% $257 | +0% $102 | +5% $-54 | +10% $-209 |
|---|---|---|---|---|---|
| Rent | -10% $-274 | -5% $-86 | +0% $102 | +5% $290 | +10% $477 |
| Rate | -1.0pp $378 | -0.5pp $242 | base $102 | +0.5pp $-40 | +1.0pp $-185 |
2-unit breakdown (identical units grouped — click to expand)
| Units | Beds | Baths | Est. rent |
|---|---|---|---|
| 2× units | 2 | 1 | $4,752 |
| #1 | 2 | 1 | $2,376 |
| #2 | 2 | 1 | $2,376 |
| Total (2 units) | $4,752 | ||
UW: 25.0% down · 7.5% · 30yr · 1.5% tax · 5.0% vac · 8.0% maint · 8.0% mgmt
Financing live
Cash to close
- Down payment
- $137,250
- Closing costs
- $16,470
- Reserves months
- —
- Total cash needed
- —
Loan-product check · same deal, 3 products live
Conventional
25% down · 7.5% · 30yr
- Down + closing
- —
- Monthly P&I
- —
- Monthly cashflow
- —
- DSCR
- —
- Eligible?
- —
Personal DTI + credit; lowest rate.
DSCR
20% down · 8.5% · 30yr
- Down + closing
- —
- Monthly P&I
- —
- Monthly cashflow
- —
- DSCR
- —
- Eligible?
- —
No personal income docs; deal must DSCR.
Hard money
10% down · 12.0% · 12mo
- Down + closing
- —
- Monthly P&I
- —
- Monthly cashflow
- —
- DSCR
- —
- Eligible?
- —
Short-term bridge; refi at stabilization.
Rent comps 18 comps
| Address | Beds | Baths | Sqft | Rent | $/sqft | DOM | Units | Dist |
|---|---|---|---|---|---|---|---|---|
| 9887 MacArthur Blvd Unit E Oakland, CA | 3.0 | 3.0 | 1296 | $3,595 | $2.77 | 44d | 1 | 0.17mi |
| 1724 96th Ave Oakland, CA | 4.0 | 2.0 | 1743 | $4,000 | $2.29 | 0d | 1 | 0.36mi |
| 2456 Palmvilla Ct Oakland, CA | 4.0 | 3.0 | 1373 | $4,500 | $3.28 | 0d | 1 | 0.41mi |
| 2702 99th Ave Oakland, CA | 4.0 | 1.0 | 1750 | $4,200 | $2.40 | 44d | 1 | 0.43mi |
| 2456 88th Ave Oakland, CA | 4.0 | 2.0 | 1250 | $3,850 | $3.08 | 44d | 1 | 0.61mi |
| 1211 98th Ave Unit 1211 Oakland, CA | 4.0 | 2.0 | 1630 | $3,300 | $2.02 | 44d | 1 | 0.77mi |
| 97 Durant Ave San Leandro, CA | 3.0 | 2.0 | 1488 | $3,400 | $2.28 | 5d | 1 | 0.81mi |
| 1715 82nd Ave Oakland, CA | 3.0 | 2.0 | 1290 | $3,000 | $2.33 | 44d | 1 | 1.05mi |
| 3830 Twin Oaks Way Oakland, CA | 4.0 | 3.5 | 1811 | $4,500 | $2.48 | 0d | 1 | 1.11mi |
| 1008 88th Ave Oakland, CA | 3.0 | 1.0 | 1464 | $3,400 | $2.32 | 44d | 1 | 1.13mi |
| 8027 Ney Ave Unit 1 Oakland, CA | 4.0 | 2.0 | 1300 | $4,413 | $3.39 | 0d | 1 | 1.14mi |
| 3210 82nd Ave Oakland, CA | 3.0 | 2.0 | 1462 | $4,300 | $2.94 | 21d | 1 | 1.15mi |
| 4021 Fairway Ave Oakland, CA | 3.0 | 2.0 | 1513 | $3,995 | $2.64 | 15d | 1 | 1.20mi |
| 805 Bancroft Ave San Leandro, CA | 4.0 | 2.5 | 2072 | $1,400 | $0.68 | 44d | 1 | 1.25mi |
| 997 Karol Way San Leandro, CA | 3.0 | 1.5 | 1250 | $3,095 | $2.48 | 44d | 1 | 1.31mi |
| 7625 Lockwood St Oakland, CA | 5.0 | 3.0 | 2115 | $1,199 | $0.57 | 44d | 1 | 1.37mi |
| 4081 Oak Hill Rd Oakland, CA | 3.0 | 3.0 | 2006 | $4,095 | $2.04 | 44d | 1 | 1.37mi |
| 3951 Malcolm Ave Oakland, CA | 3.0 | 2.0 | 2399 | $5,000 | $2.08 | 0d | 1 | 1.41mi |
Listing history 11 events
-
2026-06-21days on market $549,000 Active 15 DOM
-
2026-06-18days on market $549,000 Active 12 DOM
-
2026-06-17days on market $549,000 Active 11 DOM
-
2026-06-16days on market $549,000 Active 10 DOM
-
2026-06-15days on market $549,000 Active 9 DOM
-
2026-06-13days on market $549,000 Active 7 DOM
-
2026-06-13days on market $549,000 Active 6 DOM
-
2026-06-09days on market $549,000 Active 3 DOM
-
2026-06-08days on market $549,000 Active 2 DOM
-
2026-06-07remarks 693-char remark
-
2026-06-07$549,000 Active 1 DOM
ⓘ Source: listings_history table (triggers on properties + properties_extension) + one-shot
backfill from property_details.listing_events for pre-trigger history.
Tax reassessment forecast CA · Resets to sale price
- Current annual tax
- $6,533 · $544/mo
- Projected year-2 tax
- $6,533 · $544/mo
- Expected delta
- $0/yr ($0/mo · 0.0%)
ⓘ Screening estimate from a state-policy table — verify with the county assessor before closing.
Climate risk First Street
- Flood 1/10 Low FEMA zone X (unshaded) · 0% chance over 30 yrs
- Wildfire 4/10 Moderate
- Heat 4/10 Moderate 7 d/yr ≥84°F today · 15 d/yr by 30 yrs out
- Wind 1/10 Low
- Air quality 8/10 Severe 14 unhealthy d/yr today · 14 by 30 yrs out
Nearby sold comps map
Loading sold comps map…
Walkable amenities ~0.75 mi
Loading nearby amenities…
Taxation est. · year 1
- Rental income
- $57,024
- − Mortgage interest
- −$30,753
- − Property taxes
- −$6,533
- − Insurance
- −$2,745
- − Repairs & maintenance
- −$4,562
- − Management
- −$4,562
- − Depreciation
- −$15,971
- Taxable loss
- −$8,102
- Est. tax savings @ 24.0%
- +$1,944
- After-tax cash flow
- $3,167/yr
For passive investors: Depreciation is non-cash, so a rental often shows a tax loss while cash-flowing — sheltering income. Rental losses are passive: they offset passive income freely, and up to $25,000/yr can offset ordinary (W-2) income if you actively participate and your MAGI is under $100k (phasing out to $0 by $150k); unused losses carry forward. On sale, claimed depreciation is recaptured at up to 25%, and gains may owe capital-gains tax (a 1031 exchange can defer both). Figures are a year-1 estimate at your 24.0% rate — not tax advice; consult a CPA.
Schools (NCES district)
- District
- Oakland Unified
- NCES district ID
- 0628050
- Math proficiency
- 27% ▬ 0.00%
- Reading proficiency
- 33% ▬ 0.00%
- Median HH income
- $55,194
- Composite
- 29.52/100
- National rank
- #11769
- State rank
- #1007 of 1400 in CA
Livability — Oakland
- Score
- 71/100
- State rank
- #224
- US rank
- #7245
Category grades
Schools grade is shown separately in the Schools card above.
Census & demographics
- Census place
- Oakland, CA
- County
- Alameda County · 1,614,355 people
- City population
- 385,993
- Metro
- San Francisco-Oakland-Berkeley, CA
- Population (ZIP)
- 35,742
- Household income
- $76,723
- Rent vs Own
- Severe rent burden
- 2061.0
Population outlook (Alameda County) Hauer SSP2
- Today (2025)
- 1,928,884 people
- By 2030
- 2,069,146 · +7.3%
- By 2040
- 2,338,405 · +21.2%
- By 2050
- 2,586,608 · +34.1%
- By 2075
- 3,061,911 · +58.7%
- By 2100
- 3,234,133 · +67.7%
Race, ethnicity, and origin ACS 2023
- Neighborhood character
- Majority Hispanic (63%)
- Race & ethnicity
- Hispanic / Latino 63% Black 25% Two or more races 11% Asian 5% White 4% Native American 1% Pacific Islander 1%
- Hispanic origin (detail)
- Mexican 51%
- Foreign-born
- 37% · Canada, China, Vietnam
- Languages at home
- 37% English-only · Spanish 56% Other Asian/Pacific 2% Chinese 1%
Political lean MEDSL · Alameda
- 2024 margin
- Solid D (+53.6) · D 74.6% · R 21.0% · Other 4.4%
- 2008→2024 swing
- -5.9pp toward R · 2008: 59.5pp · 2024: 53.6pp
- All cycles
- 2024: D+53.6 2020: D+62.5 2016: D+64.4 2012: D+59.8 2008: D+59.5
Not yet ingested
- Civics
- —
Market trends
- HPI YoY
- ▼ -665.46%
- Current HPI
- 396.0247
- Rent YoY
- ▲ 1.58%
- Metro
- San Francisco-Oakland-Berkeley, CA
- State GDP YoY
- ▲ 3.21%
- F500 in state
- 116
Industry mix (Fortune 500 HQ in CA)
| Industry | F500 HQs | Revenue |
|---|---|---|
| Technology | 27 | $1,492B |
|
||
| Financial Services | 3 | $174B |
|
||
| Retail | 3 | $44B |
|
||
| Insurance | 3 | $26B |
|
||
| Media / Entertainment | 2 | $115B |
|
||
| Pharmaceuticals / Biotech | 2 | $62B |
|
||
Price history
+205.0% since first listed11 events — show timeline
- 2026-06-06 Listed $549,000 bridgeMLS, Bay East AOR, or Contra Costa AOR
- 2014-02-03 Sold (MLS) $258,000 bridgeMLS, Bay East AOR, or Contra Costa AOR
- 2014-01-30 Sold (Public Records) $258,000 Public Records
- 2014-01-02 Pending — bridgeMLS, Bay East AOR, or Contra Costa AOR
- 2013-12-02 Listed $279,000 bridgeMLS, Bay East AOR, or Contra Costa AOR
- 2008-08-23 Listing Removed — bridgeMLS, Bay East AOR, or Contra Costa AOR
- 2005-11-07 Sold (Public Records) $650,000 Public Records
- 2002-09-19 Sold (Public Records) $324,000 Public Records
- 2001-06-06 Sold (Public Records) $212,500 Public Records
- 2000-08-04 Sold (Public Records) $80,000 Public Records
- 1988-11-15 Sold (Public Records) $180,000 Public Records
Property tax history
-1.0%/yrLatest (2025): $6,533 · +4.3% YoY. Source: county tax records.
Cash-flow waterfall
monthlySold comps — $/sqft
last 12 mo · ≤1 miLoading sold comps…