29 Agnew St · Morton, MS
Flood risk 1/10 · Minimal
- FEMA flood zone
- X (unshaded)
- Chance of flooding over 30 yrs
- 0.0%
- Est. flood insurance / yr
- $507 – $1,088
Fire risk 4/10 · Minor
- Est. fire insurance / yr
- $1,241 – $2,305
Heat risk 6/10 · Moderate
- Hot days now (above 107°F)
- 7 days/yr
- Hot days in 30 yrs
- 21 days/yr
Wind risk 8/10 · Major
- Chance of severe wind over 30 yrs
- 80.0%
Air-quality risk 1/10 · Minimal
- Unhealthy air days now
- 0 days/yr
- Unhealthy air days in 30 yrs
- 0 days/yr
Risk factors via First Street. Map © Google.
Why this score? — see what drove the B+ grade
The composite is a weighted blend of 9 inputs, each scored 0–100. Each bar is that input's sub-score; the figure is the points it added to the 100-point composite (weight × sub-score).
- Cash flow +30.0/30.0
- 1% rule +10.0/10.0
- DSCR +10.0/10.0
- Appreciation +8.0/10.0
- ARV discount +7.5/15.0
- Livability +3.0/5.0
- Rent growth +2.5/5.0
- Condition / age +2.5/5.0
- Schools +2.4/10.0
$89,000
🖨 Deal sheet 📄 Offer letter ✓ Due diligence
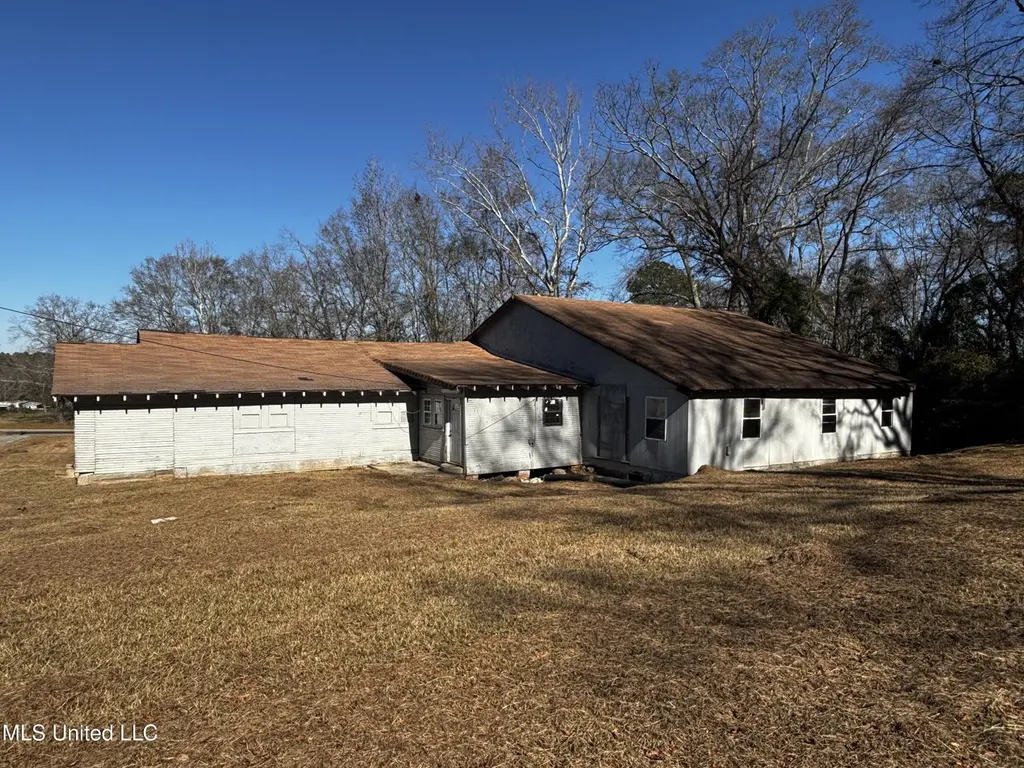
Listing remarks MLS
Versatile property offering endless possibilities! This space can be utilized as a residence, church, business, or multi-purpose investment property. Featuring a flexible floor plan and convenient location, it's ideal for investors, entrepreneurs, or organizations. With ample space and strong potential for customization or income generation, this property is ready for your vision. Don't miss this investor special with unlimited potential! Schedule your showing today.
Key facts
- Flexible floor plan
- Convenient location
- Ample space
Tags
Neighborhood map
What this means for you Summary
Snapshot
- This is a 5-bed/1.0-bath single-family listed at $89k.
Deal economics
- At list price, monthly cash flow is $484 ($6k/yr) — positive.
- The deal already cash-flows at list — no discount required.
- Meets the 1% rule at list price ($1k rent vs $89k).
- Recommended offer: $78k (12.0% below list) — sets the bar for market timing.
Location & tenants
- Location reads 59/100 on livability (#249 in MS) — a working-class tenant base; expect higher turnover. Strengths: crime A+, cost of living A+, housing A; Watch: schools F, amenities F, commute F.
- Scott County School District (rural): math 30% / reading 28% proficiency, ranked #71 of 130 in MS (top 55%) — low school quality limits family demand, transient renter base, plan for 1-2y turnover; 76% free/reduced lunch — lower-income household profile, screen leases tightly.
- Market conditions: 36 active listings in the ZIP; 19 units permitted in Scott County in 2024 (5 in 5+ unit buildings).
Forward outlook
- In year one you build about $6k of equity ($615 loan paydown + $5k appreciation (6.0% local appreciation)).
- Scott County population projected at -10% by 2050 — secular population decline; favor cash flow + early exit over multi-decade hold.
- At projected returns (6.0% appreciation + 3.0% rent growth), your $25k cash investment doubles in ~3 years — after that, you're playing with house money.
- By year 6, paydown + projected appreciation supports a ~$32k cash-out refi (75% LTV) — recoverable capital for the next deal without selling this one.
Negotiation context
- It's been on market 157 days — a 12% lower offer ($78k) is reasonable based on typical stale-listing flexibility.
- 3 sale attempts since 16y ago with the ask held roughly flat each time — persistent listings suggest the price (not the market) is what's stuck; bring a comps-based counter.
Risks & watch-outs
- Watch-outs: built in 1950 — expect roof / HVAC / electrical / plumbing capex.
- Climate carrying-cost: severe wind risk, 80% chance of damaging wind over 30y; extreme-heat days projected 7→21/yr by 2055 (HVAC capex compounding) — expect insurance premiums to compound above CPI over the hold.
Questions for the listing agent
- It's been on market 157 days. Have you received any prior offers? Is the seller open to a 12% concession, seller financing, or rate buy-down credit?
- Built in 1950 — when were the roof, HVAC, electrical panel, plumbing, and water heater last replaced?
- Why hasn't it sold? Are there any deal-killer items the seller is aware of (foundation, flood, title, zoning, code violations)?
- Is there a deadline driving the sale (1031 exchange, divorce, estate, relocation)? That informs how much negotiation room exists.
- Schools are F-rated, which usually means shorter tenancies and higher turnover. Who's the typical renter profile here, and what's been the actual vacancy rate?
- What's the average days-on-market for RENTAL listings here right now (not sales)? A rising rental-DOM trend means longer vacancies and softer asking-rent achievability than the comps imply.
- What's the recent tenant-quality profile in this submarket — average credit score on applications, eviction rate, late-payment / NSF rate, and stable-employment percentage? A property-management company in the area should have these aggregated.
- How much new for-sale + rental construction is in the pipeline within 1–3 miles? Heavy new supply typically softens prices + rents 12–24 months out; constrained supply supports both.
Investment metrics
- 1% rule
- 1.56% ✓
- Cap rate
- 12.82%
- Cash-on-cash
- 23.30%
- DSCR
- 2.04
- GRM
- 5.3
CMA / ARV
- ARV (median comp)
- $319,496
- List price
- $89,000
- Delta
- -72.14%
- Verdict
- UNDERPRICED
- Comps
- 2 within 2.0 mi
Projected returns pro-forma
5.95% appreciation · 3.0% rent growth · sell at horizon
- IRR
- 34.9%
- Equity multiple
- 3.26×
- Total profit
- $56,250
- Equity at exit
- $55,650
- IRR
- 32.5%
- Equity multiple
- 6.68×
- Total profit
- $141,444
- Equity at exit
- $100,662
Cash invested: $24,920 (down + closing). Projections, not guarantees.
Landlord ↔ Tenant lean methodology
- Overall (STATE)
- 90 Strongly Landlord-Friendly
- State Mississippi
- 90 Strongly Landlord-Friendly · R+11
- County
- — inherits STATE
- City
- — inherits STATE
ZIP-level market 39117
- Home prices YoY
- 3.8%
- Active inventory
- 36
- Price-to-rent
- 5.3×
Monthly cashflow live
- Estimated rent
- $1,391 medium interval (Pro) →
- Mortgage (P&I)
- −$467
- Tax est. 1.5%
- −$111 /mo · $1,335/yr
- Insurance
- −$37
- HOA
- −$0
- Vacancy / Maint / Mgmt
- −$292
- Net cashflow
- $484
Break-even live
UW: 25.0% down · 7.5% · 30yr · 1.5% tax · 5.0% vac · 8.0% maint · 8.0% mgmt
Financing live
Cash to close
- Down payment
- $22,250
- Closing costs
- $2,670
- Reserves months
- —
- Total cash needed
- —
Loan-product check · same deal, 3 products live
Conventional
25% down · 7.5% · 30yr
- Down + closing
- —
- Monthly P&I
- —
- Monthly cashflow
- —
- DSCR
- —
- Eligible?
- —
Personal DTI + credit; lowest rate.
DSCR
20% down · 8.5% · 30yr
- Down + closing
- —
- Monthly P&I
- —
- Monthly cashflow
- —
- DSCR
- —
- Eligible?
- —
No personal income docs; deal must DSCR.
Hard money
10% down · 12.0% · 12mo
- Down + closing
- —
- Monthly P&I
- —
- Monthly cashflow
- —
- DSCR
- —
- Eligible?
- —
Short-term bridge; refi at stabilization.
Listing history 17 events
-
2026-06-18days on market $89,000 Active 157 DOM
-
2026-06-17days on market $89,000 Active 156 DOM
-
2026-06-16days on market $89,000 Active 155 DOM
-
2026-06-15days on market $89,000 Active 154 DOM
-
2026-06-13days on market $89,000 Active 152 DOM
-
2026-06-12days on market $89,000 Active 151 DOM
-
2026-06-07days on market $89,000 Active 149 DOM
-
2026-06-04days on market $89,000 Active 146 DOM
-
2026-06-02days on market $89,000 Active 145 DOM
-
2026-06-01days on market $89,000 Active 144 DOM
-
2026-05-31days on market $89,000 Active 143 DOM
-
2026-01-06$89,000 Active 471-char remark
Show marketing remark (471 chars)
Versatile property offering endless possibilities! This space can be utilized as a residence, church, business, or multi-purpose investment property. Featuring a flexible floor plan and convenient location, it's ideal for investors, entrepreneurs, or organizations. With ample space and strong potential for customization or income generation, this property is ready for your vision. Don't miss this investor special with unlimited potential! Schedule your showing today.
-
2021-10-02historical
-
2013-10-21soldstatus
-
2010-10-20historical
-
2010-10-20$75,000
-
2010-06-10$85,000
ⓘ Source: listings_history table (triggers on properties + properties_extension) + one-shot
backfill from property_details.listing_events for pre-trigger history.
Climate risk First Street
- Flood 1/10 Low FEMA zone X (unshaded) · 0% chance over 30 yrs
- Wildfire 4/10 Moderate
- Heat 6/10 Major 7 d/yr ≥107°F today · 21 d/yr by 30 yrs out
- Wind 8/10 Severe 80% chance of damaging wind over 30 yrs
- Air quality 1/10 Low 0 unhealthy d/yr today · 0 by 30 yrs out
Nearby sold comps map
Loading sold comps map…
Walkable amenities ~0.75 mi
Loading nearby amenities…
Taxation est. · year 1
- Rental income
- $16,692
- − Mortgage interest
- −$4,985
- − Property taxes
- −$1,335
- − Insurance
- −$445
- − Repairs & maintenance
- −$1,335
- − Management
- −$1,335
- − Depreciation
- −$2,589
- Taxable income
- $4,667
- Est. tax owed @ 24.0%
- −$1,120
- After-tax cash flow
- $4,686/yr
For passive investors: Depreciation is non-cash, so a rental often shows a tax loss while cash-flowing — sheltering income. Rental losses are passive: they offset passive income freely, and up to $25,000/yr can offset ordinary (W-2) income if you actively participate and your MAGI is under $100k (phasing out to $0 by $150k); unused losses carry forward. On sale, claimed depreciation is recaptured at up to 25%, and gains may owe capital-gains tax (a 1031 exchange can defer both). Figures are a year-1 estimate at your 24.0% rate — not tax advice; consult a CPA.
Schools (NCES district)
- District
- Scott County School District
- NCES district ID
- 2803900
- Math proficiency
- 30% ▼ -7.00%
- Reading proficiency
- 28% ▼ -5.00%
- Median HH income
- $34,396
- Composite
- 23.9/100
- National rank
- #7793
- State rank
- #71 of 130 in MS
Livability — Morton
- Score
- 59/100
- State rank
- #249
- US rank
- #20218
Category grades
Schools grade is shown separately in the Schools card above.
Census & demographics
- Census place
- Morton, MS
- City population
- 9,638
- Population (ZIP)
- 9,638
Population outlook (Scott County) Hauer SSP2
- Today (2025)
- 28,200 people
- By 2030
- 27,923 · -1.0%
- By 2040
- 26,898 · -4.6%
- By 2050
- 25,341 · -10.1%
- By 2075
- 20,244 · -28.2%
- By 2100
- 13,845 · -50.9%
Race, ethnicity, and origin ACS 2023
- Neighborhood character
- Diverse neighborhood (Simpson 0.60)
- Race & ethnicity
- White 57% Black 20% Hispanic / Latino 19% Two or more races 8%
- Hispanic origin (detail)
- Mexican 10%
- Common ancestry
- Italian 1% Serbian 1%
- Foreign-born
- 2% · Canada
- Languages at home
- 83% English-only · Spanish 17%
Political lean MEDSL · Scott
- 2024 margin
- Strong R (+23.9) · D 37.7% · R 61.6%
- 2008→2024 swing
- -10.6pp toward R · 2008: -13.3pp · 2024: -23.9pp
- All cycles
- 2024: R+23.9 2020: R+18.2 2016: R+17.7 2012: R+9.0 2008: R+13.3
Not yet ingested
- Civics
- —
Market trends
- HPI YoY
- ▲ 5.95%
- Current HPI
- 163.0304
- Rent YoY
- —
- Metro
- —
- State GDP YoY
- —
- F500 in state
- 0
Price history
+4.7% since first listed6 events — show timeline
- 2026-01-06 Listed $89,000 MLSU
- 2021-10-02 Listing Removed — MLSU
- 2013-10-21 Sold (Public Records) — Public Records
- 2010-10-20 Listed $75,000 MLSU
- 2010-10-20 Listing Removed — MLSU
- 2010-06-10 Listed $85,000 MLSU
Cash-flow waterfall
monthlySold comps — $/sqft
last 12 mo · ≤1 miLoading sold comps…