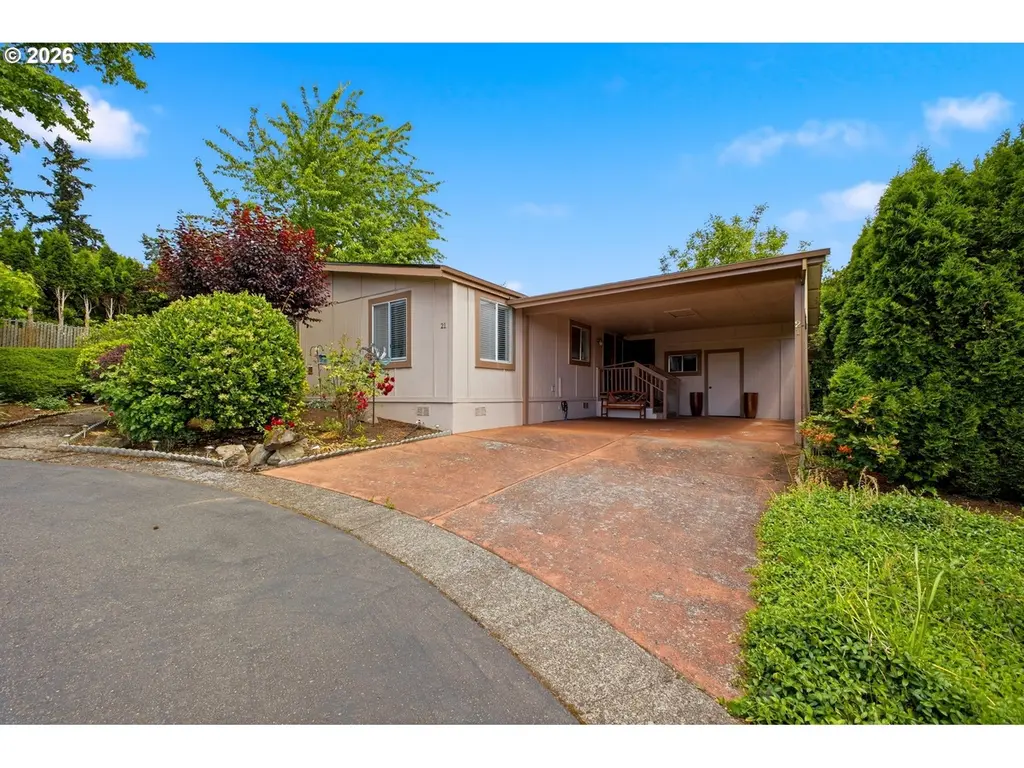
5701 NE St Johns Rd #21 · Minnehaha, WA
Flood risk No data
- FEMA flood zone
- —
- Chance of flooding over 30 yrs
- —
- Est. flood insurance / yr
- —
Fire risk No data
- Est. fire insurance / yr
- —
Heat risk No data
- Hot days now (above threshold)
- —
- Hot days in 30 yrs
- —
Wind risk No data
- Chance of severe wind over 30 yrs
- —
Air-quality risk No data
- Unhealthy air days now
- —
- Unhealthy air days in 30 yrs
- —
Risk factors via First Street. Map © Google.
Why this score? — see what drove the B grade
The composite is a weighted blend of 9 inputs, each scored 0–100. Each bar is that input's sub-score; the figure is the points it added to the 100-point composite (weight × sub-score).
- Cash flow +30.0/30.0
- ARV discount +10.7/15.0
- DSCR +10.0/10.0
- 1% rule +7.6/10.0
- Schools +4.3/10.0
- Livability +4.2/5.0
- Rent growth +3.0/5.0
- Condition / age +2.5/5.0
- Appreciation +0.0/10.0
$189,000
🖨 Deal sheet 📄 Offer letter ✓ Due diligence
Listing remarks MLS
1990 SILVERWOOD MANUFACTURED/OAK HAVEN 55+ COMMUNITY. NEW PAINT IN & OUT, NEW CARPET & VINYL, NEW ROOF, MSTR BDR W/WLK-IN CLOSET, & LG BATH DBL CARPORT W/SHED. ALL APPLIANCES STAY. NEW WASHER/DRYER & DISHWASHER $320 MO FEE. FOURTH DRIVEWAY ON THE
Key facts
- Primary suite
- Dining area
- Large living room
Tags
Property features AI
Finance
- Other: Zoned R-18
- Financial info: Land lease required; lot rent $900 monthly (lease expires December 31, 2026)
- HOA & community: Oak Haven Mobile Home Park (senior community); Park provides water and sewer
Exterior
- Parking: Covered carport
- Utilities: Public water; Public sewer; Electric service; Cable internet
- Home design: Manufactured home in park; Single-story; Not attached; Model: 60/28; No view
- Construction: Built in 1991; Composition roof; Skirting foundation
- Exterior features: T-111 siding; Paved road access; Secluded lot
Interior
- Kitchen: Free-standing range; Free-standing refrigerator; Electric hot water
- Bedrooms: Primary bedroom (Main level); 2nd bedroom (Main level); 3rd bedroom (Main level)
- Flooring: Luxury vinyl plank; Carpet
- Bathrooms: 2 full bathrooms (both on main level)
- Heating & cooling: Forced air heating; Heat pump cooling
- Interior features: Luxury vinyl plank flooring; Wall-to-wall carpet; Vinyl window frames; Basement hatch door
- Laundry & utility: Electric fuel for appliances
Neighborhood map
What this means for you Summary
Snapshot
- This is a 3-bed/2.0-bath manufactured listed at $189k.
Deal economics
- At list price, monthly cash flow is $770 ($9k/yr) — positive.
- The deal already cash-flows at list — no discount required.
- Meets the 1% rule at list price ($2k rent vs $189k).
- Cap rate 11.2% vs local median 2.8% in Minnehaha — top-decile yield for the area; either an underpriced asset or a hidden risk that comps aren't pricing in. Stress-test before assuming the spread holds.
Location & tenants
- Location reads 83/100 on livability (#47 in WA, #847 nationally) — a professional / high-income tenant draw. Strengths: commute A+, employment A+, housing A+; Watch: amenities F, cost of living D-.
- Vancouver School District (suburban): math 43% / reading 53% proficiency, ranked #156 of 291 in WA (top 54%) — families likely to look elsewhere, expect single-tenant / working-renter base with shorter leases.
- Zoned schools: Minnehaha Elementary School (517 students, 59% FRL); Jason Lee Middle School (532 students, 59% FRL); Hudson'S Bay High School (1,143 students, 64% FRL) — zoned schools average 61% FRL vs 44% district-wide (16 pts higher); higher-poverty schools than district average — tighter screening recommended.
- Market conditions: Rents rising (+2.0%/yr); 266 active listings in the ZIP; 31 comparable units currently listed for rent nearby; rentals leasing fast (median 8d on market — plan ~1-2 weeks tenant-placement turnaround); solid renter incomes; 3,547 units permitted in Clark County in 2024 (1,361 in 5+ unit buildings).
- This rent runs 37% of the median local income ($77k/yr) — at the standard rent-burdened threshold; future hikes will face affordability resistance.
Forward outlook
- Local home prices are declining (-3.0%/yr); year-one equity from $1k of loan paydown is wiped out by about $6k of value loss. Plan a longer hold.
- Clark County population projected at +29% by 2050 — long-run rental-demand tailwind backs the buy-and-hold thesis.
- At projected returns (-3.0% appreciation + 2.0% rent growth), your $53k cash investment doubles in ~8 years — after that, you're playing with house money.
Negotiation context
- Only 7 days on market — expect competitive offers; lowballing is unlikely to land.
- 3 sale attempts since 27y ago with the ask held roughly flat each time — persistent listings suggest the price (not the market) is what's stuck; bring a comps-based counter.
- Current owner paid $65k; list at $189k implies a 191% gain — meaningful room to come down on a strong offer.
Questions for the listing agent
- Is there a deadline driving the sale (1031 exchange, divorce, estate, relocation)? That informs how much negotiation room exists.
- What's the average days-on-market for RENTAL listings here right now (not sales)? A rising rental-DOM trend means longer vacancies and softer asking-rent achievability than the comps imply.
- What's the recent tenant-quality profile in this submarket — average credit score on applications, eviction rate, late-payment / NSF rate, and stable-employment percentage? A property-management company in the area should have these aggregated.
- How much new for-sale + rental construction is in the pipeline within 1–3 miles? Heavy new supply typically softens prices + rents 12–24 months out; constrained supply supports both.
Investment metrics
- 1% rule
- 1.26% ✓
- Cap rate
- 11.18%
- Cash-on-cash
- 17.47%
- DSCR
- 1.78
- GRM
- 6.6
CMA / ARV
- ARV (on-the-fly)
- $203,616
- Comps found
- 7
Show comp detail 7 sales within ~0.75 mi
| Address | Dist | Beds/Ba | Sqft | Sold | Price | $/sf | Match |
|---|---|---|---|---|---|---|---|
| 5701 NE ST Johns Rd #58 | 0.01mi | 2/2.0 (-1) | 1,632 (+1%) | 6mo | $185,000 | $113 | 88 |
| 5701 NE St Johns Rd #86 | 0.01mi | 3/2.0 | 1,512 (-6%) | 7mo | $212,000 | $140 | 82 |
| 5701 NE ST Johns Rd #47 | 0.01mi | 3/2.0 | 1,548 (-4%) | 19mo | $199,900 | $129 | 76 |
| 5701 NE St Johns Rd #60 | 0.01mi | 3/2.0 | 1,412 (-13%) | 4mo | $177,500 | $126 | 75 |
| 5701 NE ST Johns Rd #4 | 0.01mi | 2/2.0 (-1) | 1,392 (-14%) | 4mo | $167,000 | $120 | 68 |
| 5701 NE ST Johns Rd #40 | 0.01mi | 2/2.0 (-1) | 1,484 (-8%) | 20mo | $218,000 | $147 | 64 |
| 5701 NE ST Johns Rd #74 | 0.01mi | 3/2.0 | 1,454 (-10%) | 24mo | $179,900 | $124 | 63 |
Match score weights: distance 35% · size 25% · config 20% · recency 20%. Top-matched comps best support the ARV.
Projected returns pro-forma
-3.0% appreciation · 2.05% rent growth · sell at horizon
- IRR
- 7.9%
- Equity multiple
- 1.30×
- Total profit
- $16,107
- Equity at exit
- $28,181
- IRR
- 16.3%
- Equity multiple
- 2.28×
- Total profit
- $67,798
- Equity at exit
- $16,341
Cash invested: $52,920 (down + closing). Projections, not guarantees.
Landlord ↔ Tenant lean methodology
- Overall (STATE)
- 28 Tenant-Leaning
- State Washington
- 28 Tenant-Leaning · D+8
- County
- — inherits STATE
- City
- — inherits STATE
ZIP-level market 98661
- Rents YoY
- 2.0%
- Active inventory
- 266
- Price-to-rent
- 6.6×
Monthly cashflow live
- Estimated rent
- $2,378 high interval (Pro) →
- Mortgage (P&I)
- −$991
- Tax from tax record
- −$39 /mo · $464/yr
- Insurance
- −$79
- HOA
- −$0
- Vacancy / Maint / Mgmt
- −$499
- Net cashflow
- $770
Break-even live
UW: 25.0% down · 7.5% · 30yr · 1.5% tax · 5.0% vac · 8.0% maint · 8.0% mgmt
Financing live
Cash to close
- Down payment
- $47,250
- Closing costs
- $5,670
- Reserves months
- —
- Total cash needed
- —
Loan-product check · same deal, 3 products live
Conventional
25% down · 7.5% · 30yr
- Down + closing
- —
- Monthly P&I
- —
- Monthly cashflow
- —
- DSCR
- —
- Eligible?
- —
Personal DTI + credit; lowest rate.
DSCR
20% down · 8.5% · 30yr
- Down + closing
- —
- Monthly P&I
- —
- Monthly cashflow
- —
- DSCR
- —
- Eligible?
- —
No personal income docs; deal must DSCR.
Hard money
10% down · 12.0% · 12mo
- Down + closing
- —
- Monthly P&I
- —
- Monthly cashflow
- —
- DSCR
- —
- Eligible?
- —
Short-term bridge; refi at stabilization.
Rent comps 31 comps
| Address | Beds | Baths | Sqft | Rent | $/sqft | DOM | Units | Dist |
|---|---|---|---|---|---|---|---|---|
| 3544 NE 61st Way Vancouver, WA | 4.0 | 2.5 | 1661 | $2,595 | $1.56 | 23d | 1 | 0.24mi |
| 5009 NE 29th Ave Vancouver, WA | 3.0 | 2.5 | 1588 | $3,200 | $2.02 | 3d | 1 | 0.45mi |
| 4802 NE 37th Ct Vancouver, WA | 3.0 | 2.5 | 1648 | $2,495 | $1.51 | 23d | 1 | 0.46mi |
| 3503 NE 49th St Vancouver, WA | 2.0 | 1.5 | 1100 | $1,409 | $1.28 | 23d | 1 | 0.47mi |
| 3805 NE 49th St Unit B204 Vancouver, WA | 3.0 | 2.0 | 1325 | $1,899 | $1.43 | 23d | 1 | 0.47mi |
| 5010 NE 29th Ave Vancouver, WA | 3.0 | 2.5 | 1585 | $2,495 | $1.57 | 3d | 1 | 0.47mi |
| 4941 NE 24th Ave Vancouver, WA | 4.0 | 2.5 | 2210 | $2,998 | $1.36 | 3d | 1 | 0.69mi |
| 3608 NE 42nd St Vancouver, WA | 3.0 | 2.5 | 1776 | $2,495 | $1.40 | 23d | 1 | 0.73mi |
| 5200 NE 19th Ave Vancouver, WA | 4.0 | 1.0 | 2000 | $2,620 | $1.31 | 2d | 1 | 0.92mi |
| 3008 NE 74th St Vancouver, WA | 3.0 | 2.5 | 1834 | $2,450 | $1.34 | 16d | 1 | 0.95mi |
| 5313 NE 68th St Vancouver, WA | 2.0–3.0 | 2.0 | 1108 | $1,825 | $1.65 | 16d | 2 | 0.96mi |
| 3005 NE 75th St Vancouver, WA | 3.0 | 2.5 | 1849 | $2,615 | $1.41 | 22d | 1 | 0.97mi |
| 5811 NE 56th Pl Vancouver, WA | 3.0 | 2.5 | 1608 | $2,495 | $1.55 | 23d | 1 | 0.99mi |
| 7714 NE 39th Ct Vancouver, WA | 1.0–2.0 | 1.0–2.0 | 921 | $2,035 | $2.21 | 2d | 12 | 1.01mi |
| 5404 NE 45th St Vancouver, WA | 3.0 | 2.0 | 1276 | $2,795 | $2.19 | 7d | 1 | 1.04mi |
| 5917 NE 58th Ave Vancouver, WA | 3.0 | 2.5 | 1498 | $2,350 | $1.57 | 23d | 1 | 1.07mi |
| 5917 NE 58th St Vancouver, WA | 1.0–3.0 | 1.0–2.0 | 1162 | $2,075 | $1.78 | 7d | 3 | 1.11mi |
| 4316 NE 34th Cir Vancouver, WA | 3.0 | 2.5 | 1482 | $2,450 | $1.65 | 2d | 1 | 1.18mi |
| 6008 NE 64th St Vancouver, WA | 3.0 | 3.0 | 1288 | $2,184 | $1.70 | 7d | 3 | 1.22mi |
| 8007 NE 38th Ave Vancouver, WA | 3.0 | 2.5 | 1477 | $2,395 | $1.62 | 3d | 1 | 1.22mi |
| 6313 NE 61st Ave Vancouver, WA | 3.0 | 2.5 | 1346 | $2,595 | $1.93 | 2d | 1 | 1.27mi |
| 4500 Nicholson Rd Vancouver, WA | 2.0–3.0 | 2.0 | 1034 | $2,154 | $2.08 | 2d | 8 | 1.27mi |
| 8111 NE 36th Ct Vancouver, WA | 3.0 | 2.5 | 1512 | $2,295 | $1.52 | 7d | 1 | 1.28mi |
| 2702 E 33rd St Unit 1334336P Vancouver, WA | 3.0 | 2.0 | 1496 | $5,271 | $3.52 | 23d | 1 | 1.29mi |
| NE 47 NE 47th Ct Vancouver, WA | 3.0 | 2.5 | 1475 | $2,850 | $1.93 | 1d | 5 | 1.31mi |
| 3100 Falk Rd Vancouver, WA | 2.0–3.0 | 2.0–3.0 | 1234 | $2,299 | $1.86 | 1d | 4 | 1.35mi |
| 2301 NE 81st St Vancouver, WA | 1.0–3.0 | 1.0–2.0 | 1080 | $2,550 | $2.36 | 1d | 10 | 1.35mi |
| 8225 NE St Johns Rd Vancouver, WA | 3.0 | 2.0 | 1584 | $2,048 | $1.29 | 3d | 1 | 1.36mi |
| 1307 NE 70th St Vancouver, WA | 3.0 | 2.0 | 1802 | $2,829 | $1.57 | 23d | 1 | 1.38mi |
| 5406 NE 34th St Unit A1 Vancouver, WA | 3.0 | 1.5 | 1124 | $2,095 | $1.86 | 4d | 1 | 1.42mi |
| 2920 Falk Rd Vancouver, WA | 2.0–3.0 | 2.5–3.0 | 1268 | $2,565 | $2.02 | 1d | 1 | 1.44mi |
Listing history 9 events
-
2026-06-18days on market $189,000 Active 7 DOM
-
2026-06-17days on market $189,000 Active 6 DOM
-
2026-06-16days on market $189,000 Active 5 DOM
-
2026-06-15days on market $189,000 Active 4 DOM
-
2026-06-13days on market $189,000 Active 2 DOM
-
2026-06-09days on market $189,000 Active 6 DOM
-
2026-06-08days on market $189,000 Active 5 DOM
-
2026-06-07remarks 503-char remark
-
2026-06-07$189,000 Active 4 DOM
ⓘ Source: listings_history table (triggers on properties + properties_extension) + one-shot
backfill from property_details.listing_events for pre-trigger history.
Tax reassessment forecast WA · Resets to sale price
- Current annual tax
- $464 · $39/mo
- Projected year-2 tax
- $1,852 · $154/mo
- Expected delta
- +$1,388/yr (+$116/mo · 299.4%)
ⓘ Screening estimate from a state-policy table — verify with the county assessor before closing.
Nearby sold comps map
Loading sold comps map…
Walkable amenities ~0.75 mi
Loading nearby amenities…
Taxation est. · year 1
- Rental income
- $28,542
- − Mortgage interest
- −$10,587
- − Property taxes
- −$464
- − Insurance
- −$945
- − Repairs & maintenance
- −$2,283
- − Management
- −$2,283
- − Depreciation
- −$5,498
- Taxable income
- $6,481
- Est. tax owed @ 24.0%
- −$1,555
- After-tax cash flow
- $7,690/yr
For passive investors: Depreciation is non-cash, so a rental often shows a tax loss while cash-flowing — sheltering income. Rental losses are passive: they offset passive income freely, and up to $25,000/yr can offset ordinary (W-2) income if you actively participate and your MAGI is under $100k (phasing out to $0 by $150k); unused losses carry forward. On sale, claimed depreciation is recaptured at up to 25%, and gains may owe capital-gains tax (a 1031 exchange can defer both). Figures are a year-1 estimate at your 24.0% rate — not tax advice; consult a CPA.
Schools (NCES district)
- District
- Vancouver School District
- NCES district ID
- 5309270
- Math proficiency
- 43% ▬ 0.00%
- Reading proficiency
- 53% ▬ 0.00%
- Median HH income
- $52,562
- Composite
- 43.45/100
- National rank
- #6479
- State rank
- #156 of 291 in WA
Livability — Minnehaha
- Score
- 83/100
- State rank
- #47
- US rank
- #847
Category grades
Schools grade is shown separately in the Schools card above.
Census & demographics
- Census place
- Minnehaha, WA
- County
- Clark County · 513,189 people
- Metro
- Portland-Vancouver-Hillsboro, OR-WA
- Population (ZIP)
- 50,743
- Household income
- $76,913
- Rent vs Own
- Severe rent burden
- 2384.0
Population outlook (Clark County) Hauer SSP2
- Today (2025)
- 529,610 people
- By 2030
- 563,242 · +6.4%
- By 2040
- 625,905 · +18.2%
- By 2050
- 681,558 · +28.7%
- By 2075
- 805,967 · +52.2%
- By 2100
- 877,450 · +65.7%
Race, ethnicity, and origin ACS 2023
- Neighborhood character
- Majority White (64%)
- Race & ethnicity
- White 64% Hispanic / Latino 21% Two or more races 14% Black 4% Asian 3% Pacific Islander 2%
- Hispanic origin (detail)
- Mexican 18%
- Common ancestry
- Lithuanian 3% Portuguese 3% Subsaharan African 3%
- Foreign-born
- 15% · Canada, Vietnam
- Languages at home
- 76% English-only · Spanish 14% Russian/Polish/Slavic 4% Other Indo-European 2%
Political lean MEDSL · Clark
- 2024 margin
- Lean D (+7.0) · D 52.1% · R 45.1% · Other 2.8%
- 2008→2024 swing
- +0.9pp no change · 2008: 6.1pp · 2024: 7.0pp
- All cycles
- 2024: D+7.0 2020: D+5.1 2016: D+0.1 2012: D+0.1 2008: D+6.1
Not yet ingested
- Civics
- —
Market trends
- HPI YoY
- ▼ -567.83%
- Current HPI
- 308.3632
- Rent YoY
- ▲ 2.05%
- Metro
- Portland-Vancouver-Hillsboro, OR-WA
- State GDP YoY
- ▲ 4.65%
- F500 in state
- 22
Industry mix (Fortune 500 HQ in WA)
| Industry | F500 HQs | Revenue |
|---|---|---|
| Retail | 2 | $269B |
|
||
| Technology / Retail | 1 | $638B |
|
||
| Technology | 1 | $245B |
|
||
| Telecommunications | 1 | $38B |
|
||
| Food / Beverage | 1 | $36B |
|
||
| Automotive / Trucks | 1 | $34B |
|
||
Price history
+293.8% since first listed5 events — show timeline
- 2026-06-03 Listed $189,000 RMLS
- 2001-03-08 Sold (MLS) $65,000 RMLS
- 2000-12-27 Listed $66,500 RMLS
- 2000-03-16 Sold (MLS) $43,000 RMLS
- 1999-12-17 Listed $48,000 RMLS
Property tax history
-3.5%/yrLatest (2020): $464 · +25.3% YoY. Source: county tax records.
Cash-flow waterfall
monthlySold comps — $/sqft
last 12 mo · ≤1 miLoading sold comps…