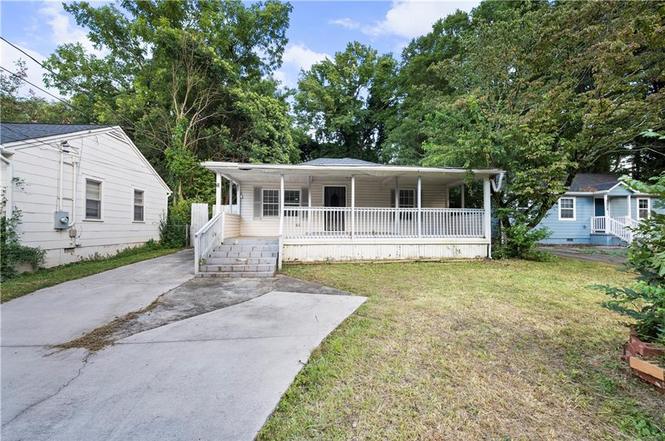
3024 Grand Ave SW · Atlanta, GA
Flood risk 1/10 · Minimal
- FEMA flood zone
- X (unshaded)
- Chance of flooding over 30 yrs
- 0.0%
- Est. flood insurance / yr
- $473 – $860
Fire risk 1/10 · Minimal
- Est. fire insurance / yr
- $963 – $1,789
Heat risk 5/10 · Moderate
- Hot days now (above 104°F)
- 6 days/yr
- Hot days in 30 yrs
- 14 days/yr
Wind risk 6/10 · Moderate
- Chance of severe wind over 30 yrs
- 27.0%
Air-quality risk 4/10 · Minor
- Unhealthy air days now
- 4 days/yr
- Unhealthy air days in 30 yrs
- 6 days/yr
Risk factors via First Street. Map © Google.
Why this score? — see what drove the C+ grade
The composite is a weighted blend of 9 inputs, each scored 0–100. Each bar is that input's sub-score; the figure is the points it added to the 100-point composite (weight × sub-score).
- Cash flow +20.7/30.0
- ARV discount +15.0/15.0
- 1% rule +6.7/10.0
- DSCR +6.6/10.0
- Livability +4.2/5.0
- Rent growth +3.3/5.0
- Schools +2.7/10.0
- Condition / age +2.5/5.0
- Appreciation +0.0/10.0
$165,000
🖨 Deal sheet 📄 Offer letter ✓ Due diligence
Listing remarks
This 3b 2ba renovated home in a fast-growing Atlanta neighborhood offers modern style and comfort. With vaulted ceilings accented by wooden beams and an open kitchen concept, it’s perfect for relaxation and entertaining. The spacious master suite features French doors leading to a large covered deck, while natural light floods the home through windows and doors. The updated bathrooms showcase designer tile work and sleek vanities, complementing the home's mid-century modern vibe. All systems have been modernized, including an upgraded electrical system with abundant recessed lighting. Located less than 10 minutes from the airport and downtown, this home is a gem!
Key facts
- Renovated home
- Open kitchen concept
- Updated bathrooms
Tags
Neighborhood map
What this means for you Summary
Snapshot
- This is a 3-bed/2.0-bath single-family listed at $165k.
Deal economics
- At list price, monthly cash flow is $222 ($3k/yr) — positive.
- The deal already cash-flows at list — no discount required.
- Meets the 1% rule at list price ($2k rent vs $165k).
- Recommended offer: $145k (12.0% below list) — sets the bar for market timing.
- Cap rate 7.9% vs local median 3.1% in Atlanta — top-decile yield for the area; either an underpriced asset or a hidden risk that comps aren't pricing in. Stress-test before assuming the spread holds.
Location & tenants
- Location reads 83/100 on livability (#6 in GA, #919 nationally) — a professional / high-income tenant draw. Strengths: amenities A+, commute A+, housing A+; Watch: cost of living C-.
- Atlanta Public Schools (urban): math 28% / reading 35% proficiency, ranked #80 of 174 in GA (top 46%) — families likely to look elsewhere, expect single-tenant / working-renter base with shorter leases; 71% free/reduced lunch — lower-income household profile, screen leases tightly.
- Zoned schools: Emma Hutchinson Elementary School (math 5% / reading 5%, grade F, #1,160 of 1,228 statewide, top 98%, 297 students, 100% FRL); Crawford Long Middle School (math 2% / reading 8%, grade F, #462 of 470 statewide, top 99%, 705 students, 100% FRL); South Atlanta High School (math 2% / reading 12%, grade F, #385 of 424 statewide, top 92%, 928 students, 100% FRL) — zoned schools average 100% FRL vs 71% district-wide (29 pts higher); higher-poverty schools than district average — tighter screening recommended.
- Zoned-school proficiency averages 6% at this address vs 32% district-wide (-26 pts) — the specific schools serving this property underperform the Atlanta Public Schools average; the district grade overstates school quality for this exact location.
- Market conditions: Rents rising (+3.2%/yr); 378 active listings in the ZIP; 40 comparable units currently listed for rent nearby; rentals at typical pace (median 24d on market — plan ~3-4 weeks tenant-placement turnaround); 11,565 units permitted in Fulton County in 2024 (8,159 in 5+ unit buildings).
- At $1,938/mo this rent would consume 46% of the median local household income ($51k/yr) (locally 2962% of renters already pay >50% of income on rent) — very limited rent-growth headroom before tenants either downsize or default.
Forward outlook
- Local home prices are declining (-3.0%/yr); year-one equity from $1k of loan paydown is wiped out by about $5k of value loss. Plan a longer hold.
- Fulton County population projected at +38% by 2050 — long-run rental-demand tailwind backs the buy-and-hold thesis.
Negotiation context
- It's been on market 206 days — a 12% lower offer ($145k) is reasonable based on typical stale-listing flexibility.
- 12 sale attempts since 6y ago; this cycle's ask has dropped $60k (27%) from the opening price — seller is motivated, your offer sets the floor, not the list.
Risks & watch-outs
- Watch-outs: property tax is 2.7% of price; built in 1940 — expect roof / HVAC / electrical / plumbing capex.
- Climate carrying-cost: major wind risk, 27% chance of damaging wind over 30y; extreme-heat days projected 6→14/yr by 2055 (HVAC capex compounding) — expect insurance premiums to compound above CPI over the hold.
Questions for the listing agent
- It's been on market 206 days. Have you received any prior offers? Is the seller open to a 12% concession, seller financing, or rate buy-down credit?
- Built in 1940 — when were the roof, HVAC, electrical panel, plumbing, and water heater last replaced?
- Property tax is high relative to price — has the assessment been appealed recently, and will the sale trigger a re-assessment?
- Why hasn't it sold? Are there any deal-killer items the seller is aware of (foundation, flood, title, zoning, code violations)?
- Is there a deadline driving the sale (1031 exchange, divorce, estate, relocation)? That informs how much negotiation room exists.
- What's the average days-on-market for RENTAL listings here right now (not sales)? A rising rental-DOM trend means longer vacancies and softer asking-rent achievability than the comps imply.
- What's the recent tenant-quality profile in this submarket — average credit score on applications, eviction rate, late-payment / NSF rate, and stable-employment percentage? A property-management company in the area should have these aggregated.
- How much new for-sale + rental construction is in the pipeline within 1–3 miles? Heavy new supply typically softens prices + rents 12–24 months out; constrained supply supports both.
Investment metrics
- 1% rule
- 1.17% ✓
- Cap rate
- 7.91%
- Cash-on-cash
- 5.78%
- DSCR
- 1.26
- GRM
- 7.1
CMA / ARV
- ARV (on-the-fly)
- $238,596
- Comps found
- 11
Show comp detail 11 sales within ~0.75 mi
| Address | Dist | Beds/Ba | Sqft | Sold | Price | $/sf | Match |
|---|---|---|---|---|---|---|---|
| 523 Mount Zion | 0.07mi | 3/2.0 | 1,234 (-8%) | 11mo | $255,000 | $207 | 74 |
| 2894 3rd Ave SW | 0.12mi | 3/1.0 | 1,250 (-7%) | 9mo | $115,900 | $93 | 71 |
| 2996 1st Ave SW | 0.19mi | 3/2.0 | 1,294 (-4%) | 17mo | $224,000 | $173 | 71 |
| 272 Mount Zion Rd | 0.20mi | 3/1.0 | 1,320 (-2%) | 16mo | $220,000 | $167 | 70 |
| 329 Maple St | 0.22mi | 2/2.0 (-1) | 1,369 (+2%) | 18mo | $315,000 | $230 | 67 |
| 338 Mount Zion Rd | 0.10mi | 3/2.0 | 1,189 (-12%) | 12mo | $210,500 | $177 | 66 |
| 2969 5th St SW | 0.29mi | 3/2.0 | 1,300 (-4%) | 22mo | $245,000 | $188 | 62 |
| 684 Campbell Cir | 0.50mi | 3/2.0 | 1,339 (-1%) | 18mo | $305,000 | $228 | 61 |
| 2966 1st Ave SW | 0.24mi | 3/2.5 | 1,476 (+10%) | 18mo | $270,000 | $183 | 56 |
| 3024 Wanda Cir | 0.37mi | 3/1.0 | 1,169 (-13%) | 15mo | $175,000 | $150 | 44 |
| 3128 Waters Rd SW | 0.66mi | 3/1.5 | 1,150 (-15%) | 3mo | $106,500 | $93 | 40 |
Match score weights: distance 35% · size 25% · config 20% · recency 20%. Top-matched comps best support the ARV.
Projected returns pro-forma
-3.0% appreciation · 3.23% rent growth · sell at horizon
- IRR
- -7.0%
- Equity multiple
- 0.74×
- Total profit
- $-11,990
- Equity at exit
- $24,602
- IRR
- 3.0%
- Equity multiple
- 1.22×
- Total profit
- $10,191
- Equity at exit
- $14,266
Cash invested: $46,200 (down + closing). Projections, not guarantees.
Landlord ↔ Tenant lean methodology
- Overall (STATE)
- 90 Strongly Landlord-Friendly
- State Georgia
- 90 Strongly Landlord-Friendly · R+3
- County
- — inherits STATE
- City
- — inherits STATE
ZIP-level market 30315
- Rents YoY
- 3.2%
- Active inventory
- 378
- Price-to-rent
- 7.1×
Monthly cashflow live
- Estimated rent
- $1,938 high interval (Pro) →
- Mortgage (P&I)
- −$865
- Tax from tax record
- −$374 /mo · $4,493/yr
- Insurance
- −$69
- HOA
- −$0
- Vacancy / Maint / Mgmt
- −$407
- Net cashflow
- $222
Break-even live
UW: 25.0% down · 7.5% · 30yr · 1.5% tax · 5.0% vac · 8.0% maint · 8.0% mgmt
Financing live
Cash to close
- Down payment
- $41,250
- Closing costs
- $4,950
- Reserves months
- —
- Total cash needed
- —
Loan-product check · same deal, 3 products live
Conventional
25% down · 7.5% · 30yr
- Down + closing
- —
- Monthly P&I
- —
- Monthly cashflow
- —
- DSCR
- —
- Eligible?
- —
Personal DTI + credit; lowest rate.
DSCR
20% down · 8.5% · 30yr
- Down + closing
- —
- Monthly P&I
- —
- Monthly cashflow
- —
- DSCR
- —
- Eligible?
- —
No personal income docs; deal must DSCR.
Hard money
10% down · 12.0% · 12mo
- Down + closing
- —
- Monthly P&I
- —
- Monthly cashflow
- —
- DSCR
- —
- Eligible?
- —
Short-term bridge; refi at stabilization.
Rent comps 40 comps
| Address | Beds | Baths | Sqft | Rent | $/sqft | DOM | Units | Dist |
|---|---|---|---|---|---|---|---|---|
| 2875 3rd Ave SW Unit A Atlanta, GA | 2.0 | 1.0 | 900 | $1,245 | $1.38 | 2d | 1 | 0.21mi |
| 278 Moreland Way Atlanta, GA | 3.0 | 2.0 | 1000 | $1,945 | $1.95 | 24d | 1 | 0.22mi |
| 231 Maple St Atlanta, GA | 3.0 | 2.0 | 1068 | $1,645 | $1.54 | 43d | 1 | 0.35mi |
| 3116 Jackson St Atlanta, GA | 2.0 | 2.0 | 1016 | $1,900 | $1.87 | 43d | 1 | 0.35mi |
| 2959 Forrest Hills Dr SW Atlanta, GA | 1.0–2.0 | 1.0–1.5 | 925 | $1,250 | $1.35 | 13d | 1 | 0.36mi |
| 2959 Forrest Hills Dr SW Atlanta, GA | 1.0–2.0 | 1.0–1.5 | 925 | $1,250 | $1.35 | 16d | 2 | 0.36mi |
| 3160 Lake Ave Unit NA Hapeville, GA | 4.0 | 1.5 | 1680 | $2,095 | $1.25 | 24d | 1 | 0.41mi |
| 735 Oak Dr Hapeville, GA | 2.0 | 1.0 | 1053 | $1,550 | $1.47 | 22d | 1 | 0.42mi |
| 3166 Jackson St Atlanta, GA | 3.0 | 2.0 | 1650 | $1,595 | $0.97 | 24d | 1 | 0.45mi |
| 2783 Grand Ave SW Atlanta, GA | 4.0 | 2.0 | 1644 | $2,600 | $1.58 | 24d | 1 | 0.46mi |
| 535 Lake Dr Atlanta, GA | 3.0 | 2.0 | 1080 | $2,275 | $2.11 | 43d | 1 | 0.48mi |
| 3162 Oakdale Rd Atlanta, GA | 3.0 | 1.0 | 1040 | $3,200 | $3.08 | 43d | 1 | 0.54mi |
| 436 Grady Pl Atlanta, GA | 3.0 | 2.0 | 1425 | $2,100 | $1.47 | 15d | 1 | 0.54mi |
| 3066 Waters Rd SW Atlanta, GA | 3.0 | 1.0 | 1144 | $1,395 | $1.22 | 20d | 1 | 0.58mi |
| 3054 Waters Rd SW Atlanta, GA | 3.0 | 1.0 | 891 | $1,800 | $2.02 | 7d | 1 | 0.58mi |
| 45 Baker Dr SW Atlanta, GA | 3.0 | 2.0 | 1056 | $1,600 | $1.52 | 24d | 1 | 0.60mi |
| 518 North Ave Atlanta, GA | 2.0 | 1.5 | 1096 | $2,150 | $1.96 | 10d | 1 | 0.61mi |
| 3301 Old Jonesboro Rd Atlanta, GA | 2.0 | 1.0 | 899 | $2,250 | $2.50 | 5d | 1 | 0.65mi |
| 3335 Dogwood Dr Hapeville, GA | 3.0 | 3.5 | 1670 | $3,020 | $1.81 | 12d | 1 | 0.75mi |
| 2932 Palm Dr Atlanta, GA | 3.0 | 2.5 | 1589 | $3,200 | $2.01 | 4d | 1 | 0.79mi |
| 2952 Palm Dr Atlanta, GA | 3.0 | 2.0 | 1120 | $1,875 | $1.67 | 5d | 1 | 0.79mi |
| 2745 Old Hapeville Rd SW Atlanta, GA | 2.0–3.0 | 2.0 | 1007 | $1,375 | $1.36 | 15d | 1 | 0.82mi |
| 2786 Old Hapeville Rd SW Atlanta, GA | 2.0 | 1.5 | 1050 | $1,150 | $1.10 | 24d | 1 | 0.85mi |
| 488 Pomona Cir SW Atlanta, GA | 3.0 | 1.0 | 1000 | $1,800 | $1.80 | 24d | 1 | 0.86mi |
| 2801 Palm Dr Atlanta, GA | 3.0 | 1.0 | 1064 | $1,550 | $1.46 | 12d | 1 | 0.86mi |
| 3353 Myrtle St Atlanta, GA | 3.0 | 2.0 | 1504 | $2,950 | $1.96 | 43d | 1 | 0.87mi |
| 801 N Central Ave Atlanta, GA | 2.0–4.0 | 2.5–3.5 | 1586 | $3,195 | $2.01 | 3d | 10 | 0.93mi |
| 2874 Blount St Atlanta, GA | 3.0 | 1.0 | 1190 | $1,750 | $1.47 | 5d | 1 | 0.95mi |
| 583 King Arnold St Atlanta, GA | 3.0 | 3.5 | 1787 | $2,700 | $1.51 | 1d | 1 | 0.97mi |
| 486 Pegg Rd SW Atlanta, GA | 4.0 | 1.5 | 1750 | $2,000 | $1.14 | 24d | 1 | 1.02mi |
| 152 Ruzelle Dr SE Atlanta, GA | 4.0 | 1.5 | 1511 | $1,595 | $1.06 | 14d | 1 | 1.06mi |
| 2748 Blount St Atlanta, GA | 3.0 | 1.0 | 1068 | $1,850 | $1.73 | 43d | 1 | 1.08mi |
| 131 Oak Dr SE Atlanta, GA | 3.0 | 2.0 | 1848 | $1,750 | $0.95 | 24d | 1 | 1.08mi |
| 2533 Sylvan Rd Atlanta, GA | 3.0 | 2.0 | 1692 | $1,995 | $1.18 | 24d | 1 | 1.10mi |
| 2636 Acadia St Atlanta, GA | 3.0 | 2.0 | 1300 | $1,800 | $1.38 | 24d | 1 | 1.13mi |
| 2456 Harwood Dr Atlanta, GA | 2.0 | 2.0 | 1176 | $1,995 | $1.70 | 43d | 1 | 1.14mi |
| 2626 Blount St Atlanta, GA | 2.0 | 1.0 | 1314 | $1,460 | $1.11 | 24d | 1 | 1.17mi |
| 210 Oak Dr SE Atlanta, GA | 3.0 | 2.0 | 1330 | $1,400 | $1.05 | 24d | 1 | 1.17mi |
| 2663 Blount St Atlanta, GA | 3.0 | 2.0 | 1168 | $1,650 | $1.41 | 16d | 1 | 1.18mi |
| 3188 Ward Dr SW Atlanta, GA | 3.0 | 1.5 | 1025 | $1,800 | $1.76 | 12d | 1 | 1.19mi |
Listing history 43 events
-
2026-03-12status Pending
-
2026-03-12historical Active Under Contract
-
2026-02-28status Active
-
2026-02-26historical Active Under Contract
-
2026-02-23price $165,000
-
2026-01-17price $179,900
-
2025-12-01price $195,000
-
2025-11-25price $204,900
-
2025-11-09price $195,000
-
2025-09-30price $204,900
-
2025-08-17$224,900 Active
-
2024-07-31historical
-
2024-02-02status Active
-
2024-02-02price $295,000
-
2024-01-31historical
-
2024-01-31historical
-
2023-09-20price $300,000
-
2023-09-20price $300,000
-
2023-07-07$315,000 Active
-
2023-07-07$315,000 New
-
2022-10-14historical
-
2022-08-16$329,000 New
-
2021-09-10soldstatus $255,000 Sold
-
2021-09-08soldstatus $255,000 Closed
-
2021-08-31status Active
-
2021-08-31status Back on Market
-
2021-07-08status Under Contract
-
2021-07-08status Pending
-
2021-06-20$239,990 New
-
2021-06-18$239,990 Active
-
2020-11-10soldstatus $79,900
-
2020-11-06soldstatus $79,900 Sold
-
2020-10-27soldstatus $79,900 Closed
-
2020-10-16status Under Contract
-
2020-10-16status Pending
-
2020-10-14price $79,900
-
2020-10-13price $79,900
-
2020-10-06price $84,900
-
2020-10-06price $84,900
-
2020-09-28$89,900 Active
-
2020-09-28$89,900 New
-
1996-07-08soldstatus $49,900
-
1988-04-20soldstatus $23,000
ⓘ Source: listings_history table (triggers on properties + properties_extension) + one-shot
backfill from property_details.listing_events for pre-trigger history.
Tax reassessment forecast GA · Resets to sale price
- Current annual tax
- $4,493 · $374/mo
- Projected year-2 tax
- $4,493 · $374/mo
- Expected delta
- $0/yr ($0/mo · 0.0%)
ⓘ Screening estimate from a state-policy table — verify with the county assessor before closing.
Climate risk First Street
- Flood 1/10 Low FEMA zone X (unshaded) · 0% chance over 30 yrs
- Wildfire 1/10 Low
- Heat 5/10 Major 6 d/yr ≥104°F today · 14 d/yr by 30 yrs out
- Wind 6/10 Major 27% chance of damaging wind over 30 yrs
- Air quality 4/10 Moderate 4 unhealthy d/yr today · 6 by 30 yrs out
Nearby sold comps map
Loading sold comps map…
Walkable amenities ~0.75 mi
Loading nearby amenities…
Taxation est. · year 1
- Rental income
- $23,254
- − Mortgage interest
- −$9,243
- − Property taxes
- −$4,493
- − Insurance
- −$825
- − Repairs & maintenance
- −$1,860
- − Management
- −$1,860
- − Depreciation
- −$4,800
- Taxable income
- $172
- Est. tax owed @ 24.0%
- −$41
- After-tax cash flow
- $2,627/yr
For passive investors: Depreciation is non-cash, so a rental often shows a tax loss while cash-flowing — sheltering income. Rental losses are passive: they offset passive income freely, and up to $25,000/yr can offset ordinary (W-2) income if you actively participate and your MAGI is under $100k (phasing out to $0 by $150k); unused losses carry forward. On sale, claimed depreciation is recaptured at up to 25%, and gains may owe capital-gains tax (a 1031 exchange can defer both). Figures are a year-1 estimate at your 24.0% rate — not tax advice; consult a CPA.
Schools (NCES district)
- District
- Atlanta Public Schools
- NCES district ID
- 1300120
- Math proficiency
- 28% ▼ -6.00%
- Reading proficiency
- 35% ▼ -2.00%
- Median HH income
- $48,306
- Composite
- 27.27/100
- National rank
- #7006
- State rank
- #80 of 174 in GA
Livability — Atlanta
- Score
- 83/100
- State rank
- #6
- US rank
- #919
Category grades
Schools grade is shown separately in the Schools card above.
Census & demographics
- Census place
- Atlanta, GA
- County
- Fulton County · 1,094,430 people
- City population
- 629,525
- Metro
- Atlanta-Sandy Springs-Alpharetta, GA
- Population (ZIP)
- 34,264
- Household income
- $50,822
- Rent vs Own
- Severe rent burden
- 2962.0
Population outlook (Fulton County) Hauer SSP2
- Today (2025)
- 1,203,707 people
- By 2030
- 1,299,706 · +8.0%
- By 2040
- 1,488,256 · +23.6%
- By 2050
- 1,664,580 · +38.3%
- By 2075
- 2,036,072 · +69.2%
- By 2100
- 2,222,402 · +84.6%
Race, ethnicity, and origin ACS 2023
- Neighborhood character
- Predominantly Black (72%)
- Race & ethnicity
- Black 72% White 14% Hispanic / Latino 10% Two or more races 4%
- Hispanic origin (detail)
- Mexican 4%
- Common ancestry
- Romanian 1% Italian 1% Lithuanian 1%
- Foreign-born
- 5% · Canada
- Languages at home
- 90% English-only · Spanish 9% French/Haitian/Cajun 1%
Political lean MEDSL · Fulton
- 2024 margin
- Solid D (+44.9) · D 71.9% · R 27.0% · Other 1.1%
- 2008→2024 swing
- +9.8pp toward D · 2008: 35.0pp · 2024: 44.9pp
- All cycles
- 2024: D+44.9 2020: D+46.4 2016: D+42.1 2012: D+29.6 2008: D+35.0
Not yet ingested
- Civics
- —
Market trends
- HPI YoY
- ▼ -281.87%
- Current HPI
- 176.673
- Rent YoY
- ▲ 3.23%
- Metro
- Atlanta-Sandy Springs-Alpharetta, GA
- State GDP YoY
- ▲ 2.66%
- F500 in state
- 28
Industry mix (Fortune 500 HQ in GA)
| Industry | F500 HQs | Revenue |
|---|---|---|
| Paper / Packaging | 2 | $29B |
|
||
| Retail | 1 | $160B |
|
||
| Transportation / Logistics | 1 | $91B |
|
||
| Airlines | 1 | $62B |
|
||
| Consumer Goods | 1 | $47B |
|
||
| Utilities | 1 | $25B |
|
||
Price history
+617.4% since first listed43 events — show timeline
- 2026-03-12 Pending — FMLS
- 2026-03-12 Contingent — FMLS
- 2026-02-28 Relisted — FMLS
- 2026-02-26 Contingent — FMLS
- 2026-02-23 Price Changed $165,000 FMLS
- 2026-01-17 Price Changed $179,900 FMLS
- 2025-12-01 Price Changed $195,000 FMLS
- 2025-11-25 Price Changed $204,900 FMLS
- 2025-11-09 Price Changed $195,000 FMLS
- 2025-09-30 Price Changed $204,900 FMLS
- 2025-08-17 Listed $224,900 FMLS
- 2024-07-31 Listing Removed — FMLS
- 2024-02-02 Relisted — FMLS
- 2024-02-02 Price Changed $295,000 FMLS
- 2024-01-31 Listing Removed — GAMLS
- 2024-01-31 Listing Removed — FMLS
- 2023-09-20 Price Changed $300,000 GAMLS
- 2023-09-20 Price Changed $300,000 FMLS
- 2023-07-07 Listed $315,000 GAMLS
- 2023-07-07 Listed $315,000 FMLS
- 2022-10-14 Listing Removed — GAMLS
- 2022-08-16 Listed $329,000 GAMLS
- 2021-09-10 Sold (MLS) $255,000 GAMLS
- 2021-09-08 Sold (MLS) $255,000 FMLS
- 2021-08-31 Relisted — FMLS
- 2021-08-31 Relisted — GAMLS
- 2021-07-08 Pending — GAMLS
- 2021-07-08 Pending — FMLS
- 2021-06-20 Listed $239,990 GAMLS
- 2021-06-18 Listed $239,990 FMLS
- 2020-11-10 Sold (Public Records) $79,900 Public Records
- 2020-11-06 Sold (MLS) $79,900 GAMLS
- 2020-10-27 Sold (MLS) $79,900 FMLS
- 2020-10-16 Pending — GAMLS
- 2020-10-16 Pending — FMLS
- 2020-10-14 Price Changed $79,900 GAMLS
- 2020-10-13 Price Changed $79,900 FMLS
- 2020-10-06 Price Changed $84,900 GAMLS
- 2020-10-06 Price Changed $84,900 FMLS
- 2020-09-28 Listed $89,900 GAMLS
- 2020-09-28 Listed $89,900 FMLS
- 1996-07-08 Sold (Public Records) $49,900 Public Records
- 1988-04-20 Sold (Public Records) $23,000 Public Records
Property tax history
+16.6%/yrLatest (2025): $4,493 · +6.1% YoY. Source: county tax records.
Cash-flow waterfall
monthlySold comps — $/sqft
last 12 mo · ≤1 miLoading sold comps…