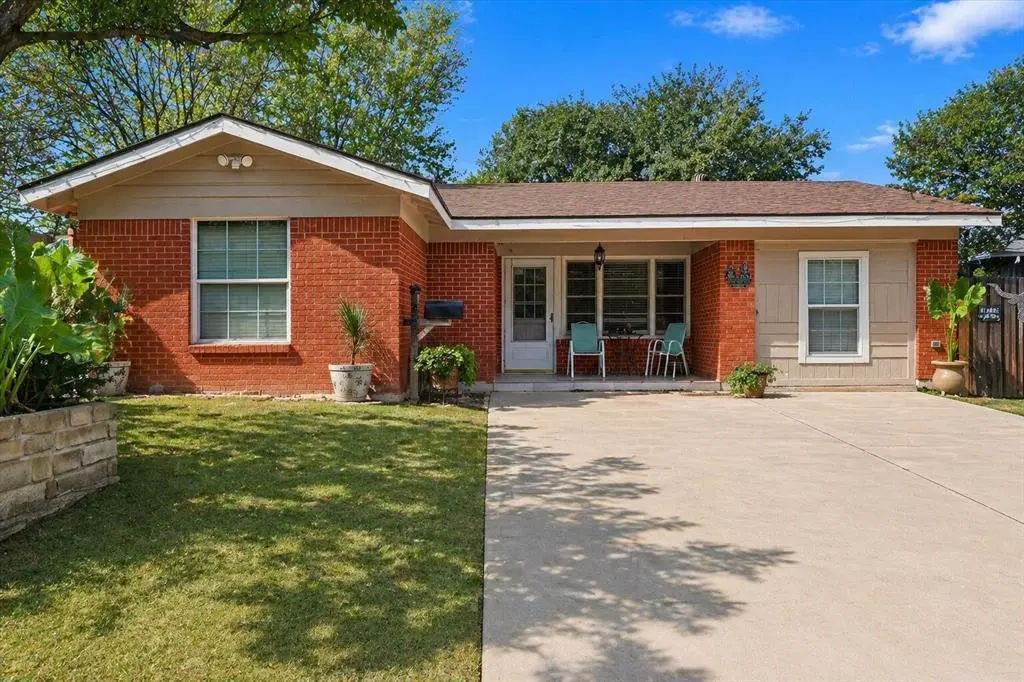
3404 Livingston Ave · Fort Worth, TX
Flood risk 1/10 · Minimal
- FEMA flood zone
- X (unshaded)
- Chance of flooding over 30 yrs
- 0.0%
- Est. flood insurance / yr
- $507 – $1,088
Fire risk 1/10 · Minimal
- Est. fire insurance / yr
- $1,222 – $2,270
Heat risk 7/10 · Major
- Hot days now (above 109°F)
- 7 days/yr
- Hot days in 30 yrs
- 23 days/yr
Wind risk 4/10 · Minor
- Chance of severe wind over 30 yrs
- 24.0%
Air-quality risk 3/10 · Minor
- Unhealthy air days now
- 3 days/yr
- Unhealthy air days in 30 yrs
- 4 days/yr
Risk factors via First Street. Map © Google.
Why this score? — see what drove the C grade
The composite is a weighted blend of 9 inputs, each scored 0–100. Each bar is that input's sub-score; the figure is the points it added to the 100-point composite (weight × sub-score).
- Cash flow +21.3/30.0
- ARV discount +11.7/15.0
- DSCR +6.8/10.0
- 1% rule +5.4/10.0
- Livability +4.0/5.0
- Rent growth +2.7/5.0
- Condition / age +2.5/5.0
- Schools +2.0/10.0
- Appreciation +0.0/10.0
$205,000
🖨 Deal sheet 📄 Offer letter ✓ Due diligence
Listing remarks
This 3-bedroom, 1-bath home features a versatile bonus room and sits in a high-demand location — just 5 minutes from TCU, 10 minutes from Sundance Square, and minutes from major highways. With strong rental potential and endless opportunities for updates or a long-term buy-and-hold strategy, this property is the perfect addition to any portfolio. It’s also a fantastic option for first-time homebuyers looking for an affordable home in a prime Fort Worth area, close to shopping, dining, entertainment, and major employers. Whether you’re investing or settling into your very first home, this property offers value, convenience, and opportunity all in one.
Key facts
- Bonus room
- Close to dining
- Close to shopping
Tags
Property features AI
Finance
- Other: Property type: Single Family Residence; County: Tarrant; Country: United States
- Financial info: Treat as clear loan type; No second mortgage
- HOA & community: No homeowners association
Exterior
- Parking: 2-space carport; Driveway
- Utilities: Cable available; City water; City sewer; Not in a municipal utility district
- Home design: Single-family residence; Residential property; Built in 1959; One story; Not attached to another property
- Construction: Year built: 1959
- Exterior features: Lot less than 0.5 acre (approximately 0.144 acres); Subdivision: South Summit Heights Add; Directions: see GPS
Interior
- Kitchen: No appliances included
- Bedrooms: Primary bedroom on level 1 (approx. 11 x 11); Total of 3 bedrooms
- Bathrooms: 1 full bathroom
- Interior features: Cable TV available; One living area; One dining area; Total rooms: 2; One-level layout
- Laundry & utility: No washer/dryer listed
Neighborhood map
What this means for you Summary
Snapshot
- This is a 2-bed/1.0-bath single-family listed at $205k.
Deal economics
- At list price, monthly cash flow is $302 ($4k/yr) — positive.
- The deal already cash-flows at list — no discount required.
- Meets the 1% rule at list price ($2k rent vs $205k).
- Recommended offer: $202k (1.5% below list) — sets the bar for market timing.
- Cap rate 8.1% vs local median 3.9% in Fort Worth — top-decile yield for the area; either an underpriced asset or a hidden risk that comps aren't pricing in. Stress-test before assuming the spread holds.
Location & tenants
- Location reads 80/100 on livability (#49 in TX, #1,954 nationally) — a professional / high-income tenant draw. Strengths: amenities A+, cost of living A+, housing A+; Watch: crime F.
- Fort Worth ISD (urban): math 18% / reading 28% proficiency, ranked #742 of 826 in TX (top 90%) — low school quality limits family demand, transient renter base, plan for 1-2y turnover; 73% free/reduced lunch — lower-income household profile, screen leases tightly.
- Zoned schools: Daggett El (math 17% / reading 20%, grade F, #3,759 of 4,322 statewide, top 88%, 544 students, 84% FRL).
- Market conditions: Rents flat; 150 active listings in the ZIP; 40 comparable units currently listed for rent nearby; rentals at typical pace (median 19d on market — plan ~3-4 weeks tenant-placement turnaround); 18,938 units permitted in Tarrant County in 2024 (8,336 in 5+ unit buildings).
- This rent runs 37% of the median local income ($70k/yr) — at the standard rent-burdened threshold; future hikes will face affordability resistance.
Forward outlook
- Local home prices are declining (-3.0%/yr); year-one equity from $1k of loan paydown is wiped out by about $6k of value loss. Plan a longer hold.
- Tarrant County population projected at +41% by 2050 — long-run rental-demand tailwind backs the buy-and-hold thesis.
Negotiation context
- It's been on market 29 days — a 2% lower offer ($202k) is reasonable based on typical stale-listing flexibility.
- 2 sale attempts with the ask held roughly flat each time — persistent listings suggest the price (not the market) is what's stuck; bring a comps-based counter.
Risks & watch-outs
- Watch-outs: built in 1959 — expect roof / HVAC / electrical / plumbing capex.
- Climate carrying-cost: extreme-heat days projected 7→23/yr by 2055 (HVAC capex compounding) — expect insurance premiums to compound above CPI over the hold.
Questions for the listing agent
- Built in 1959 — when were the roof, HVAC, electrical panel, plumbing, and water heater last replaced?
- Is there a deadline driving the sale (1031 exchange, divorce, estate, relocation)? That informs how much negotiation room exists.
- Schools are D-rated, which usually means shorter tenancies and higher turnover. Who's the typical renter profile here, and what's been the actual vacancy rate?
- Crime grade is F in this area — have there been break-ins, vandalism, or insurance claims at this property in the last 3 years? What carrier currently insures it and at what premium?
- What's the average days-on-market for RENTAL listings here right now (not sales)? A rising rental-DOM trend means longer vacancies and softer asking-rent achievability than the comps imply.
- What's the recent tenant-quality profile in this submarket — average credit score on applications, eviction rate, late-payment / NSF rate, and stable-employment percentage? A property-management company in the area should have these aggregated.
- How much new for-sale + rental construction is in the pipeline within 1–3 miles? Heavy new supply typically softens prices + rents 12–24 months out; constrained supply supports both.
Investment metrics
- 1% rule
- 1.04% ✓
- Cap rate
- 8.06%
- Cash-on-cash
- 6.31%
- DSCR
- 1.28
- GRM
- 8.0
CMA / ARV
- ARV (median comp)
- $226,280
- List price
- $205,000
- Delta
- -9.40%
- Verdict
- FAIR
- Comps
- 20 within 1.0 mi
Show comp detail 12 sales within ~0.75 mi
| Address | Dist | Beds/Ba | Sqft | Sold | Price | $/sf | Match |
|---|---|---|---|---|---|---|---|
| 3301 Willing Ave | 0.35mi | 2/2.0 | 1,248 (-9%) | 0mo | $199,999 | $160 | 65 |
| 3436 Stanley Ave | 0.11mi | 3/2.0 (+1) | 1,516 (+11%) | 6mo | $274,000 | $181 | 62 |
| 3600 Gordon Ave | 0.32mi | 3/2.0 (+1) | 1,288 (-6%) | 7mo | $269,900 | $210 | 60 |
| 3228 Cockrell Ave | 0.72mi | 2/1.0 | 1,392 (+2%) | 3mo | $350,000 | $251 | 60 |
| 3758 Wayside Ave | 0.58mi | 3/2.0 (+1) | 1,336 (-2%) | 2mo | $299,999 | $225 | 59 |
| 3301 Gordon Ave | 0.08mi | 3/2.0 (+1) | 1,550 (+14%) | 8mo | $173,595 | $112 | 58 |
| 3212 Greene Ave | 0.68mi | 3/2.0 (+1) | 1,382 (+1%) | 1mo | $550,000 | $398 | 57 |
| 2617 Benbrook Blvd | 0.46mi | 3/2.0 (+1) | 1,469 (+8%) | 2mo | $540,000 | $368 | 55 |
| 3208 Cockrell Ave | 0.73mi | 2/1.0 | 1,286 (-6%) | 7mo | $375,000 | $292 | 50 |
| 3545 Ryan Ave | 0.40mi | 2/1.0 | 1,160 (-15%) | 8mo | $190,000 | $164 | 49 |
| 3901 Frazier Ave | 0.69mi | 3/1.5 (+1) | 1,483 (+9%) | 7mo | $220,000 | $148 | 41 |
| 3204 Waits Ave | 0.63mi | 3/2.0 (+1) | 1,538 (+13%) | 3mo | $530,000 | $345 | 38 |
Match score weights: distance 35% · size 25% · config 20% · recency 20%. Top-matched comps best support the ARV.
Projected returns pro-forma
-3.0% appreciation · 0.7% rent growth · sell at horizon
- IRR
- -9.1%
- Equity multiple
- 0.67×
- Total profit
- $-18,793
- Equity at exit
- $30,566
- IRR
- -3.0%
- Equity multiple
- 0.82×
- Total profit
- $-10,430
- Equity at exit
- $17,725
Cash invested: $57,400 (down + closing). Projections, not guarantees.
Landlord ↔ Tenant lean methodology
- Overall (STATE)
- 87 Strongly Landlord-Friendly
- State Texas
- 87 Strongly Landlord-Friendly · R+5
- County
- — inherits STATE
- City
- — inherits STATE
ZIP-level market 76110
- Rents YoY
- 0.7%
- Active inventory
- 150
- Price-to-rent
- 8.0×
Monthly cashflow live
- Estimated rent
- $2,128 high interval (Pro) →
- Mortgage (P&I)
- −$1,075
- Tax from tax record
- −$219 /mo · $2,627/yr
- Insurance
- −$85
- HOA
- −$0
- Vacancy / Maint / Mgmt
- −$447
- Net cashflow
- $302
Break-even live
UW: 25.0% down · 7.5% · 30yr · 1.5% tax · 5.0% vac · 8.0% maint · 8.0% mgmt
Financing live
Cash to close
- Down payment
- $51,250
- Closing costs
- $6,150
- Reserves months
- —
- Total cash needed
- —
Loan-product check · same deal, 3 products live
Conventional
25% down · 7.5% · 30yr
- Down + closing
- —
- Monthly P&I
- —
- Monthly cashflow
- —
- DSCR
- —
- Eligible?
- —
Personal DTI + credit; lowest rate.
DSCR
20% down · 8.5% · 30yr
- Down + closing
- —
- Monthly P&I
- —
- Monthly cashflow
- —
- DSCR
- —
- Eligible?
- —
No personal income docs; deal must DSCR.
Hard money
10% down · 12.0% · 12mo
- Down + closing
- —
- Monthly P&I
- —
- Monthly cashflow
- —
- DSCR
- —
- Eligible?
- —
Short-term bridge; refi at stabilization.
Rent comps 40 comps
| Address | Beds | Baths | Sqft | Rent | $/sqft | DOM | Units | Dist |
|---|---|---|---|---|---|---|---|---|
| 3437 Stanley Ave Fort Worth, TX | 2.0 | 1.0 | 1000 | $1,500 | $1.50 | 43d | 1 | 0.14mi |
| 3445 Frazier Ave Fort Worth, TX | 3.0 | 2.5 | 1540 | $2,200 | $1.43 | 43d | 1 | 0.20mi |
| 3411 8th Ave Fort Worth, TX | 3.0 | 2.0 | 1280 | $1,700 | $1.33 | 5d | 1 | 0.20mi |
| 3303 8th Ave Fort Worth, TX | 3.0 | 2.0 | 1348 | $2,000 | $1.48 | 24d | 1 | 0.21mi |
| 3136 Wayside Ave Fort Worth, TX | 3.0 | 2.5 | 1875 | $3,000 | $1.60 | 6d | 1 | 0.36mi |
| 2505 Benbrook Blvd Unit 503 Fort Worth, TX | 3.0 | 3.0 | 1367 | $2,495 | $1.83 | 43d | 1 | 0.39mi |
| 2509 Benbrook Blvd Unit 902 Fort Worth, TX | 3.0 | 3.0 | 1756 | $2,595 | $1.48 | 43d | 1 | 0.40mi |
| 2521 Benbrook Blvd Fort Worth, TX | 3.0 | 3.0 | 1849 | $4,000 | $2.16 | 4d | 1 | 0.43mi |
| 3024 8th Ave Fort Worth, TX | 3.0 | 1.0 | 1048 | $1,699 | $1.62 | 24d | 1 | 0.44mi |
| 3241 Sandage Ave Fort Worth, TX | 3.0 | 2.0 | 1115 | $3,000 | $2.69 | 19d | 1 | 0.44mi |
| 1246 Lowe St Fort Worth, TX | 3.0 | 2.5 | 1752 | $1,895 | $1.08 | 15d | 1 | 0.48mi |
| 3217 Lubbock Ave Unit B Fort Worth, TX | 3.0 | 3.0 | 1856 | $3,150 | $1.70 | 19d | 1 | 0.57mi |
| 2901 Stanley Ave Fort Worth, TX | 2.0 | 1.0–2.0 | 829 | $2,000 | $2.41 | 3d | 4 | 0.59mi |
| 2809 South Hills Ave Fort Worth, TX | 3.0 | 2.0 | 1203 | $1,650 | $1.37 | 19d | 1 | 0.60mi |
| 2809 South Hills Ave Fort Worth, TX | 3.0 | 2.0 | 1203 | $1,650 | $1.37 | 43d | 1 | 0.60mi |
| 2911 Ryan Ave Fort Worth, TX | 3.0 | 2.0 | 1790 | $1,750 | $0.98 | 6d | 1 | 0.62mi |
| 3145 Waits Ave #302 Fort Worth, TX | 3.0 | 3.0 | 1245 | $3,000 | $2.41 | 24d | 1 | 0.63mi |
| 2816 Gordon Ave Fort Worth, TX | 3.0 | 3.0 | 1570 | $3,000 | $1.91 | 6d | 1 | 0.66mi |
| 2821 Frazier Ave Unit 2823 Fort Worth, TX | 3.0 | 2.0 | 1200 | $1,600 | $1.33 | 19d | 1 | 0.67mi |
| 3500 College Ave Fort Worth, TX | 3.0 | 1.0 | 1012 | $1,650 | $1.63 | 43d | 1 | 0.70mi |
| 3245 Cockrell Ave Fort Worth, TX | 2.0 | 1.0 | 1402 | $2,500 | $1.78 | 43d | 1 | 0.71mi |
| 3132 Greene Ave Unit A Fort Worth, TX | 1.0 | 2.0 | 950 | $1,199 | $1.26 | 43d | 1 | 0.72mi |
| 2803 Wayside Ave Fort Worth, TX | 3.0 | 2.0 | 1190 | $1,700 | $1.43 | 24d | 1 | 0.73mi |
| 3232 Cockrell Ave Fort Worth, TX | 2.0 | 1.0 | 1128 | $2,100 | $1.86 | 43d | 1 | 0.74mi |
| 3419 S University Dr Unit D Fort Worth, TX | 2.0 | 1.0 | 900 | $1,095 | $1.22 | 17d | 1 | 0.75mi |
| 3259 S University Dr Unit A Fort Worth, TX | 3.0 | 3.0 | 1490 | $2,495 | $1.67 | 43d | 1 | 0.77mi |
| 3417 S University Dr Unit A Fort Worth, TX | 2.0 | 1.0 | 1059 | $1,095 | $1.03 | 5d | 1 | 0.77mi |
| 3417 S University Dr Unit D Fort Worth, TX | 2.0 | 1.0 | 900 | $1,235 | $1.37 | 43d | 1 | 0.77mi |
| 2717 Townsend Dr Fort Worth, TX | 2.0 | 1.5 | 1024 | $1,700 | $1.66 | 24d | 1 | 0.77mi |
| 3136 Cockrell Ave Unit 102 Fort Worth, TX | 3.0 | 3.0 | 1376 | $3,900 | $2.83 | 5d | 1 | 0.77mi |
| 2725 Forest Park Blvd Unit 2725 Fort Worth, TX | 2.0 | 1.0 | 1000 | $1,400 | $1.40 | 43d | 1 | 0.80mi |
| 2712 Frazier Ave Fort Worth, TX | 3.0 | 2.0 | 1099 | $2,625 | $2.39 | 19d | 1 | 0.80mi |
| 3324 S University Dr Unit Down Fort Worth, TX | 2.0 | 2.0 | 1312 | $1,600 | $1.22 | 5d | 1 | 0.81mi |
| 3208 S University Dr Unit The Carter 106B Fort Worth, TX | 3.0 | 2.0 | 1121 | $3,600 | $3.21 | 6d | 1 | 0.83mi |
| 3208 S University Dr Unit The Carter 204B Fort Worth, TX | 3.0 | 2.0 | 1099 | $3,600 | $3.28 | 19d | 1 | 0.83mi |
| 3315 Rogers Ave Fort Worth, TX | 3.0 | 1.0 | 1532 | $3,300 | $2.15 | 43d | 1 | 0.84mi |
| 2812 Ryan Place Dr Fort Worth, TX | 2.0 | 1.0 | 1234 | $2,795 | $2.26 | 17d | 1 | 0.84mi |
| 3211 Rogers Ave Fort Worth, TX | 2.0 | 1.0 | 1015 | $1,695 | $1.67 | 15d | 1 | 0.86mi |
| 2714 McCart Ave Unit 2712 Fort Worth, TX | 2.0 | 2.0 | 1045 | $1,800 | $1.72 | 15d | 1 | 0.86mi |
| 2708 McCart Ave Unit 2710 Fort Worth, TX | 2.0 | 2.0 | 1045 | $1,900 | $1.82 | 15d | 1 | 0.87mi |
Listing history 20 events
-
2026-04-30historical
-
2026-04-30$205,000 Active 676-char remark
-
2026-04-29price $205,000
-
2026-04-13price $198,999
-
2026-03-12price $199,000
-
2026-03-03price $199,900
-
2026-02-24price $199,990
-
2026-02-19price $199,995
-
2026-02-10price $199,998
-
2026-02-04price $200,000
-
2026-01-12price $204,900
-
2026-01-05price $204,999
-
2026-01-02price $205,000
-
2025-12-31price $209,990
-
2025-12-21price $209,999
-
2025-12-17price $210,000
-
2025-12-16price $218,900
-
2025-12-06price $219,999
-
2025-11-28$220,000 Active
-
1998-07-31soldstatus
ⓘ Source: listings_history table (triggers on properties + properties_extension) + one-shot
backfill from property_details.listing_events for pre-trigger history.
Tax reassessment forecast TX · Resets to sale price
- Current annual tax
- $2,627 · $219/mo
- Projected year-2 tax
- $3,752 · $313/mo
- Expected delta
- +$1,125/yr (+$94/mo · 42.8%)
ⓘ Screening estimate from a state-policy table — verify with the county assessor before closing.
Climate risk First Street
- Flood 1/10 Low FEMA zone X (unshaded) · 0% chance over 30 yrs
- Wildfire 1/10 Low
- Heat 7/10 Severe 7 d/yr ≥109°F today · 23 d/yr by 30 yrs out
- Wind 4/10 Moderate 24% chance of damaging wind over 30 yrs
- Air quality 3/10 Moderate 3 unhealthy d/yr today · 4 by 30 yrs out
Nearby sold comps map
Loading sold comps map…
Walkable amenities ~0.75 mi
Loading nearby amenities…
Taxation est. · year 1
- Rental income
- $25,539
- − Mortgage interest
- −$11,483
- − Property taxes
- −$2,627
- − Insurance
- −$1,025
- − Repairs & maintenance
- −$2,043
- − Management
- −$2,043
- − Depreciation
- −$5,964
- Taxable income
- $354
- Est. tax owed @ 24.0%
- −$85
- After-tax cash flow
- $3,539/yr
For passive investors: Depreciation is non-cash, so a rental often shows a tax loss while cash-flowing — sheltering income. Rental losses are passive: they offset passive income freely, and up to $25,000/yr can offset ordinary (W-2) income if you actively participate and your MAGI is under $100k (phasing out to $0 by $150k); unused losses carry forward. On sale, claimed depreciation is recaptured at up to 25%, and gains may owe capital-gains tax (a 1031 exchange can defer both). Figures are a year-1 estimate at your 24.0% rate — not tax advice; consult a CPA.
Schools (NCES district)
- District
- Fort Worth ISD
- NCES district ID
- 4819700
- Math proficiency
- 18% ▼ -16.00%
- Reading proficiency
- 28% ▼ -6.00%
- Median HH income
- $42,109
- Composite
- 19.61/100
- National rank
- #8753
- State rank
- #742 of 826 in TX
Livability — Fort Worth
- Score
- 80/100
- State rank
- #49
- US rank
- #1954
Category grades
Schools grade is shown separately in the Schools card above.
Census & demographics
- Census place
- Fort Worth, TX
- County
- Tarrant County · 2,033,669 people
- City population
- 911,619
- Metro
- Dallas-Fort Worth-Arlington, TX
- Population (ZIP)
- 33,441
- Household income
- $69,790
- Rent vs Own
- Severe rent burden
- 1471.0
Population outlook (Tarrant County) Hauer SSP2
- Today (2025)
- 2,380,417 people
- By 2030
- 2,578,900 · +8.3%
- By 2040
- 2,974,995 · +25.0%
- By 2050
- 3,350,489 · +40.8%
- By 2075
- 4,216,909 · +77.2%
- By 2100
- 4,741,527 · +99.2%
Race, ethnicity, and origin ACS 2023
- Neighborhood character
- Majority Hispanic (63%)
- Race & ethnicity
- Hispanic / Latino 63% White 30% Two or more races 24% Black 2% Asian 2%
- Hispanic origin (detail)
- Mexican 57%
- Common ancestry
- Slovak 1% Italian 1% Lithuanian 1%
- Foreign-born
- 26% · Canada, China
- Languages at home
- 45% English-only · Spanish 52% Other Asian/Pacific 1% Other Indo-European 1%
Political lean MEDSL · Tarrant
- 2024 margin
- Lean R (+5.1) · D 46.7% · R 51.9% · Other 1.4%
- 2008→2024 swing
- +6.6pp toward D · 2008: -11.7pp · 2024: -5.1pp
- All cycles
- 2024: R+5.1 2020: D+0.2 2016: R+8.7 2012: R+15.7 2008: R+11.7
Not yet ingested
- Civics
- —
Market trends
- HPI YoY
- ▼ -194.46%
- Current HPI
- 274.8888
- Rent YoY
- ▲ 0.70%
- Metro
- Dallas-Fort Worth-Arlington, TX
- State GDP YoY
- ▲ 3.95%
- F500 in state
- 110
Industry mix (Fortune 500 HQ in TX)
| Industry | F500 HQs | Revenue |
|---|---|---|
| Energy | 16 | $1,198B |
|
||
| Technology | 5 | $198B |
|
||
| Engineering / Construction | 4 | $72B |
|
||
| Energy Services | 3 | $60B |
|
||
| Utilities | 3 | $41B |
|
||
| Healthcare | 2 | $330B |
|
||
Price history
-6.8% since first listed22 events — show timeline
- 2026-05-29 Pending — NTREIS
- 2026-05-27 Contingent — NTREIS
- 2026-04-30 Listing Removed — NTREIS
- 2026-04-30 Listed $205,000 NTREIS
- 2026-04-29 Price Changed $205,000 NTREIS
- 2026-04-13 Price Changed $198,999 NTREIS
- 2026-03-12 Price Changed $199,000 NTREIS
- 2026-03-03 Price Changed $199,900 NTREIS
- 2026-02-24 Price Changed $199,990 NTREIS
- 2026-02-19 Price Changed $199,995 NTREIS
- 2026-02-10 Price Changed $199,998 NTREIS
- 2026-02-04 Price Changed $200,000 NTREIS
- 2026-01-12 Price Changed $204,900 NTREIS
- 2026-01-05 Price Changed $204,999 NTREIS
- 2026-01-02 Price Changed $205,000 NTREIS
- 2025-12-31 Price Changed $209,990 NTREIS
- 2025-12-21 Price Changed $209,999 NTREIS
- 2025-12-17 Price Changed $210,000 NTREIS
- 2025-12-16 Price Changed $218,900 NTREIS
- 2025-12-06 Price Changed $219,999 NTREIS
- 2025-11-28 Listed $220,000 NTREIS
- 1998-07-31 Sold (Public Records) — Public Records
Property tax history
+1.4%/yrLatest (2025): $2,627 · -2.4% YoY. Source: county tax records.
Cash-flow waterfall
monthlySold comps — $/sqft
last 12 mo · ≤1 miLoading sold comps…