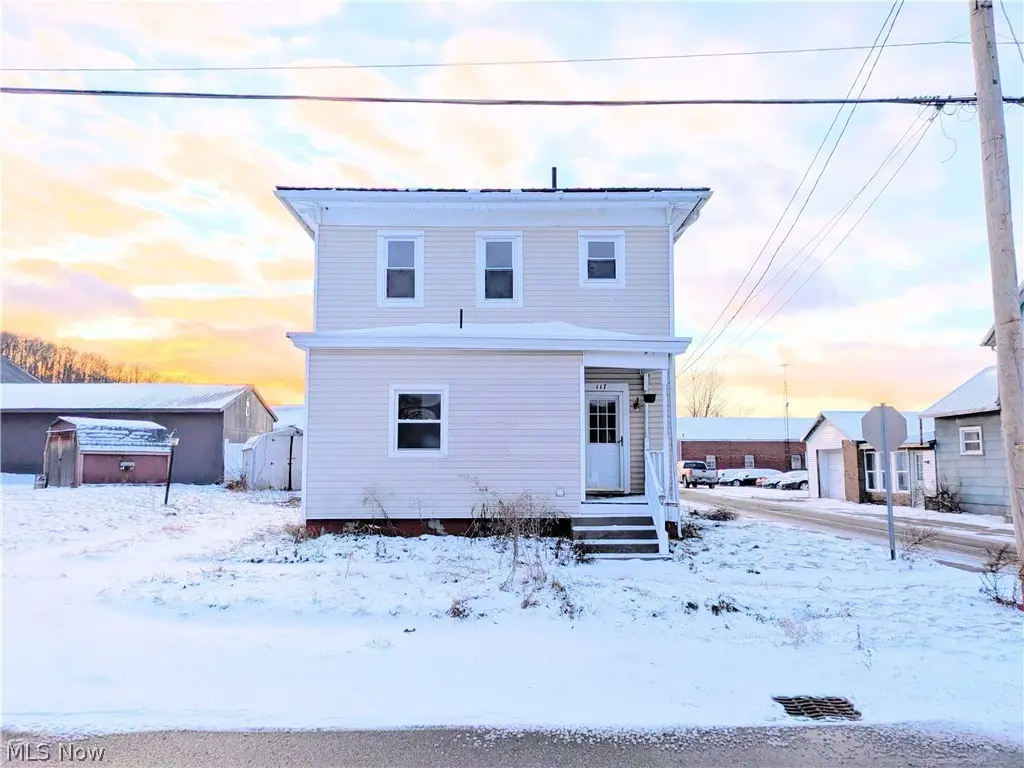
117 N Market St · Waynesburg, OH
Flood risk 1/10 · Minimal
- FEMA flood zone
- X (unshaded)
- Chance of flooding over 30 yrs
- 0.0%
- Est. flood insurance / yr
- $473 – $860
Fire risk 1/10 · Minimal
- Est. fire insurance / yr
- $713 – $1,323
Heat risk 4/10 · Minor
- Hot days now (above 97°F)
- 7 days/yr
- Hot days in 30 yrs
- 19 days/yr
Wind risk 1/10 · Minimal
- Chance of severe wind over 30 yrs
- —
Air-quality risk 2/10 · Minimal
- Unhealthy air days now
- 0 days/yr
- Unhealthy air days in 30 yrs
- 1 days/yr
Risk factors via First Street. Map © Google.
Why this score? — see what drove the C grade
The composite is a weighted blend of 9 inputs, each scored 0–100. Each bar is that input's sub-score; the figure is the points it added to the 100-point composite (weight × sub-score).
- ARV discount +15.0/15.0
- Cash flow +13.4/30.0
- Appreciation +6.7/10.0
- Schools +5.1/10.0
- DSCR +4.0/10.0
- 1% rule +3.5/10.0
- Livability +3.4/5.0
- Rent growth +2.5/5.0
- Condition / age +2.5/5.0
$139,900
🖨 Deal sheet 📄 Offer letter ✓ Due diligence
Listing remarks
Welcome to 117 N Market St in Waynesburg! This spacious 4-bedroom, 2 full-bath home offers 1,620 sq ft of move-in-ready living with thoughtful updates throughout. The interior has been freshly repainted and features brand-new carpet, creating a clean, bright, and inviting feel from the moment you step inside. The functional layout provides generous living space with flexibility for a variety of needs, whether you're looking for a primary residence or a strong investment opportunity. A hot water heater installed within the past five years adds additional peace of mind. The foundation has been recently evaluated, providing added confidence to the next owner. Conveniently located in the heart
Key facts
- Hot water heater
- 3,005 sq ft lot
- Parking
Tags
Neighborhood map
What this means for you Summary
Snapshot
- This is a 3-bed/1.0-bath single-family listed at $140k.
Deal economics
- At list price, monthly cash flow is $2 ($29/yr) — positive.
- The deal already cash-flows at list — no discount required.
- To meet the 1% rule (rent ≥ 1% of price), the offer needs to be $119k (15.2% below list).
- Recommended offer: $119k (15.2% below list) — sets the bar for 1% rule.
Location & tenants
- Location reads 68/100 on livability (#559 in OH) — a middle-class / working-renter tenant base. Strengths: crime A+, cost of living A+, housing A+; Watch: schools C-, amenities F, commute F.
- Sandy Valley Local (rural): math 56% / reading 63% proficiency, ranked #296 of 656 in OH (top 45%) — acceptable for families but not a draw, mixed tenant base, ~2y average lease.
- Market conditions: 14 active listings in the ZIP; 528 units permitted in Stark County in 2024 (84 in 5+ unit buildings).
Forward outlook
- In year one you build about $6k of equity ($967 loan paydown + $5k appreciation (3.5% local appreciation)).
- Stark County population projected to shrink 8% by 2050 — rents likely to lag national; underwrite the cash flow, not the appreciation.
- At projected returns (3.5% appreciation + 3.0% rent growth), your $39k cash investment doubles in ~6 years — after that, you're playing with house money.
- By year 6, paydown + projected appreciation supports a ~$31k cash-out refi (75% LTV) — recoverable capital for the next deal without selling this one.
Negotiation context
- It's been on market 22 days — a 2% lower offer ($138k) is reasonable based on typical stale-listing flexibility.
- 2 sale attempts with the ask held roughly flat each time — persistent listings suggest the price (not the market) is what's stuck; bring a comps-based counter.
- Current owner paid $64k; list at $140k implies a 120% gain — meaningful room to come down on a strong offer.
Risks & watch-outs
- Watch-outs: built in 1880 — expect roof / HVAC / electrical / plumbing capex.
Questions for the listing agent
- Built in 1880 — when were the roof, HVAC, electrical panel, plumbing, and water heater last replaced?
- Is there a deadline driving the sale (1031 exchange, divorce, estate, relocation)? That informs how much negotiation room exists.
- What's the average days-on-market for RENTAL listings here right now (not sales)? A rising rental-DOM trend means longer vacancies and softer asking-rent achievability than the comps imply.
- What's the recent tenant-quality profile in this submarket — average credit score on applications, eviction rate, late-payment / NSF rate, and stable-employment percentage? A property-management company in the area should have these aggregated.
- How much new for-sale + rental construction is in the pipeline within 1–3 miles? Heavy new supply typically softens prices + rents 12–24 months out; constrained supply supports both.
Investment metrics
- 1% rule
- 0.85% ✗
- Cap rate
- 6.31%
- Cash-on-cash
- 0.07%
- DSCR
- 1.00
- GRM
- 9.8
CMA / ARV
- ARV (on-the-fly)
- $228,420
- Comps found
- 3
Show comp detail 3 sales within ~0.75 mi
| Address | Dist | Beds/Ba | Sqft | Sold | Price | $/sf | Match |
|---|---|---|---|---|---|---|---|
| 146 Boory Pl | 0.16mi | 3/1.5 | 1,720 (+6%) | 12mo | $140,000 | $81 | 70 |
| 170 N Mckinley St | 0.51mi | 4/2.5 (+1) | 1,444 (-11%) | 14mo | $234,900 | $163 | 35 |
| 181 Roosevelt Ave | 0.48mi | 3/2.0 | 1,380 (-15%) | 19mo | $195,000 | $141 | 33 |
Match score weights: distance 35% · size 25% · config 20% · recency 20%. Top-matched comps best support the ARV.
Projected returns pro-forma
3.48% appreciation · 3.0% rent growth · sell at horizon
- IRR
- 8.9%
- Equity multiple
- 1.53×
- Total profit
- $20,584
- Equity at exit
- $66,710
- IRR
- 11.2%
- Equity multiple
- 2.75×
- Total profit
- $68,735
- Equity at exit
- $105,869
Cash invested: $39,172 (down + closing). Projections, not guarantees.
Landlord ↔ Tenant lean methodology
- Overall (STATE)
- 73 Landlord-Friendly
- State Ohio
- 73 Landlord-Friendly · R+6
- County
- — inherits STATE
- City
- — inherits STATE
ZIP-level market 44688
- Home prices YoY
- 1.4%
- Active inventory
- 14
- Price-to-rent
- 9.8×
Monthly cashflow live
- Estimated rent
- $1,187 medium interval (Pro) →
- Mortgage (P&I)
- −$734
- Tax from tax record
- −$143 /mo · $1,720/yr
- Insurance
- −$58
- HOA
- −$0
- Vacancy / Maint / Mgmt
- −$249
- Net cashflow
- $2
Break-even live
UW: 25.0% down · 7.5% · 30yr · 1.5% tax · 5.0% vac · 8.0% maint · 8.0% mgmt
Financing live
Cash to close
- Down payment
- $34,975
- Closing costs
- $4,197
- Reserves months
- —
- Total cash needed
- —
Loan-product check · same deal, 3 products live
Conventional
25% down · 7.5% · 30yr
- Down + closing
- —
- Monthly P&I
- —
- Monthly cashflow
- —
- DSCR
- —
- Eligible?
- —
Personal DTI + credit; lowest rate.
DSCR
20% down · 8.5% · 30yr
- Down + closing
- —
- Monthly P&I
- —
- Monthly cashflow
- —
- DSCR
- —
- Eligible?
- —
No personal income docs; deal must DSCR.
Hard money
10% down · 12.0% · 12mo
- Down + closing
- —
- Monthly P&I
- —
- Monthly cashflow
- —
- DSCR
- —
- Eligible?
- —
Short-term bridge; refi at stabilization.
Listing history 7 events
-
2026-04-10status Pending
-
2026-03-18$139,900 Active
-
2026-03-02historical
-
2026-01-15$149,900 Active
-
2017-11-13soldstatus $63,500
-
2001-05-01soldstatus $57,500
-
1994-06-08soldstatus $26,400
ⓘ Source: listings_history table (triggers on properties + properties_extension) + one-shot
backfill from property_details.listing_events for pre-trigger history.
Tax reassessment forecast OH · Partial reset (capped growth)
- Current annual tax
- $1,720 · $143/mo
- Projected year-2 tax
- $1,951 · $163/mo
- Expected delta
- +$231/yr (+$19/mo · 13.5%)
ⓘ Screening estimate from a state-policy table — verify with the county assessor before closing.
Climate risk First Street
- Flood 1/10 Low FEMA zone X (unshaded) · 0% chance over 30 yrs
- Wildfire 1/10 Low
- Heat 4/10 Moderate 7 d/yr ≥97°F today · 19 d/yr by 30 yrs out
- Wind 1/10 Low
- Air quality 2/10 Low 0 unhealthy d/yr today · 1 by 30 yrs out
Nearby sold comps map
Loading sold comps map…
Walkable amenities ~0.75 mi
Loading nearby amenities…
Taxation est. · year 1
- Rental income
- $14,243
- − Mortgage interest
- −$7,837
- − Property taxes
- −$1,720
- − Insurance
- −$700
- − Repairs & maintenance
- −$1,139
- − Management
- −$1,139
- − Depreciation
- −$4,070
- Taxable loss
- −$2,361
- Est. tax savings @ 24.0%
- +$567
- After-tax cash flow
- $596/yr
For passive investors: Depreciation is non-cash, so a rental often shows a tax loss while cash-flowing — sheltering income. Rental losses are passive: they offset passive income freely, and up to $25,000/yr can offset ordinary (W-2) income if you actively participate and your MAGI is under $100k (phasing out to $0 by $150k); unused losses carry forward. On sale, claimed depreciation is recaptured at up to 25%, and gains may owe capital-gains tax (a 1031 exchange can defer both). Figures are a year-1 estimate at your 24.0% rate — not tax advice; consult a CPA.
Schools (NCES district)
- District
- Sandy Valley Local
- NCES district ID
- 3904994
- Math proficiency
- 56% ▼ -10.00%
- Reading proficiency
- 63% ▼ -3.00%
- Median HH income
- $49,859
- Composite
- 50.62/100
- National rank
- #1842
- State rank
- #296 of 656 in OH
Livability — Waynesburg
- Score
- 68/100
- State rank
- #559
- US rank
- #9536
Category grades
Schools grade is shown separately in the Schools card above.
Census & demographics
- Census place
- Waynesburg, OH
- County
- Stark · 366,688 people
- Metro
- Canton-Massillon, OH
- Population (ZIP)
- 2,895
- Household income
- $58,936
- Rent vs Own
- Severe rent burden
- 9.6
Population outlook (Stark County) Hauer SSP2
- Today (2025)
- 373,708 people
- By 2030
- 371,245 · -0.7%
- By 2040
- 361,331 · -3.3%
- By 2050
- 345,290 · -7.6%
- By 2075
- 302,669 · -19.0%
- By 2100
- 238,870 · -36.1%
Race, ethnicity, and origin ACS 2023
- Neighborhood character
- Predominantly White (89%)
- Race & ethnicity
- White 89% Two or more races 7% Hispanic / Latino 2% Black 2%
- Common ancestry
- Italian 7% Lithuanian 3% Romanian 3%
- Foreign-born
- 0%
- Languages at home
- 98% English-only · German/W. Germanic 1% Spanish 1% Other Asian/Pacific 1%
Political lean MEDSL · Stark
- 2024 margin
- Strong R (+21.9) · D 38.6% · R 60.5%
- 2008→2024 swing
- -27.4pp toward R · 2008: 5.5pp · 2024: -21.9pp
- All cycles
- 2024: R+21.9 2020: R+18.5 2016: R+17.4 2012: R+0.4 2008: D+5.5
Not yet ingested
- Civics
- —
Market trends
- HPI YoY
- ▲ 3.48%
- Current HPI
- 258.7896
- Rent YoY
- —
- Metro
- —
- State GDP YoY
- ▲ 1.98%
- F500 in state
- 48
Industry mix (Fortune 500 HQ in OH)
| Industry | F500 HQs | Revenue |
|---|---|---|
| Insurance | 3 | $145B |
|
||
| Industrial Machinery | 3 | $49B |
|
||
| Financial Services | 3 | $24B |
|
||
| Consumer Goods | 2 | $93B |
|
||
| Aerospace / Defense | 2 | $47B |
|
||
| Utilities | 2 | $33B |
|
||
Price history
+429.9% since first listed7 events — show timeline
- 2026-04-10 Pending — MLSNOW
- 2026-03-18 Listed $139,900 MLSNOW
- 2026-03-02 Listing Removed — MLSNOW
- 2026-01-15 Listed $149,900 MLSNOW
- 2017-11-13 Sold (Public Records) $63,500 Public Records
- 2001-05-01 Sold (Public Records) $57,500 Public Records
- 1994-06-08 Sold (Public Records) $26,400 Public Records
Property tax history
+6.3%/yrLatest (2024): $1,720 · +167.5% YoY. Source: county tax records.
Cash-flow waterfall
monthlySold comps — $/sqft
last 12 mo · ≤1 miLoading sold comps…