 🏗️ New Construction
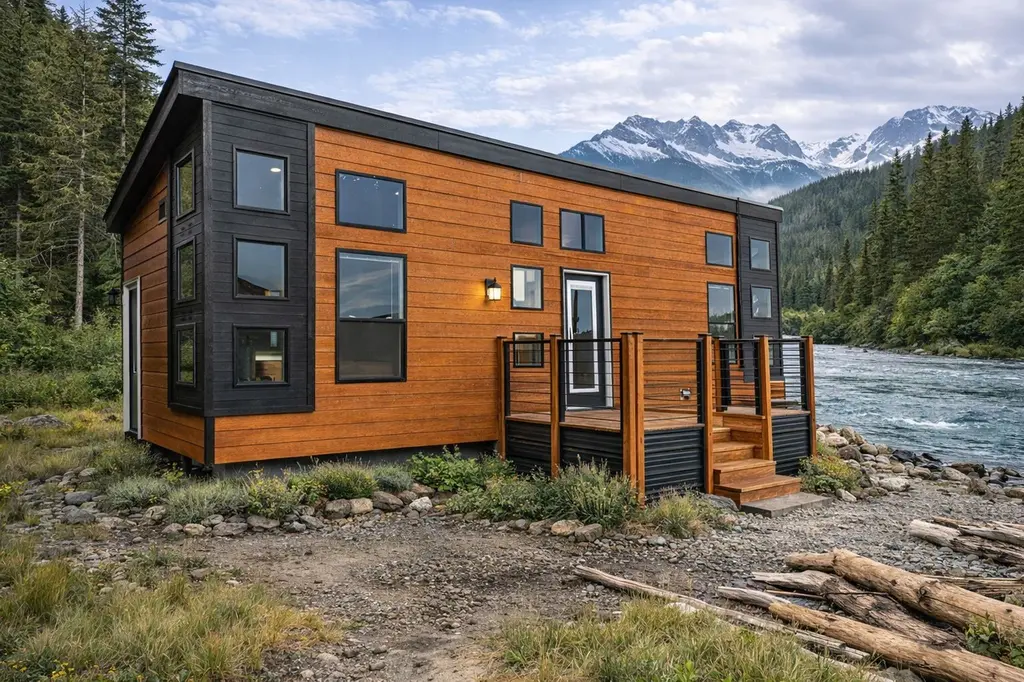
The Dungeness Plan · Carlsborg, WA
Flood risk 1/10 · Minimal
- FEMA flood zone
- X
- Chance of flooding over 30 yrs
- 0.0%
- Est. flood insurance / yr
- $507 – $1,088
Fire risk 1/10 · Minimal
- Est. fire insurance / yr
- $604 – $1,122
Heat risk 2/10 · Minimal
- Hot days now (above 83°F)
- 7 days/yr
- Hot days in 30 yrs
- 18 days/yr
Wind risk 1/10 · Minimal
- Chance of severe wind over 30 yrs
- —
Air-quality risk 6/10 · Moderate
- Unhealthy air days now
- 7 days/yr
- Unhealthy air days in 30 yrs
- 8 days/yr
Risk factors via First Street. Map © Google.
Why this score? — see what drove the F grade
The composite is a weighted blend of 9 inputs, each scored 0–100. Each bar is that input's sub-score; the figure is the points it added to the 100-point composite (weight × sub-score).
- ARV discount +7.5/15.0
- Schools +5.3/10.0
- Cash flow +4.8/30.0
- Condition / age +4.0/5.0
- Livability +3.0/5.0
- Rent growth +2.5/5.0
- 1% rule +0.7/10.0
- DSCR +0.0/10.0
- Appreciation +0.0/10.0
$129,000
🖨 Deal sheet 📄 Offer letter ✓ Due diligence
Listing remarks MLS
Small quality built home with big home style, features and efficiency boasts extra large windows with transoms allowing natural light to bathe and brighten the entire home; large living room open to beautiful well equipped big home kitchen with full size cabinets, fixtures and appliances; king size bedroom and bath with large walk-in shower.
Key facts
- Large living room
- Extra large windows
- King size bedroom
Tags
Neighborhood map
What this means for you Summary
Snapshot
- This is a 1-bed/1.0-bath single-family listed at $129k. Condition is rated good.
Deal economics
- At list price, monthly cash flow is $-669 ($-8k/yr) — negative.
- The deal already cash-flows at list — no discount required.
- Meets the 1% rule at list price ($2k rent vs $129k).
- Recommended offer: $121k (6.0% below list) — sets the bar for market timing.
- Cap rate 3.4% vs local median 2.4% in Carlsborg — top-decile yield for the area; either an underpriced asset or a hidden risk that comps aren't pricing in. Stress-test before assuming the spread holds.
Location & tenants
- Location reads 59/100 on livability (#493 in WA) — a working-class tenant base; expect higher turnover. Strengths: cost of living A+, housing A+; Watch: employment D, health & safety D, crime D-.
- Sequim School District (town): math 55% / reading 66% proficiency, ranked #64 of 291 in WA (top 22%) — acceptable for families but not a draw, mixed tenant base, ~2y average lease.
- Market conditions: 605 active listings in the ZIP; 166 units permitted in Clallam County in 2024 (0 in 5+ unit buildings).
Forward outlook
- Local home prices are declining (-3.0%/yr); year-one equity from $2k of loan paydown is wiped out by about $8k of value loss. Plan a longer hold.
- Clallam County population projected at +5% by 2050 — modest demand growth; plan on rents tracking national, not racing it.
Negotiation context
- It's been on market 84 days — a 6% lower offer ($121k) is reasonable based on typical stale-listing flexibility.
Risks & watch-outs
- Watch-outs: property tax is 3.2% of price.
Questions for the listing agent
- What do current leases actually rent for vs. the listed asking? Can we see a recent rent roll and the last 12 months of T-12 income?
- It's been on market 84 days. Have you received any prior offers? Is the seller open to a 6% concession, seller financing, or rate buy-down credit?
- Property tax is high relative to price — has the assessment been appealed recently, and will the sale trigger a re-assessment?
- Why hasn't it sold? Are there any deal-killer items the seller is aware of (foundation, flood, title, zoning, code violations)?
- Is there a deadline driving the sale (1031 exchange, divorce, estate, relocation)? That informs how much negotiation room exists.
- Schools are B-rated — typically a magnet for longer-tenancy family renters. What's the average tenant stay here, and is there a school-zone premium baked into asking?
- Crime grade is D in this area — have there been break-ins, vandalism, or insurance claims at this property in the last 3 years? What carrier currently insures it and at what premium?
- The area grade is low — what's the realistic commute time and amenity access for the typical tenant pool here? Any planned neighborhood developments (good or bad) we should know about?
- What's the average days-on-market for RENTAL listings here right now (not sales)? A rising rental-DOM trend means longer vacancies and softer asking-rent achievability than the comps imply.
- What's the recent tenant-quality profile in this submarket — average credit score on applications, eviction rate, late-payment / NSF rate, and stable-employment percentage? A property-management company in the area should have these aggregated.
- How much new for-sale + rental construction is in the pipeline within 1–3 miles? Heavy new supply typically softens prices + rents 12–24 months out; constrained supply supports both.
Investment metrics
- 1% rule
- 0.57% ✗
- Cap rate
- 3.38%
- Cash-on-cash
- -10.41%
- DSCR
- 0.54
- GRM
- 14.7
CMA / ARV
- ARV (median comp)
- $275,339
- List price
- $129,000
- Delta
- -53.15%
- Verdict
- UNDERPRICED
- Comps
- 1 within 2.0 mi
Projected returns pro-forma
-3.0% appreciation · 3.0% rent growth · sell at horizon
- IRR
- -35.1%
- Equity multiple
- -0.13×
- Total profit
- $-87,176
- Equity at exit
- $41,054
- IRR
- -46.3%
- Equity multiple
- -0.69×
- Total profit
- $-130,648
- Equity at exit
- $23,806
Cash invested: $77,095 (down + closing). Projections, not guarantees.
Landlord ↔ Tenant lean methodology
- Overall (STATE)
- 28 Tenant-Leaning
- State Washington
- 28 Tenant-Leaning · D+8
- County
- — inherits STATE
- City
- — inherits STATE
ZIP-level market 98382
- Active inventory
- 605
- Price-to-rent
- 6.9×
Monthly cashflow live
- Estimated rent
- $1,562 medium interval (Pro) →
- Mortgage (P&I)
- −$1,444
- Tax est. 1.5%
- −$344 /mo · $4,130/yr
- Insurance
- −$115
- HOA
- −$0
- Vacancy / Maint / Mgmt
- −$328
- Net cashflow
- $-669
Break-even live
UW: 25.0% down · 7.5% · 30yr · 1.5% tax · 5.0% vac · 8.0% maint · 8.0% mgmt
Financing live
Cash to close
- Down payment
- $68,835
- Closing costs
- $8,260
- Reserves months
- —
- Total cash needed
- —
Loan-product check · same deal, 3 products live
Conventional
25% down · 7.5% · 30yr
- Down + closing
- —
- Monthly P&I
- —
- Monthly cashflow
- —
- DSCR
- —
- Eligible?
- —
Personal DTI + credit; lowest rate.
DSCR
20% down · 8.5% · 30yr
- Down + closing
- —
- Monthly P&I
- —
- Monthly cashflow
- —
- DSCR
- —
- Eligible?
- —
No personal income docs; deal must DSCR.
Hard money
10% down · 12.0% · 12mo
- Down + closing
- —
- Monthly P&I
- —
- Monthly cashflow
- —
- DSCR
- —
- Eligible?
- —
Short-term bridge; refi at stabilization.
Listing history 17 events
-
2026-06-19days on market $129,000 Active 84 DOM
-
2026-06-18days on market $129,000 Active 83 DOM
-
2026-06-17days on market $129,000 Active 82 DOM
-
2026-06-16days on market $129,000 Active 81 DOM
-
2026-06-15days on market $129,000 Active 80 DOM
-
2026-06-14days on market $129,000 Active 78 DOM
-
2026-06-12days on market $129,000 Active 77 DOM
-
2026-06-09days on market $129,000 Active 74 DOM
-
2026-06-08days on market $129,000 Active 73 DOM
-
2026-06-07days on market $129,000 Active 72 DOM
-
2026-06-05days on market $129,000 Active 69 DOM
-
2026-06-03days on market $129,000 Active 68 DOM
-
2026-06-02days on market $129,000 Active 67 DOM
-
2026-06-01days on market $129,000 Active 66 DOM
-
2026-05-31days on market $129,000 Active 65 DOM
-
2026-05-30days on market $129,000 Active 64 DOM
-
2026-03-27$129,000 Active 343-char remark
Show marketing remark (343 chars)
Small quality built home with big home style, features and efficiency boasts extra large windows with transoms allowing natural light to bathe and brighten the entire home; large living room open to beautiful well equipped big home kitchen with full size cabinets, fixtures and appliances; king size bedroom and bath with large walk-in shower.
ⓘ Source: listings_history table (triggers on properties + properties_extension) + one-shot
backfill from property_details.listing_events for pre-trigger history.
Climate risk First Street
- Flood 1/10 Low FEMA zone X · 0% chance over 30 yrs
- Wildfire 1/10 Low
- Heat 2/10 Low 7 d/yr ≥83°F today · 18 d/yr by 30 yrs out
- Wind 1/10 Low
- Air quality 6/10 Major 7 unhealthy d/yr today · 8 by 30 yrs out
Nearby sold comps map
Loading sold comps map…
Walkable amenities ~0.75 mi
Loading nearby amenities…
Taxation est. · year 1
- Rental income
- $18,748
- − Mortgage interest
- −$15,423
- − Property taxes
- −$4,130
- − Insurance
- −$1,377
- − Repairs & maintenance
- −$1,500
- − Management
- −$1,500
- − Depreciation
- −$8,010
- Taxable loss
- −$13,192
- Est. tax savings @ 24.0%
- +$3,166
- After-tax cash flow
- $-4,857/yr
For passive investors: Depreciation is non-cash, so a rental often shows a tax loss while cash-flowing — sheltering income. Rental losses are passive: they offset passive income freely, and up to $25,000/yr can offset ordinary (W-2) income if you actively participate and your MAGI is under $100k (phasing out to $0 by $150k); unused losses carry forward. On sale, claimed depreciation is recaptured at up to 25%, and gains may owe capital-gains tax (a 1031 exchange can defer both). Figures are a year-1 estimate at your 24.0% rate — not tax advice; consult a CPA.
Condition & rehab AI · 12 photos
This modern single-family home is in excellent condition with a good condition score of 80. It features a well-equipped kitchen, modern bathrooms, and a well-maintained exterior. The home is move-in ready and would benefit from minor updates to enhance its curb appeal and modernize it.
Value-add opportunities
- Both Painting exterior and interior walls — Enhances curb appeal and interior aesthetics
- Both Landscaping improvements — Enhances curb appeal and adds value
- Both Add smart home features — Improves convenience and adds modern appeal
Renovation cost estimate screening
Value-add ROI direction
- Both Painting exterior and interior walls — Enhances curb appeal and interior aesthetics ↑
- Both Landscaping improvements — Enhances curb appeal and adds value ↑
- Both Add smart home features — Improves convenience and adds modern appeal ↑
ⓘ Cost ranges are severity-bucket heuristics (US national rule-of-thumb). Get contractor quotes + a written scope before underwriting a rehab budget.
Schools (NCES district)
- District
- Sequim School District
- NCES district ID
- 5307830
- Math proficiency
- 55% ▼ -1.00%
- Reading proficiency
- 66% ▲ 1.00%
- Median HH income
- $46,969
- Composite
- 52.77/100
- National rank
- #3312
- State rank
- #64 of 291 in WA
Livability — Carlsborg
- Score
- 59/100
- State rank
- #493
- US rank
- #20503
Category grades
Schools grade is shown separately in the Schools card above.
Census & demographics
- Census place
- Carlsborg, WA
- County
- Clallam County · 31,052 people
- Metro
- Port Angeles, WA
- Population (ZIP)
- 31,052
- Household income
- $74,189
- Rent vs Own
- Severe rent burden
- 666.0
Population outlook (Clallam County) Hauer SSP2
- Today (2025)
- 76,817 people
- By 2030
- 78,177 · +1.8%
- By 2040
- 79,795 · +3.9%
- By 2050
- 80,890 · +5.3%
- By 2075
- 83,933 · +9.3%
- By 2100
- 82,141 · +6.9%
Race, ethnicity, and origin ACS 2023
- Neighborhood character
- Predominantly White (85%)
- Race & ethnicity
- White 85% Two or more races 7% Hispanic / Latino 4% Asian 2%
- Common ancestry
- Portuguese 5% Slovak 5% Italian 4%
- Foreign-born
- 6% · Canada
- Languages at home
- 95% English-only · Spanish 2% German/W. Germanic 1% Other Indo-European 1%
Political lean MEDSL · Clallam
- 2024 margin
- Lean D (+7.9) · D 52.6% · R 44.7% · Other 2.7%
- 2008→2024 swing
- +4.6pp toward D · 2008: 3.3pp · 2024: 7.9pp
- All cycles
- 2024: D+7.9 2020: D+3.4 2016: R+1.6 2012: D+0.4 2008: D+3.3
Not yet ingested
- Civics
- —
Market trends
- HPI YoY
- ▼ -225.89%
- Current HPI
- 181.4372
- Rent YoY
- —
- Metro
- Port Angeles, WA
- State GDP YoY
- ▲ 4.65%
- F500 in state
- 22
Industry mix (Fortune 500 HQ in WA)
| Industry | F500 HQs | Revenue |
|---|---|---|
| Retail | 2 | $269B |
|
||
| Technology / Retail | 1 | $638B |
|
||
| Technology | 1 | $245B |
|
||
| Telecommunications | 1 | $38B |
|
||
| Food / Beverage | 1 | $36B |
|
||
| Automotive / Trucks | 1 | $34B |
|
||
Price history
1 event — show timeline
- 2026-03-27 Listed $129,000 Zillow
Cash-flow waterfall
monthlySold comps — $/sqft
last 12 mo · ≤1 miLoading sold comps…