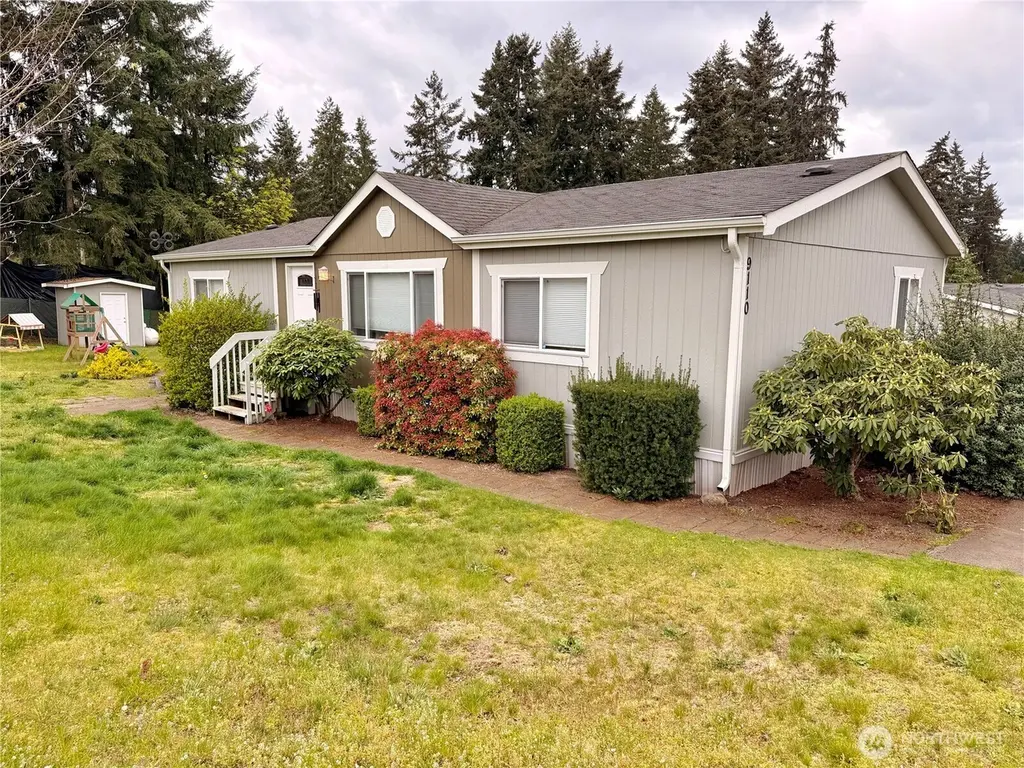
9110 218th Street Ct E · Graham, WA
Flood risk 1/10 · Minimal
- FEMA flood zone
- X (unshaded)
- Chance of flooding over 30 yrs
- 0.0%
- Est. flood insurance / yr
- $507 – $1,088
Fire risk 1/10 · Minimal
- Est. fire insurance / yr
- $604 – $1,122
Heat risk 3/10 · Minor
- Hot days now (above 87°F)
- 7 days/yr
- Hot days in 30 yrs
- 15 days/yr
Wind risk 1/10 · Minimal
- Chance of severe wind over 30 yrs
- —
Air-quality risk 7/10 · Major
- Unhealthy air days now
- 10 days/yr
- Unhealthy air days in 30 yrs
- 10 days/yr
Risk factors via First Street. Map © Google.
Why this score? — see what drove the B- grade
The composite is a weighted blend of 9 inputs, each scored 0–100. Each bar is that input's sub-score; the figure is the points it added to the 100-point composite (weight × sub-score).
- Cash flow +30.0/30.0
- 1% rule +10.0/10.0
- DSCR +10.0/10.0
- Schools +4.9/10.0
- Condition / age +3.8/5.0
- Rent growth +3.3/5.0
- Livability +3.2/5.0
- ARV discount +0.0/15.0
- Appreciation +0.0/10.0
$180,000
🖨 Deal sheet (PDF) 📄 Offer letter ✓ Due diligence
Listing remarks
Beautifully maintained and move-in ready in an all-ages park, this charming home offers the perfect blend of comfort, function, and style. Situated on a spacious lot, the property features a spacious yard with mature landscaping, ideal for relaxing, entertaining, or creating your dream outdoor space. A versatile 8x8 shed and 10x16 workshop with electricity and built-in workbench provide endless possibilities for hobbies, storage, or projects. Inside, you’ll love the bright, open concept layout designed for modern living. The fully updated kitchen shines with sleek cabinetry, quartz countertops, stainless steel appliances, beverage fridge, and stylish under-cabinet lighting, perfect fo
Key facts
- Spacious yard
- Quartz countertops
- 10x16 workshop
Tags
Property features AI
Finance
- Other: Taxes and specific financial amounts excluded
- Financial info: Listing terms: Cash or Conventional; Land lease amount applies
- HOA & community: Located in Shady Woods park; Park approved for sale; 19 homes in the park; Land lease (monthly)
Exterior
- Parking: 2 open/uncovered parking spaces
- Utilities: Public water; Propane water heater; Sewer provided by park; Power via Tacoma Power; Internet: Xfinity; Energy sources: Electric and Propane
- Home design: Manufactured home (double wide); One level; Entry level on main floor
- Construction: Metal/vinyl construction; Pillar/post/pier foundation with tie-downs; Manufactured after 06/15/1976; Model: Maver-ICK, Make: Redmin
- Exterior features: Metal/vinyl exterior; Corner lot; Dead-end street; Paved lot
Interior
- Kitchen: Dishwasher; Microwave; Refrigerator; Stove/Range; Kitchen with eating space
- Bedrooms: 3 bedrooms
- Flooring: Laminate; Carpet
- Bathrooms: 2 full bathrooms; 2 bathtubs; 2 showers
- Heating & cooling: 90%+ high-efficiency heating (forced air); 90%+ high-efficiency central air conditioning
- Interior features: Water heater; Jetted/soaking tub; Vaulted ceilings; Patio/porch/deck; Landscaped
- Laundry & utility: Washer; Dryer
Neighborhood map
What this means for you Summary
Snapshot
- This is a 3-bed/2.0-bath manufactured listed at $180k. Condition is rated good.
Deal economics
- At list price, monthly cash flow is $960 ($12k/yr) — positive.
- The deal already cash-flows at list — no discount required.
- Meets the 1% rule at list price ($3k rent vs $180k).
- Recommended offer: $175k (3.0% below list) — sets the bar for market timing.
- Cap rate 12.7% vs local median 3.6% in Graham — top-decile yield for the area; either an underpriced asset or a hidden risk that comps aren't pricing in. Stress-test before assuming the spread holds.
Location & tenants
- Location reads 64/100 on livability (#373 in WA) — a middle-class / working-renter tenant base. Strengths: employment A+, housing A+; Watch: crime C-, health & safety C-, amenities F.
- Bethel School District (suburban): math 47% / reading 59% proficiency, ranked #103 of 291 in WA (top 35%) — acceptable for families but not a draw, mixed tenant base, ~2y average lease.
- Market conditions: Rents rising (+3.3%/yr); 236 active listings in the ZIP; 1 comparable units currently listed for rent nearby; high-income renter base; 3,209 units permitted in Pierce County in 2024 (1,269 in 5+ unit buildings).
Forward outlook
- Local home prices are declining (-3.0%/yr); year-one equity from $1k of loan paydown is wiped out by about $5k of value loss. Plan a longer hold.
- Pierce County population projected at +26% by 2050 — long-run rental-demand tailwind backs the buy-and-hold thesis.
- At projected returns (-3.0% appreciation + 3.3% rent growth), your $50k cash investment doubles in ~6 years — after that, you're playing with house money.
Negotiation context
- It's been on market 59 days — a 3% lower offer ($175k) is reasonable based on typical stale-listing flexibility.
Questions for the listing agent
- It's been on market 59 days. Have you received any prior offers? Is the seller open to a 3% concession, seller financing, or rate buy-down credit?
- Is there a deadline driving the sale (1031 exchange, divorce, estate, relocation)? That informs how much negotiation room exists.
- What's the average days-on-market for RENTAL listings here right now (not sales)? A rising rental-DOM trend means longer vacancies and softer asking-rent achievability than the comps imply.
- What's the recent tenant-quality profile in this submarket — average credit score on applications, eviction rate, late-payment / NSF rate, and stable-employment percentage? A property-management company in the area should have these aggregated.
- How much new for-sale + rental construction is in the pipeline within 1–3 miles? Heavy new supply typically softens prices + rents 12–24 months out; constrained supply supports both.
Investment metrics
- 1% rule
- 1.55% ✓
- Cap rate
- 12.69%
- Cash-on-cash
- 22.86%
- DSCR
- 2.02
- GRM
- 5.4
CMA / ARV
- ARV (on-the-fly)
- $129,600
- Comps found
- 7
Show comp detail 7 sales within ~0.75 mi
| Address | Dist | Beds/Ba | Sqft | Sold | Price | $/sf | Match |
|---|---|---|---|---|---|---|---|
| 9016 220th Street Ct E | 0.14mi | 3/2.0 | 1,288 (-1%) | 3mo | $405,000 | $314 | 90 |
| 9005 219th Street Ct E | 0.09mi | 3/2.0 | 1,340 (+3%) | 1mo | $380,000 | $284 | 89 |
| 22210 92nd Avenue Ct E #6 | 0.25mi | 3/2.0 | 1,294 (-0%) | 17mo | $130,000 | $100 | 74 |
| 22505 91st Ave E | 0.47mi | 3/2.0 | 1,344 (+4%) | 6mo | $113,300 | $84 | 67 |
| 22607 91st Avenue Ct E #10 | 0.49mi | 3/2.0 | 1,344 (+4%) | 15mo | $150,000 | $112 | 58 |
| 8911 226th St E #18 | 0.47mi | 3/2.0 | 1,188 (-8%) | 18mo | $105,000 | $88 | 50 |
| 22716 91st Avenue Ct E #40 | 0.55mi | 3/2.0 | 1,232 (-5%) | 20mo | $120,000 | $97 | 50 |
Match score weights: distance 35% · size 25% · config 20% · recency 20%. Top-matched comps best support the ARV.
Projected returns pro-forma
-3.0% appreciation · 3.32% rent growth · sell at horizon
- IRR
- 16.2%
- Equity multiple
- 1.65×
- Total profit
- $32,933
- Equity at exit
- $26,839
- IRR
- 25.0%
- Equity multiple
- 3.21×
- Total profit
- $111,320
- Equity at exit
- $15,563
Cash invested: $50,400 (down + closing). Projections, not guarantees.
Landlord ↔ Tenant lean methodology
- Overall (STATE)
- 28 Tenant-Leaning
- State Washington
- 28 Tenant-Leaning · D+8
- County
- — inherits STATE
- City
- — inherits STATE
ZIP-level market 98338
- Rents YoY
- 3.3%
- Active inventory
- 236
- Price-to-rent
- 5.4×
Monthly cashflow live
- Estimated rent
- $2,790 medium interval (Pro) →
- Mortgage (P&I)
- −$944
- Tax est. 1.5%
- −$225 /mo · $2,700/yr
- Insurance
- −$75
- HOA
- −$0
- Vacancy / Maint / Mgmt
- −$586
- Net cashflow
- $960
Break-even live
Sensitivity live
| Price | -10% $1,085 | -5% $1,022 | +0% $960 | +5% $898 | +10% $836 |
|---|---|---|---|---|---|
| Rent | -10% $740 | -5% $850 | +0% $960 | +5% $1,070 | +10% $1,181 |
| Rate | -1.0pp $1,051 | -0.5pp $1,006 | base $960 | +0.5pp $914 | +1.0pp $866 |
UW: 25.0% down · 7.5% · 30yr · 1.5% tax · 5.0% vac · 8.0% maint · 8.0% mgmt
Financing live
Cash to close
- Down payment
- $45,000
- Closing costs
- $5,400
- Reserves months
- —
- Total cash needed
- —
Loan-product check · same deal, 3 products live
Conventional
25% down · 7.5% · 30yr
- Down + closing
- —
- Monthly P&I
- —
- Monthly cashflow
- —
- DSCR
- —
- Eligible?
- —
Personal DTI + credit; lowest rate.
DSCR
20% down · 8.5% · 30yr
- Down + closing
- —
- Monthly P&I
- —
- Monthly cashflow
- —
- DSCR
- —
- Eligible?
- —
No personal income docs; deal must DSCR.
Hard money
10% down · 12.0% · 12mo
- Down + closing
- —
- Monthly P&I
- —
- Monthly cashflow
- —
- DSCR
- —
- Eligible?
- —
Short-term bridge; refi at stabilization.
Rent comps 1 comps
| Address | Beds | Baths | Sqft | Rent | $/sqft | DOM | Units | Dist |
|---|---|---|---|---|---|---|---|---|
| 19906 100th Avenue Ct E Graham, WA | 3.0 | 2.0 | 1322 | $2,749 | $2.08 | 17d | 1 | 1.32mi |
Listing history 16 events
-
2026-06-21days on market $180,000 Active 59 DOM
-
2026-06-18days on market $180,000 Active 56 DOM
-
2026-06-17days on market $180,000 Active 55 DOM
-
2026-06-16days on market $180,000 Active 54 DOM
-
2026-06-15days on market $180,000 Active 53 DOM
-
2026-06-13days on market $180,000 Active 51 DOM
-
2026-06-13days on market $180,000 Active 50 DOM
-
2026-06-09days on market $180,000 Active 47 DOM
-
2026-06-08days on market $180,000 Active 46 DOM
-
2026-06-07days on market $180,000 Active 45 DOM
-
2026-06-04days on market $180,000 Active 42 DOM
-
2026-06-03days on market $180,000 Active 41 DOM
-
2026-06-02days on market $180,000 Active 40 DOM
-
2026-06-01days on market $180,000 Active 39 DOM
-
2026-05-31days on market $180,000 Active 38 DOM
-
2026-04-23$180,000 Active
ⓘ Source: listings_history table (triggers on properties + properties_extension) + one-shot
backfill from property_details.listing_events for pre-trigger history.
Climate risk First Street
- Flood 1/10 Low FEMA zone X (unshaded) · 0% chance over 30 yrs
- Wildfire 1/10 Low
- Heat 3/10 Moderate 7 d/yr ≥87°F today · 15 d/yr by 30 yrs out
- Wind 1/10 Low
- Air quality 7/10 Severe 10 unhealthy d/yr today · 10 by 30 yrs out
Nearby sold comps map
Loading sold comps map…
Walkable amenities ~0.75 mi
Loading nearby amenities…
Taxation est. · year 1
- Rental income
- $33,481
- − Mortgage interest
- −$10,083
- − Property taxes
- −$2,700
- − Insurance
- −$900
- − Repairs & maintenance
- −$2,678
- − Management
- −$2,678
- − Depreciation
- −$5,236
- Taxable income
- $9,205
- Est. tax owed @ 24.0%
- −$2,209
- After-tax cash flow
- $9,314/yr
For passive investors: Depreciation is non-cash, so a rental often shows a tax loss while cash-flowing — sheltering income. Rental losses are passive: they offset passive income freely, and up to $25,000/yr can offset ordinary (W-2) income if you actively participate and your MAGI is under $100k (phasing out to $0 by $150k); unused losses carry forward. On sale, claimed depreciation is recaptured at up to 25%, and gains may owe capital-gains tax (a 1031 exchange can defer both). Figures are a year-1 estimate at your 24.0% rate — not tax advice; consult a CPA.
Condition & rehab AI · 12 photos
This move-in ready manufactured home offers a good condition with updated kitchen and neutral paint. Landscaping and painting would further enhance its value.
Value-add opportunities
- Both landscaping — enhances curb appeal and outdoor living space
- Both painting — fresh paint can make a significant difference in the home's appearance
- Both landscaping — improves curb appeal and outdoor living space
Renovation cost estimate screening
Value-add ROI direction
- Both landscaping — enhances curb appeal and outdoor living space ↑
- Both painting — fresh paint can make a significant difference in the home's appearance ↑
- Both landscaping — improves curb appeal and outdoor living space ↑
ⓘ Cost ranges are severity-bucket heuristics (US national rule-of-thumb). Get contractor quotes + a written scope before underwriting a rehab budget.
Schools (NCES district)
- District
- Bethel School District
- NCES district ID
- 5300480
- Math proficiency
- 47% ▬ 0.00%
- Reading proficiency
- 59% ▲ 2.00%
- Median HH income
- $65,872
- Composite
- 48.66/100
- National rank
- #4568
- State rank
- #103 of 291 in WA
Livability — Graham
- Score
- 64/100
- State rank
- #373
- US rank
- #14219
Category grades
Schools grade is shown separately in the Schools card above.
Census & demographics
- Census place
- Graham, WA
- County
- Pierce County · 788,257 people
- City population
- 32,687
- Metro
- Seattle-Tacoma-Bellevue, WA
- Population (ZIP)
- 32,687
- Household income
- $114,819
- Rent vs Own
- Severe rent burden
- 236.0
Population outlook (Pierce County) Hauer SSP2
- Today (2025)
- 956,648 people
- By 2030
- 1,010,862 · +5.7%
- By 2040
- 1,113,170 · +16.4%
- By 2050
- 1,206,524 · +26.1%
- By 2075
- 1,436,425 · +50.2%
- By 2100
- 1,563,654 · +63.5%
Race, ethnicity, and origin ACS 2023
- Neighborhood character
- Predominantly White (71%)
- Race & ethnicity
- White 71% Two or more races 15% Hispanic / Latino 12% Asian 3% Black 3% Pacific Islander 2% Native American 1%
- Hispanic origin (detail)
- Mexican 7%
- Common ancestry
- Italian 4% Portuguese 4% Iranian 3%
- Foreign-born
- 7% · Canada, South Korea, China
- Languages at home
- 88% English-only · Spanish 5% Russian/Polish/Slavic 2% Other Asian/Pacific 1%
Political lean MEDSL · Pierce
- 2024 margin
- D (+10.8) · D 53.9% · R 43.1% · Other 3.0%
- 2008→2024 swing
- -1.4pp toward R · 2008: 12.2pp · 2024: 10.8pp
- All cycles
- 2024: D+10.8 2020: D+11.2 2016: D+7.5 2012: D+11.0 2008: D+12.2
Not yet ingested
- Civics
- —
Market trends
- HPI YoY
- ▼ -501.28%
- Current HPI
- 304.4241
- Rent YoY
- ▲ 3.32%
- Metro
- Seattle-Tacoma-Bellevue, WA
- State GDP YoY
- ▲ 4.65%
- F500 in state
- 22
Industry mix (Fortune 500 HQ in WA)
| Industry | F500 HQs | Revenue |
|---|---|---|
| Retail | 2 | $269B |
|
||
| Technology / Retail | 1 | $638B |
|
||
| Technology | 1 | $245B |
|
||
| Telecommunications | 1 | $38B |
|
||
| Food / Beverage | 1 | $36B |
|
||
| Automotive / Trucks | 1 | $34B |
|
||
Price history
1 event — show timeline
- 2026-04-23 Listed $180,000 NWMLS as Distributed by MLS Grid
Cash-flow waterfall
monthlySold comps — $/sqft
last 12 mo · ≤1 miLoading sold comps…