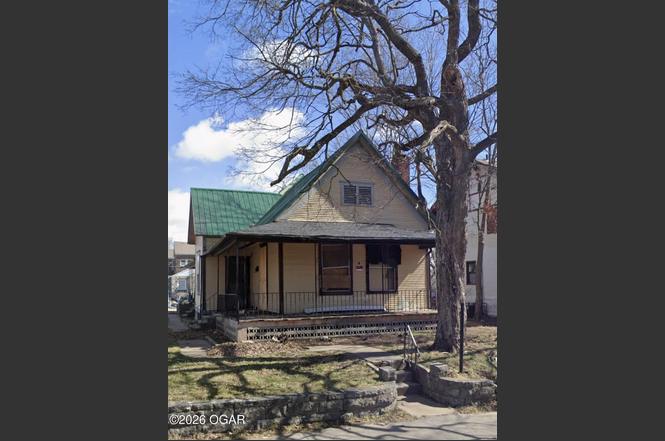
123 N Byers Ave · Joplin, MO
Flood risk 1/10 · Minimal
- FEMA flood zone
- X (unshaded)
- Chance of flooding over 30 yrs
- 0.0%
- Est. flood insurance / yr
- $473 – $860
Fire risk 3/10 · Minor
- Est. fire insurance / yr
- $1,054 – $1,958
Heat risk 5/10 · Moderate
- Hot days now (above 107°F)
- 7 days/yr
- Hot days in 30 yrs
- 20 days/yr
Wind risk 2/10 · Minimal
- Chance of severe wind over 30 yrs
- 2.0%
Air-quality risk 2/10 · Minimal
- Unhealthy air days now
- 1 days/yr
- Unhealthy air days in 30 yrs
- 1 days/yr
Risk factors via First Street. Map © Google.
Why this score? — see what drove the B- grade
The composite is a weighted blend of 9 inputs, each scored 0–100. Each bar is that input's sub-score; the figure is the points it added to the 100-point composite (weight × sub-score).
- Cash flow +30.0/30.0
- 1% rule +10.0/10.0
- DSCR +10.0/10.0
- ARV discount +7.5/15.0
- Rent growth +3.2/5.0
- Livability +3.2/5.0
- Schools +2.9/10.0
- Condition / age +2.5/5.0
- Appreciation +0.0/10.0
$42,000
🖨 Deal sheet (PDF) 📄 Offer letter ✓ Due diligence
Listing remarks MLS
So many possibilities with this amazing little gem. Beautiful hardwood floors, built-ins, wrap around porches, sunporch on back of house. Detached garage with upstairs. 2 bedroom, 1 bath and basement on a corner lot.
Key facts
- Updated systems
- Corner lot
- Detached garage
Tags
Property features AI
Exterior
- Parking: Detached 2-car garage; Other parking: 2-car detached garage
- Utilities: Public sewer
- Home design: Single-family residence; Residential property
- Construction: Wood siding; Stone foundation; Composition roof; Built area: above-grade finished area 1,481
- Exterior features: Wrap-around porch
Interior
- Flooring: Wood flooring
- Bathrooms: 2 full bathrooms
- Heating & cooling: No heating specified; No cooling specified
- Interior features: Wood flooring; Fireplace
Neighborhood map
What this means for you Summary
Snapshot
- This is a 3-bed/2.0-bath other listed at $42k.
Deal economics
- At list price, monthly cash flow is $719 ($9k/yr) — positive.
- The deal already cash-flows at list — no discount required.
- Meets the 1% rule at list price ($1k rent vs $42k).
- Recommended offer: $39k (6.0% below list) — sets the bar for market timing.
- Cap rate 26.8% vs local median 5.1% in Joplin — top-decile yield for the area; either an underpriced asset or a hidden risk that comps aren't pricing in. Stress-test before assuming the spread holds.
Location & tenants
- Location reads 64/100 on livability (#318 in MO) — a middle-class / working-renter tenant base. Strengths: cost of living A+, housing A+; Watch: crime F, amenities F, commute F.
- Joplin Schools (urban): math 30% / reading 39% proficiency, ranked #231 of 324 in MO (top 71%) — families likely to look elsewhere, expect single-tenant / working-renter base with shorter leases.
- Zoned schools: Columbia Elem. (math 37% / reading 37%); North Middle (math 26% / reading 35%, grade F, #283 of 391 statewide, top 74%, 517 students, 65% FRL); Joplin High (math 32% / reading 46%, grade F, #287 of 521 statewide, top 55%, 2,233 students, 50% FRL) — zoned schools at 58% FRL track the district average.
- Market conditions: Rents rising (+3.0%/yr); 378 active listings in the ZIP; 9 comparable units currently listed for rent nearby; rentals at typical pace (median 23d on market — plan ~3-4 weeks tenant-placement turnaround); 602 units permitted in Jasper County in 2024 (0 in 5+ unit buildings).
Forward outlook
- Local home prices are declining (-3.0%/yr); year-one equity from $290 of loan paydown is wiped out by about $1k of value loss. Plan a longer hold.
- At projected returns (-3.0% appreciation + 3.0% rent growth), your $12k cash investment doubles in ~2 years — after that, you're playing with house money.
Negotiation context
- It's been on market 82 days — a 6% lower offer ($39k) is reasonable based on typical stale-listing flexibility.
- 2 sale attempts since 5y ago; this cycle's ask has dropped $5k (11%) from the opening price — seller is motivated, your offer sets the floor, not the list.
Risks & watch-outs
- Watch-outs: built in 1930 — expect roof / HVAC / electrical / plumbing capex.
- Climate carrying-cost: extreme-heat days projected 7→20/yr by 2055 (HVAC capex compounding) — expect insurance premiums to compound above CPI over the hold.
Questions for the listing agent
- It's been on market 82 days. Have you received any prior offers? Is the seller open to a 6% concession, seller financing, or rate buy-down credit?
- Built in 1930 — when were the roof, HVAC, electrical panel, plumbing, and water heater last replaced?
- Why hasn't it sold? Are there any deal-killer items the seller is aware of (foundation, flood, title, zoning, code violations)?
- Is there a deadline driving the sale (1031 exchange, divorce, estate, relocation)? That informs how much negotiation room exists.
- Schools are D-rated, which usually means shorter tenancies and higher turnover. Who's the typical renter profile here, and what's been the actual vacancy rate?
- Crime grade is F in this area — have there been break-ins, vandalism, or insurance claims at this property in the last 3 years? What carrier currently insures it and at what premium?
- What's the average days-on-market for RENTAL listings here right now (not sales)? A rising rental-DOM trend means longer vacancies and softer asking-rent achievability than the comps imply.
- What's the recent tenant-quality profile in this submarket — average credit score on applications, eviction rate, late-payment / NSF rate, and stable-employment percentage? A property-management company in the area should have these aggregated.
- How much new for-sale + rental construction is in the pipeline within 1–3 miles? Heavy new supply typically softens prices + rents 12–24 months out; constrained supply supports both.
Investment metrics
- 1% rule
- 3.00% ✓
- Cap rate
- 26.83%
- Cash-on-cash
- 73.33%
- DSCR
- 4.26
- GRM
- 2.8
CMA / ARV
No comps found within radius.
Projected returns pro-forma
-3.0% appreciation · 2.95% rent growth · sell at horizon
- IRR
- 73.0%
- Equity multiple
- 4.31×
- Total profit
- $38,914
- Equity at exit
- $6,262
- IRR
- 76.9%
- Equity multiple
- 8.87×
- Total profit
- $92,610
- Equity at exit
- $3,631
Cash invested: $11,760 (down + closing). Projections, not guarantees.
Landlord ↔ Tenant lean methodology
- Overall (STATE)
- 81 Strongly Landlord-Friendly
- State Missouri
- 81 Strongly Landlord-Friendly · R+10
- County
- — inherits STATE
- City
- — inherits STATE
ZIP-level market 64801
- Rents YoY
- 3.0%
- Active inventory
- 378
- Price-to-rent
- 2.8×
Monthly cashflow live
- Estimated rent
- $1,260 high interval (Pro) →
- Mortgage (P&I)
- −$220
- Tax from tax record
- −$39 /mo · $470/yr
- Insurance
- −$18
- HOA
- −$0
- Vacancy / Maint / Mgmt
- −$265
- Net cashflow
- $719
Break-even live
Sensitivity live
| Price | -10% $742 | -5% $731 | +0% $719 | +5% $707 | +10% $695 |
|---|---|---|---|---|---|
| Rent | -10% $619 | -5% $669 | +0% $719 | +5% $768 | +10% $818 |
| Rate | -1.0pp $740 | -0.5pp $729 | base $719 | +0.5pp $708 | +1.0pp $697 |
UW: 25.0% down · 7.5% · 30yr · 1.5% tax · 5.0% vac · 8.0% maint · 8.0% mgmt
Financing live
Cash to close
- Down payment
- $10,500
- Closing costs
- $1,260
- Reserves months
- —
- Total cash needed
- —
Loan-product check · same deal, 3 products live
Conventional
25% down · 7.5% · 30yr
- Down + closing
- —
- Monthly P&I
- —
- Monthly cashflow
- —
- DSCR
- —
- Eligible?
- —
Personal DTI + credit; lowest rate.
DSCR
20% down · 8.5% · 30yr
- Down + closing
- —
- Monthly P&I
- —
- Monthly cashflow
- —
- DSCR
- —
- Eligible?
- —
No personal income docs; deal must DSCR.
Hard money
10% down · 12.0% · 12mo
- Down + closing
- —
- Monthly P&I
- —
- Monthly cashflow
- —
- DSCR
- —
- Eligible?
- —
Short-term bridge; refi at stabilization.
Rent comps 9 comps
| Address | Beds | Baths | Sqft | Rent | $/sqft | DOM | Units | Dist |
|---|---|---|---|---|---|---|---|---|
| 120 /122 S Pearl Ave #122 Joplin, MO | 3.0 | 2.0 | 1200 | $1,250 | $1.04 | 23d | 1 | 0.13mi |
| 101 N Main Street Rd Unit 1806 Joplin, MO | 3.0 | 2.0 | 1386 | $1,300 | $0.94 | 23d | 1 | 0.25mi |
| 306 N Connor Ave Joplin, MO | 2.0 | 1.0 | 1072 | $1,000 | $0.93 | 23d | 1 | 0.33mi |
| 524 S Moffet Ave Joplin, MO | 3.0 | 1.0 | 900 | $855 | $0.95 | 23d | 1 | 0.43mi |
| 211 S Galena Ave Joplin, MO | 3.0 | 2.0 | 1200 | $1,550 | $1.29 | 23d | 1 | 0.58mi |
| 1012 Central St Joplin, MO | 3.0 | 2.0 | 1100 | $1,395 | $1.27 | 23d | 1 | 0.83mi |
| 1013 Broadway St Joplin, MO | 3.0 | 1.0 | 917 | $995 | $1.09 | 23d | 1 | 0.84mi |
| 623 W Junge Blvd Joplin, MO | 3.0 | 2.0 | 1217 | $1,500 | $1.23 | 23d | 1 | 1.04mi |
| 1806 Pennsylvania Ave Joplin, MO | 3.0 | 1.0 | 1295 | $1,050 | $0.81 | 23d | 1 | 1.44mi |
Listing history 9 events
-
2026-04-26status Pending
-
2026-04-09price $42,000
-
2026-03-31price $45,000
-
2026-02-03$47,000 Active
-
2022-10-04soldstatus
-
2021-11-10soldstatus 216-char remark
Show marketing remark (216 chars)
So many possibilities with this amazing little gem. Beautiful hardwood floors, built-ins, wrap around porches, sunporch on back of house. Detached garage with upstairs. 2 bedroom, 1 bath and basement on a corner lot.
-
2021-08-06$27,500 216-char remark
Show marketing remark (216 chars)
So many possibilities with this amazing little gem. Beautiful hardwood floors, built-ins, wrap around porches, sunporch on back of house. Detached garage with upstairs. 2 bedroom, 1 bath and basement on a corner lot.
-
2018-12-27soldstatus
-
2003-09-10soldstatus
ⓘ Source: listings_history table (triggers on properties + properties_extension) + one-shot
backfill from property_details.listing_events for pre-trigger history.
Tax reassessment forecast MO · Resets to sale price
- Current annual tax
- $470 · $39/mo
- Projected year-2 tax
- $470 · $39/mo
- Expected delta
- $0/yr ($0/mo · 0.0%)
ⓘ Screening estimate from a state-policy table — verify with the county assessor before closing.
Climate risk First Street
- Flood 1/10 Low FEMA zone X (unshaded) · 0% chance over 30 yrs
- Wildfire 3/10 Moderate
- Heat 5/10 Major 7 d/yr ≥107°F today · 20 d/yr by 30 yrs out
- Wind 2/10 Low 2% chance of damaging wind over 30 yrs
- Air quality 2/10 Low 1 unhealthy d/yr today · 1 by 30 yrs out
Nearby sold comps map
Loading sold comps map…
Walkable amenities ~0.75 mi
Loading nearby amenities…
Taxation est. · year 1
- Rental income
- $15,123
- − Mortgage interest
- −$2,353
- − Property taxes
- −$470
- − Insurance
- −$210
- − Repairs & maintenance
- −$1,210
- − Management
- −$1,210
- − Depreciation
- −$1,222
- Taxable income
- $8,449
- Est. tax owed @ 24.0%
- −$2,028
- After-tax cash flow
- $6,596/yr
For passive investors: Depreciation is non-cash, so a rental often shows a tax loss while cash-flowing — sheltering income. Rental losses are passive: they offset passive income freely, and up to $25,000/yr can offset ordinary (W-2) income if you actively participate and your MAGI is under $100k (phasing out to $0 by $150k); unused losses carry forward. On sale, claimed depreciation is recaptured at up to 25%, and gains may owe capital-gains tax (a 1031 exchange can defer both). Figures are a year-1 estimate at your 24.0% rate — not tax advice; consult a CPA.
Schools (NCES district)
- District
- Joplin Schools
- NCES district ID
- 2916350
- Math proficiency
- 30% ▼ -3.00%
- Reading proficiency
- 39% ▼ -3.00%
- Median HH income
- $38,648
- Composite
- 28.82/100
- National rank
- #6657
- State rank
- #231 of 324 in MO
Livability — Joplin
- Score
- 64/100
- State rank
- #318
- US rank
- #14578
Category grades
Schools grade is shown separately in the Schools card above.
Census & demographics
- Census place
- Joplin, MO
- County
- Jasper County · 79,035 people
- City population
- 73,303
- Metro
- Joplin, MO
- Population (ZIP)
- 36,287
- Household income
- $52,620
- Rent vs Own
- Severe rent burden
- 1710.0
Population outlook (Jasper County) Hauer SSP2
- Today (2025)
- 120,033 people
- By 2030
- 120,091 · +0.0%
- By 2040
- 119,297 · -0.6%
- By 2050
- 117,705 · -1.9%
- By 2075
- 110,402 · -8.0%
- By 2100
- 99,719 · -16.9%
Race, ethnicity, and origin ACS 2023
- Neighborhood character
- Predominantly White (82%)
- Race & ethnicity
- White 82% Two or more races 8% Hispanic / Latino 6% Black 3% Asian 2% Native American 1%
- Hispanic origin (detail)
- Mexican 4%
- Common ancestry
- Slovak 2% Lithuanian 2% Italian 2%
- Foreign-born
- 4% · Canada
- Languages at home
- 94% English-only · Spanish 3% Other Asian/Pacific 1%
Political lean MEDSL · Jasper
- 2024 margin
- Solid R (+46.8) · D 25.9% · R 72.7% · Other 1.4%
- 2008→2024 swing
- -13.6pp toward R · 2008: -33.2pp · 2024: -46.8pp
- All cycles
- 2024: R+46.8 2020: R+46.2 2016: R+50.8 2012: R+41.0 2008: R+33.2
Not yet ingested
- Civics
- —
Market trends
- HPI YoY
- ▼ -174.15%
- Current HPI
- 248.5056
- Rent YoY
- ▲ 2.95%
- Metro
- Joplin, MO
- State GDP YoY
- ▲ 1.84%
- F500 in state
- 20
Industry mix (Fortune 500 HQ in MO)
| Industry | F500 HQs | Revenue |
|---|---|---|
| Healthcare | 1 | $163B |
|
||
| Insurance | 1 | $21B |
|
||
| Industrial Technology | 1 | $17B |
|
||
| Retail | 1 | $16B |
|
||
| Industrial Distribution | 1 | $10B |
|
||
| Utilities | 1 | $9B |
|
||
Price history
+52.7% since first listed9 events — show timeline
- 2026-04-26 Pending — OGAR
- 2026-04-09 Price Changed $42,000 OGAR
- 2026-03-31 Price Changed $45,000 OGAR
- 2026-02-03 Listed $47,000 OGAR
- 2022-10-04 Sold (Public Records) — Public Records
- 2021-11-10 Sold (MLS) — OGAR
- 2021-08-06 Listed $27,500 OGAR
- 2018-12-27 Sold (Public Records) — Public Records
- 2003-09-10 Sold (Public Records) — Public Records
Property tax history
+1.5%/yrLatest (2025): $470 · +12.5% YoY. Source: county tax records.
Cash-flow waterfall
monthlySold comps — $/sqft
last 12 mo · ≤1 miLoading sold comps…